Home > Analyses > Industrials > IDEX Corporation
IDEX Corporation powers critical industries by engineering precise fluid-handling and safety solutions that touch daily lives worldwide. Its leadership spans fluid metering, health sciences, and fire safety, delivering innovative pumps, valves, and medical devices renowned for quality and reliability. As I examine IDEX’s diverse portfolio and market position, I question whether its robust fundamentals justify the current valuation and signal sustainable growth ahead.
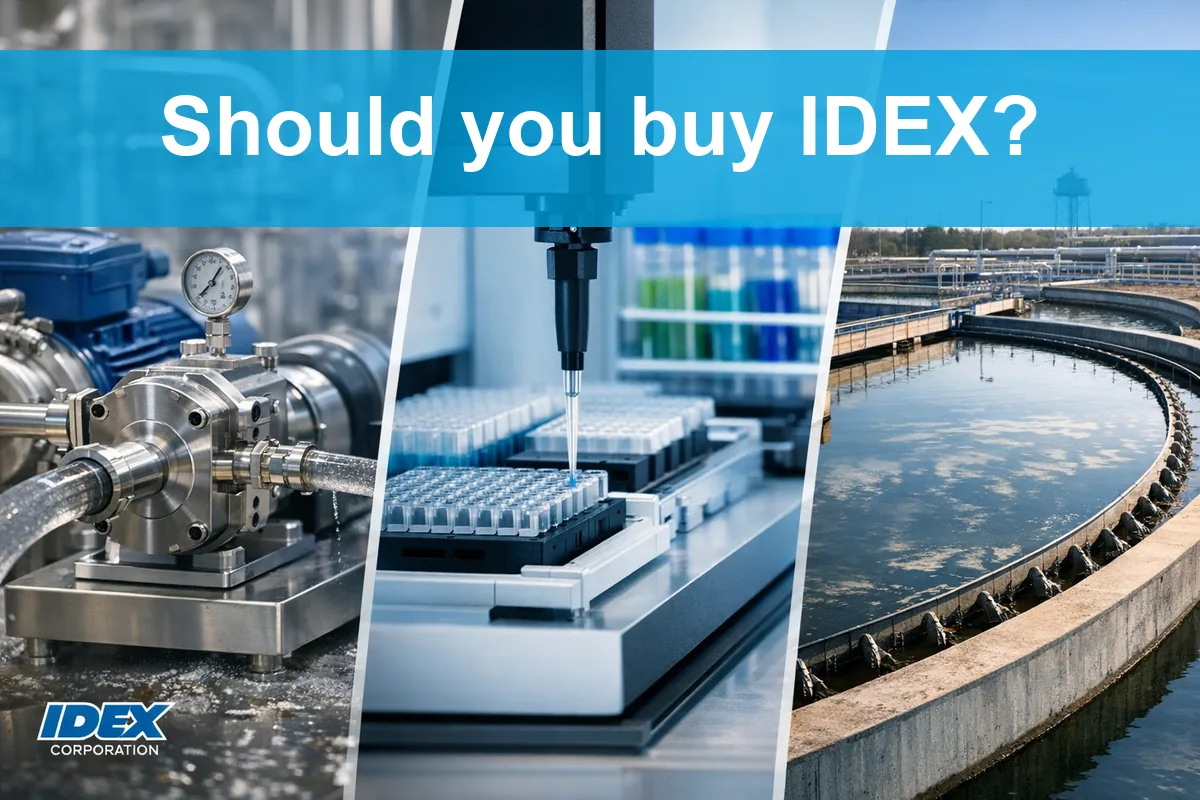
Table of contents
Business Model & Company Overview
IDEX Corporation, founded in 1987 and headquartered in Northbrook, Illinois, stands as a leader in industrial machinery. It operates a cohesive ecosystem through three segments: Fluid & Metering Technologies, Health & Science Technologies, and Fire & Safety/Diversified Products. This diversified portfolio delivers applied solutions worldwide, spanning from precision fluidics to firefighting equipment, creating a broad yet integrated core mission of engineered excellence.
The company’s revenue engine balances durable hardware with specialized services across global markets in the Americas, Europe, and Asia. Recurring sales in precision pumps, valves, and fluid-handling systems fuel consistent cash flow. IDEX’s deep technical expertise and broad product reach forge a powerful economic moat, securing its role as a key innovator shaping the industrial machinery landscape.
Financial Performance & Fundamental Metrics
I will analyze IDEX Corporation’s income statement, key financial ratios, and dividend payout policy to assess its core financial health and shareholder value.
Income Statement
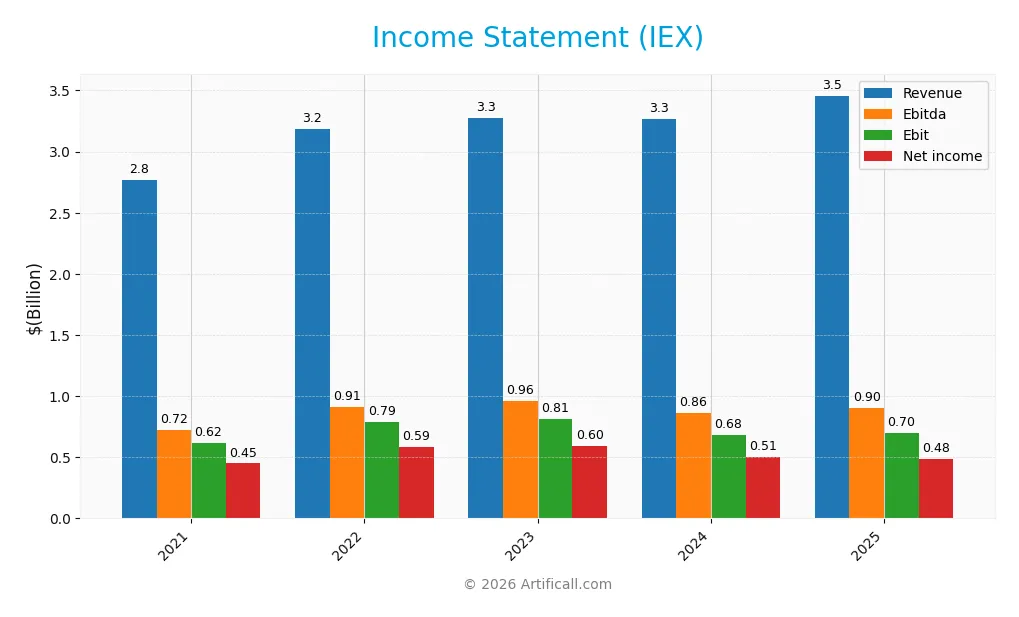
The table below summarizes IDEX Corporation’s key income statement figures over the past five fiscal years, reflecting revenue growth and margin trends.
| 2021 | 2022 | 2023 | 2024 | 2025 | |
|---|---|---|---|---|---|
| Revenue | 2.76B | 3.18B | 3.27B | 3.27B | 3.46B |
| Cost of Revenue | 1.40B | 1.59B | 1.65B | 1.75B | 1.92B |
| Operating Expenses | 708M | 805M | 872M | 820M | 819M |
| Gross Profit | 1.36B | 1.59B | 1.62B | 1.52B | 1.54B |
| EBITDA | 721M | 910M | 964M | 859M | 904M |
| EBIT | 618M | 790M | 812M | 684M | 697M |
| Interest Expense | 38M | 41M | 52M | 45M | 64M |
| Net Income | 449M | 587M | 596M | 505M | 483M |
| EPS | 5.91 | 7.75 | 7.88 | 6.67 | 6.41 |
| Filing Date | 2022-02-24 | 2023-02-23 | 2024-02-22 | 2025-02-20 | 2026-02-19 |
Income Statement Evolution
IDEX Corporation’s revenue rose 25% from 2021 to 2025, with a 5.8% increase in the last year signaling moderate growth. Gross profit remained stable, supported by a consistent gross margin near 44.5%. EBIT growth was modest, around 2% last year, while net margin declined 14% over the period, reflecting some margin pressure despite overall profitability.
Is the Income Statement Favorable?
In 2025, IDEX delivered $3.46B revenue and $483M net income, with net margin at 14%, slightly down from prior years. Operating expenses grew in line with revenue, preserving operational efficiency. Interest expense remains low at 1.9% of sales. Despite a recent dip in net income and EPS, the fundamentals appear generally favorable, showing disciplined cost control and solid profitability.
Financial Ratios
The table below summarizes key financial ratios for IDEX Corporation over the last five fiscal years, providing a snapshot of profitability, valuation, liquidity, leverage, and efficiency metrics:
| Ratios | 2021 | 2022 | 2023 | 2024 | 2025 |
|---|---|---|---|---|---|
| Net Margin | 16% | 18% | 18% | 15% | 14% |
| ROE | 16% | 19% | 17% | 13% | 12% |
| ROIC | 11% | 12% | 11% | 9% | 9% |
| P/E | 40 | 29 | 28 | 31 | 28 |
| P/B | 6.4 | 5.7 | 4.6 | 4.2 | 3.3 |
| Current Ratio | 3.50 | 2.57 | 2.89 | 2.53 | 2.86 |
| Quick Ratio | 2.72 | 1.71 | 2.05 | 1.85 | 2.02 |
| D/E | 0.46 | 0.52 | 0.41 | 0.52 | 0.45 |
| Debt-to-Assets | 26% | 29% | 25% | 29% | 26% |
| Interest Coverage | 17.3 | 19.4 | 14.5 | 15.7 | 11.2 |
| Asset Turnover | 0.56 | 0.58 | 0.56 | 0.48 | 0.50 |
| Fixed Asset Turnover | 8.45 | 8.33 | 5.97 | 7.10 | 7.39 |
| Dividend Yield | 0.9% | 1.0% | 1.2% | 1.3% | 1.6% |
Evolution of Financial Ratios
IDEX Corporation’s Return on Equity (ROE) declined from 19.3% in 2022 to 12.0% in 2025, indicating a slowdown in profitability. The Current Ratio showed modest improvement, rising from 2.57 in 2022 to 2.86 in 2025, signaling stable liquidity. The Debt-to-Equity Ratio remained relatively consistent, fluctuating around 0.45 to 0.52, reflecting steady leverage management.
Are the Financial Ratios Fovorable?
In 2025, profitability is moderate with a net margin of 14% and ROE at 12%, both neutral to favorable versus sector norms. Liquidity ratios are strong, with a current ratio of 2.86 and quick ratio of 2.02, which support short-term obligations comfortably. Leverage is conservative, with debt-to-equity at 0.45 and interest coverage above 10x, indicating manageable debt risk. However, valuation metrics like the P/E of 27.7 and P/B of 3.33 are unfavorable, while asset turnover at 0.5 is below ideal efficiency levels. Overall, the ratios skew favorable, with some caution warranted on market valuation and efficiency.
Shareholder Return Policy
IDEX Corporation maintains a consistent dividend payout, with a 2025 payout ratio near 44% and a dividend yield around 1.59%. Dividends are supported by strong free cash flow coverage and steady dividend per share growth over recent years. Share buybacks are also part of the capital return strategy, complementing dividends.
This distribution approach aligns with sustainable value creation, balancing shareholder returns and reinvestment needs. The payout ratio below 50% suggests prudent capital allocation, avoiding risks from excessive dividends or buybacks, supporting long-term financial health.
Score analysis
The radar chart below illustrates IDEX Corporation’s key financial scores across valuation, profitability, and leverage metrics:
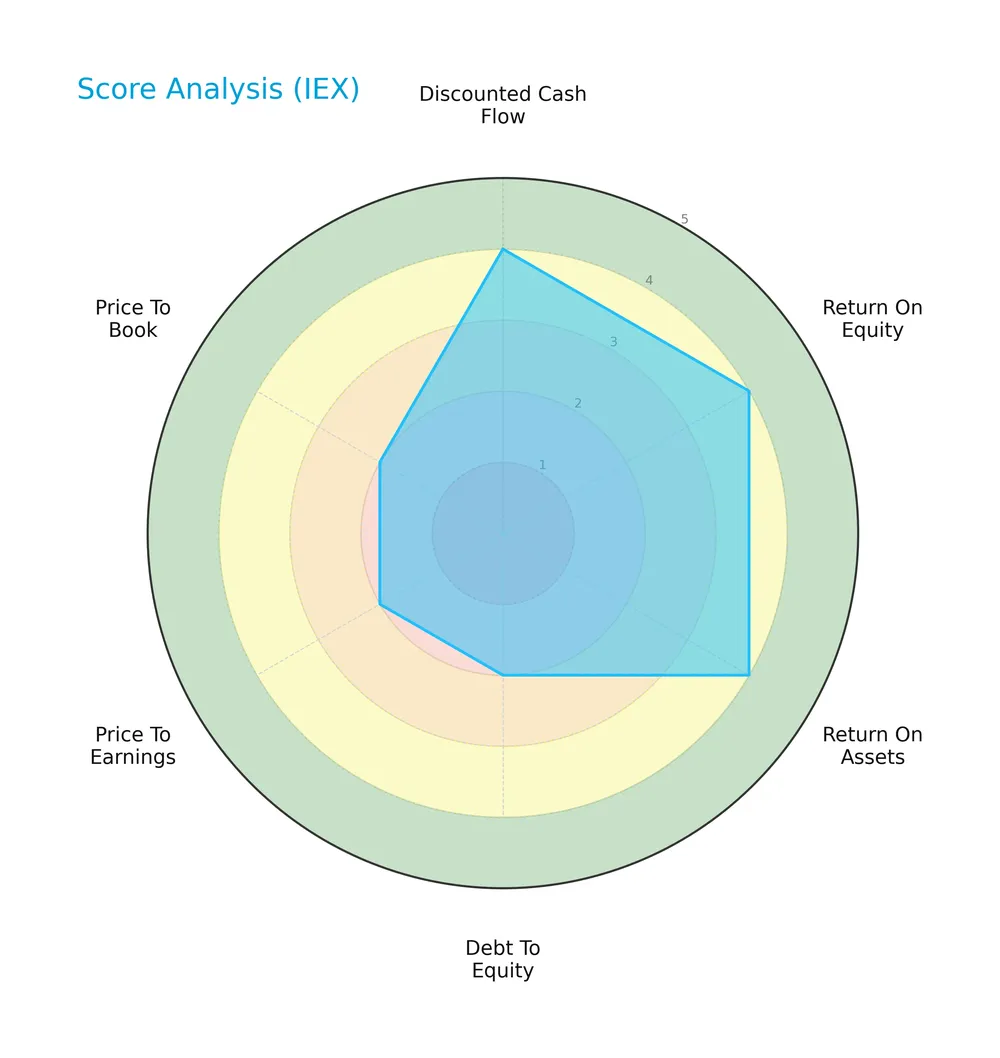
IDEX scores favorably on discounted cash flow (4), return on equity (4), and return on assets (4). Debt-to-equity (2), price-to-earnings (2), and price-to-book (2) scores lag, reflecting valuation and leverage concerns.
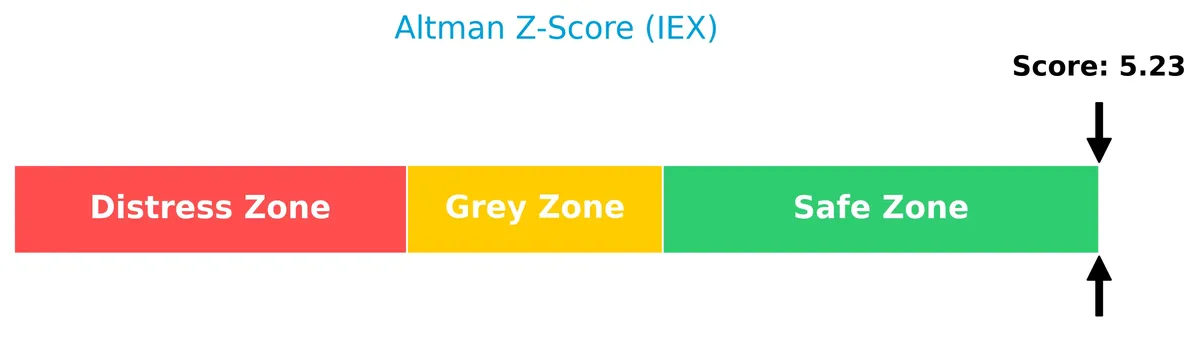
Analysis of the company’s bankruptcy risk
IDEX’s Altman Z-Score places it firmly in the safe zone, indicating a low risk of bankruptcy and solid financial stability:
Is the company in good financial health?
The following Piotroski diagram evaluates IDEX’s financial strength based on profitability, leverage, and operational efficiency:
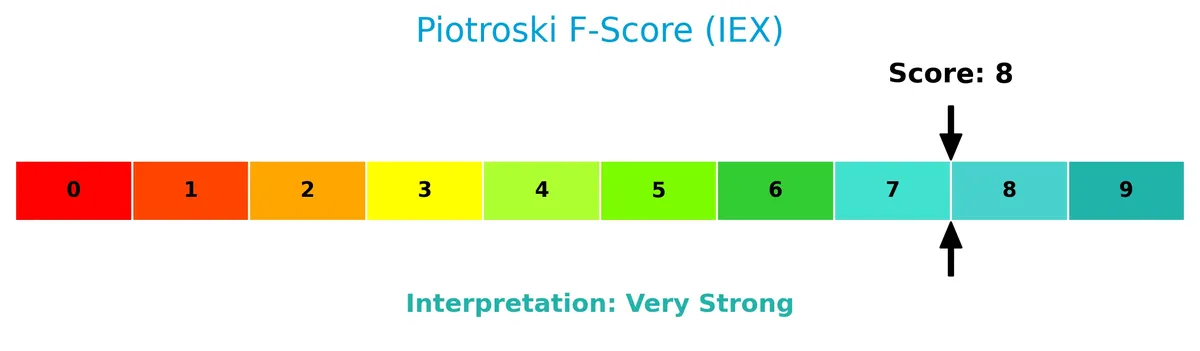
With a Piotroski score of 8, IDEX shows very strong financial health, suggesting robust fundamentals and effective management execution.
Competitive Landscape & Sector Positioning
This analysis explores IDEX Corporation’s strategic positioning within the industrial machinery sector. It examines revenue by segment, key products, main competitors, and competitive advantages. I aim to determine whether IDEX holds a sustainable competitive edge over its peers.
Strategic Positioning
IDEX Corporation maintains a diversified product portfolio across three segments, with Health & Science Technologies leading at $1.5B in 2025. Geographically, it concentrates heavily in the U.S. ($1.76B), while steadily expanding in Europe ($846M) and Asia ($563M), balancing exposure across industrial markets.
Revenue by Segment
This pie chart illustrates IDEX Corporation’s revenue distribution across three segments for fiscal year 2025, highlighting their relative contribution to total sales.
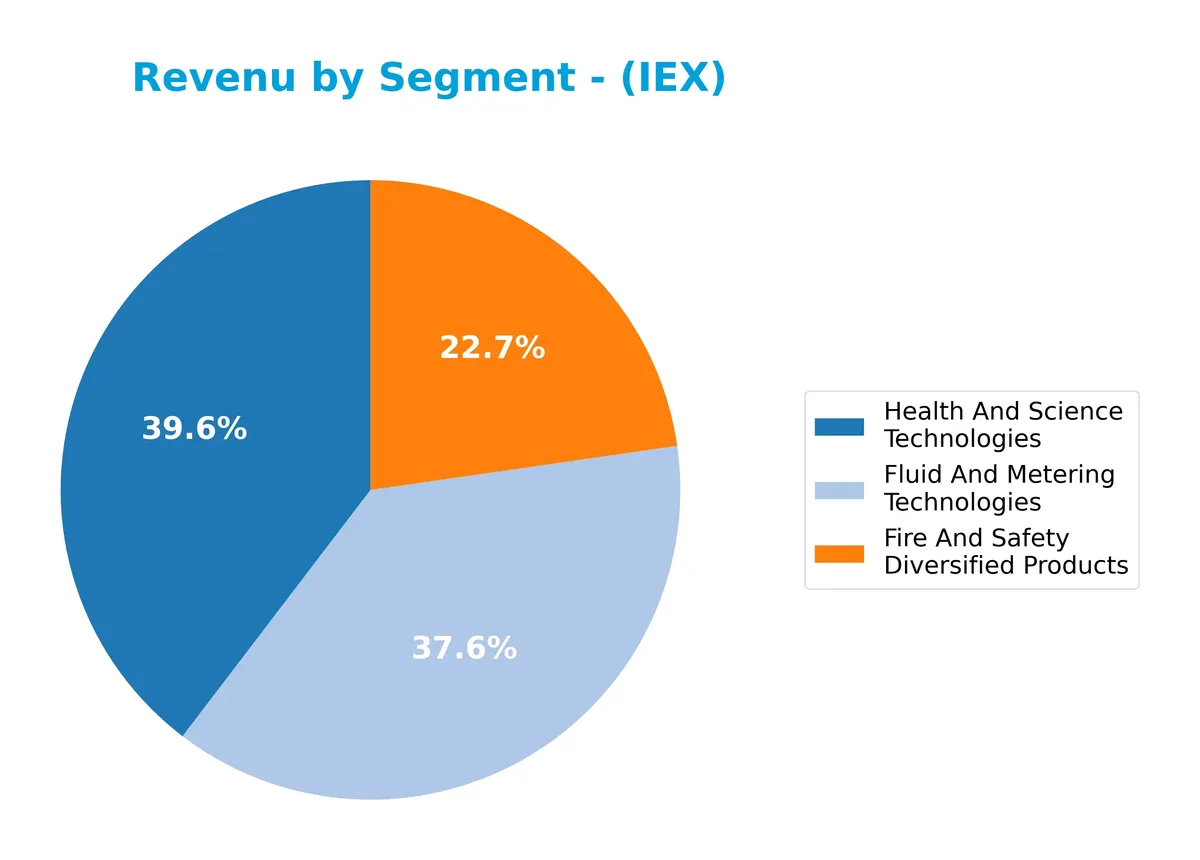
In 2025, Health And Science Technologies leads with $1.5B, reflecting steady growth and a clear business driver. Fluid And Metering Technologies follows closely at $1.2B, showing resilience despite minor fluctuations. Fire And Safety Diversified Products, while smaller at $745M, has grown consistently. The 2025 data shows a concentration in the top two segments, signaling a potential focus but also some dependence risk.
Key Products & Brands
IDEX Corporation operates through three main segments, each offering a diverse range of products and solutions:
| Product | Description |
|---|---|
| Fluid & Metering Technologies (FMT) | Designs and distributes positive displacement pumps, flow meters, injectors, and fluid-handling systems for industrial sectors. |
| Health & Science Technologies (HST) | Produces precision fluidics, pumps, sealing solutions, medical devices, laboratory equipment, and photonic technologies. |
| Fire & Safety/Diversified Products (FSDP) | Manufactures firefighting pumps, valves, rescue tools, industrial banding devices, and precision dispensing equipment. |
IDEX’s product portfolio spans critical industrial and safety applications, with steady revenue growth in Health & Science Technologies, reflecting its innovation focus.
Main Competitors
IDEX Corporation competes with 24 peers, with the table below listing the top 10 leaders by market capitalization:
| Competitor | Market Cap. |
|---|---|
| Eaton Corporation plc | 127B |
| Parker-Hannifin Corporation | 114B |
| Howmet Aerospace Inc. | 85B |
| Emerson Electric Co. | 76B |
| Illinois Tool Works Inc. | 73B |
| Cummins Inc. | 72B |
| AMETEK, Inc. | 48B |
| Roper Technologies, Inc. | 47B |
| Rockwell Automation, Inc. | 45B |
| Symbotic Inc. | 36B |
IDEX Corporation ranks 16th among 24 competitors, with a market cap at 12.3% of the leader Eaton Corporation. It remains below both the average market cap of the top 10 competitors (72.4B) and the sector median (32.4B). The company sits 10.5% below its nearest competitor above, indicating a moderate gap in scale.
Comparisons with competitors
Check out how we compare the company to its competitors:
Does IDEX Corporation have a competitive advantage?
IDEX Corporation currently lacks a strong competitive advantage, as its return on invested capital (ROIC) falls below its weighted average cost of capital (WACC). The company is shedding value, and its ROIC has declined significantly over the 2021-2025 period, signaling weakening profitability.
Looking ahead, IDEX’s diversified segments across fluid technologies, health sciences, and fire safety position it to explore new markets and product innovations. Continued expansion in Europe and the U.S., alongside opportunities in precision engineering and safety equipment, could influence future competitive dynamics.
SWOT Analysis
This SWOT analysis highlights IDEX Corporation’s internal strengths and weaknesses alongside external opportunities and threats to inform strategic decisions.
Strengths
- diverse industrial segments
- strong gross margin at 44.5%
- favorable liquidity ratios (current 2.86, quick 2.02)
Weaknesses
- declining ROIC, currently below WACC
- high valuation multiples (PE 27.7, PB 3.33)
- recent net margin contraction
Opportunities
- expanding health & science markets
- growth in European and Asian sales
- leveraging innovation in fluid and safety tech
Threats
- global economic slowdowns
- rising raw material costs
- increased competition in industrial machinery
IDEX shows robust operational fundamentals but faces pressure on profitability and valuation. The company must focus on improving capital returns and navigating competitive threats while capitalizing on growth in specialized markets.
Stock Price Action Analysis
The following weekly chart illustrates IDEX Corporation’s stock price movements over the past 12 months, highlighting key fluctuations and trend shifts:
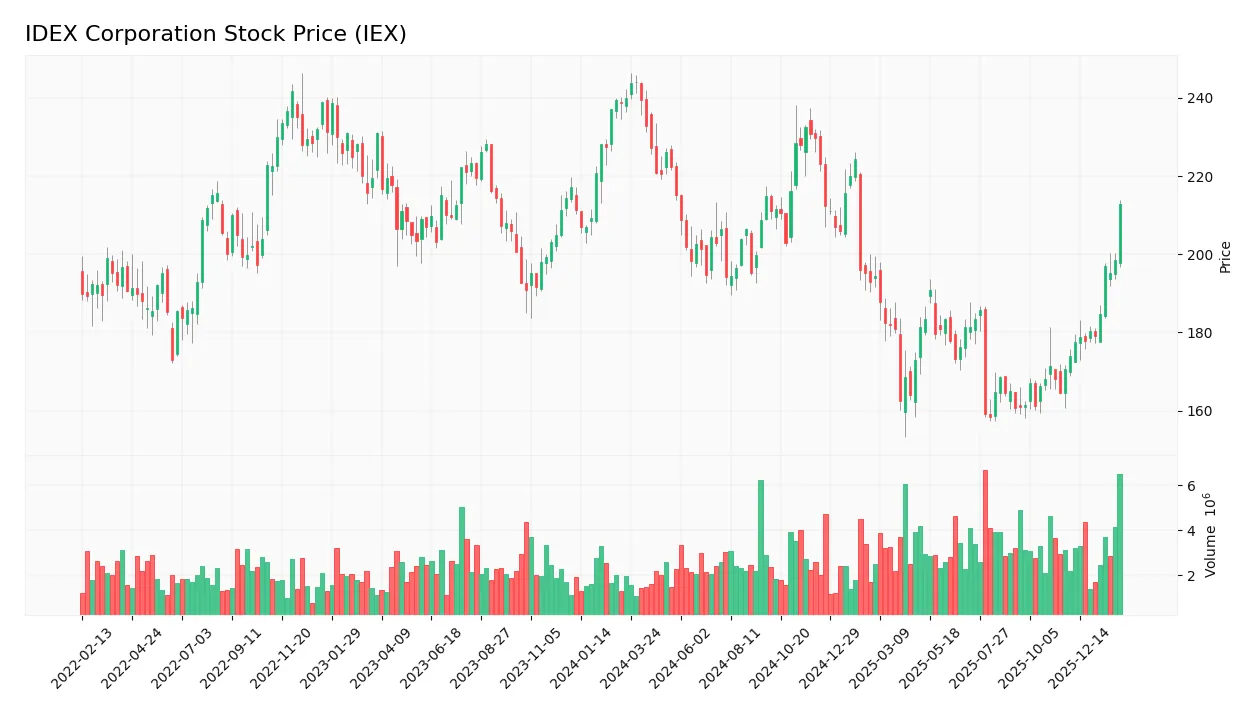
Trend Analysis
Over the past 12 months, IEX’s stock price declined by 14.97%, indicating a clear bearish trend with accelerating downward momentum. Volatility is high, reflected by a 21.75 standard deviation. The price ranged from a high of 244.02 to a low of 158.26, underscoring significant price swings.
Volume Analysis
Over the last three months, trading volume increased, driven by a buyer-dominant trend at 59.8%. This rising activity signals heightened investor interest and participation, favoring accumulation despite the broader bearish backdrop.
Target Prices
Analysts set a strong target consensus for IDEX Corporation, reflecting confidence in its growth prospects.
| Target Low | Target High | Consensus |
|---|---|---|
| 220 | 247 | 236.83 |
The target range suggests moderate upside potential from current levels, indicating broad optimism among institutional analysts.

Don’t Let Luck Decide Your Entry Point
Optimize your entry points with our advanced ProRealTime indicators. You’ll get efficient buy signals with precise price targets for maximum performance. Start outperforming now!
Analyst & Consumer Opinions
This section examines the latest analyst ratings and consumer feedback relating to IDEX Corporation’s market performance and product reception.
Stock Grades
Here is the latest set of verified analyst grades for IDEX Corporation from leading financial firms:
| Grading Company | Action | New Grade | Date |
|---|---|---|---|
| Argus Research | Upgrade | Buy | 2026-02-06 |
| TD Cowen | Maintain | Buy | 2026-02-05 |
| DA Davidson | Maintain | Neutral | 2026-02-05 |
| Citigroup | Maintain | Buy | 2026-02-05 |
| RBC Capital | Maintain | Outperform | 2026-02-05 |
| Stifel | Maintain | Buy | 2026-01-23 |
| Citigroup | Maintain | Buy | 2025-12-08 |
| RBC Capital | Maintain | Outperform | 2025-10-30 |
| Stifel | Maintain | Buy | 2025-10-20 |
| Oppenheimer | Maintain | Outperform | 2025-10-07 |
The consensus shows a predominance of Buy and Outperform ratings, with a single Neutral from DA Davidson. This suggests steady analyst confidence, reinforced by Argus Research’s recent upgrade.
Consumer Opinions
IDEX Corporation earns mixed but largely positive feedback from its customers, reflecting its strong industrial reputation.
| Positive Reviews | Negative Reviews |
|---|---|
| Reliable and durable products that last | Customer service response times are slow |
| Innovative solutions that improve efficiency | Pricing can be higher than competitors |
| Strong focus on quality and precision | Limited availability of some product lines |
Overall, consumers appreciate IDEX’s product reliability and innovation. However, some express frustration over service delays and premium pricing, suggesting room for improvement in customer experience and accessibility.
Risk Analysis
Below is a detailed assessment of key risks facing IDEX Corporation, including their likelihood and potential impact:
| Category | Description | Probability | Impact |
|---|---|---|---|
| Valuation Risk | Elevated P/E (27.7) and P/B (3.33) ratios suggest the stock trades at a premium. | Medium | High |
| Market Cyclicality | Industrial machinery demand fluctuates with economic cycles, affecting revenue stability. | High | Medium |
| Operational Efficiency | Asset turnover ratio is low (0.5), indicating potential inefficiency in asset utilization. | Medium | Medium |
| Debt Exposure | Moderate debt-to-equity (0.45) but debt-related scores are unfavorable, posing refinancing risk. | Low | Medium |
| Competitive Pressure | Innovation demands in fluid and safety technologies may pressure margins over time. | Medium | Medium |
I highlight valuation risk as most pressing, given the premium multiples relative to industrial benchmarks. Market cyclicality remains a top concern, as downturns reduce industrial capital spending. Operational efficiency needs monitoring, though the strong Altman Z-score (5.16) and Piotroski score (8) confirm solid financial health. Prudence dictates watching debt metrics despite current manageable leverage.
Should You Buy IDEX Corporation?
IDEX appears to be a moderately profitable company with slightly unfavorable moat dynamics, as ROIC trends down and suggests value erosion. Despite a manageable leverage profile and strong financial scores, its overall B+ rating could be seen as very favorable but warrants cautious interpretation.
Strength & Efficiency Pillars
IDEX Corporation operates with solid profitability, delivering a net margin of 13.98% and a return on equity of 12.0%. Its return on invested capital (ROIC) stands at 8.65%, slightly above its weighted average cost of capital (WACC) at 7.72%, indicating near value creation, though recent trends suggest a slight decline in ROIC. The company maintains favorable operational margins, including a gross margin of 44.51% and an EBIT margin of 20.16%, reflecting efficient cost management and operational strength.
Weaknesses and Drawbacks
Despite healthy profitability, IDEX faces valuation and leverage concerns that warrant caution. The price-to-earnings ratio at 27.73 and price-to-book ratio at 3.33 suggest the stock trades at a premium, possibly limiting upside. While debt-to-equity is moderate at 0.45, this is considered favorable, but asset turnover is weak at 0.5, indicating less efficient asset use. Market sentiment remains bearish with a 14.97% overall price decline, although recent buyer dominance near 60% signals some recovery potential.
Our Final Verdict about IDEX Corporation
IDEX Corporation’s financial health is solid, supported by a safe Altman Z-Score of 5.16 and a very strong Piotroski score of 8, indicating low bankruptcy risk and robust fundamentals. Despite bearish longer-term price trends, recent buyer dominance suggests cautious optimism. The profile might appear attractive for investors seeking operational stability, though premium valuation and weak asset turnover recommend a measured, patient approach.
Disclaimer: This content is for informational purposes only and does not constitute financial, investment, or other professional advice. Investing in financial markets involves a significant risk of loss, and past performance is not indicative of future results.
Additional Resources
- Attractive Sector Valuations Drive Interest Towards IDEX Corporation (IEX) – Yahoo Finance (Feb 06, 2026)
- Decoding IDEX Corp (IEX): A Strategic SWOT Insight – GuruFocus (Feb 20, 2026)
- IDEX Corporation (IEX) Q4 2025 Earnings Call Transcript – AlphaStreet News (Feb 06, 2026)
- IDEX Corporation: Q4 Earnings Are Coming Up Quick, Look For Signs Of Growth – Seeking Alpha (Jan 27, 2026)
- Johnson Investment Counsel Inc. Has $49.30 Million Stock Holdings in IDEX Corporation $IEX – MarketBeat (Feb 10, 2026)
For more information about IDEX Corporation, please visit the official website: idexcorp.com