Home > Analyses > Industrials > Hyster-Yale Materials Handling, Inc.
Hyster-Yale Materials Handling, Inc. moves the backbone of global logistics by powering warehouses and manufacturing floors with its rugged lift trucks. The company commands respect through its iconic Hyster and Yale brands, known for durable machinery and innovative hydrogen fuel-cell technology. With a diverse product lineup serving heavy industries worldwide, it shapes how goods flow daily. The key question: does Hyster-Yale’s financial strength and growth runway justify its current market valuation?

Table of contents
Business Model & Company Overview
Hyster-Yale Materials Handling, Inc., founded in 1991 and headquartered in Cleveland, Ohio, commands a strong position in the agricultural machinery sector. The company’s core mission revolves around designing, engineering, and manufacturing lift trucks, attachments, and aftermarket parts under the Hyster and Yale brands. This ecosystem integrates components like frames and transmissions with full assembly, creating a seamless product line for diverse industrial applications.
The company’s revenue engine blends manufacturing with aftermarket sales and services, supported by its global footprint across the Americas, Europe, and Asia. Hyster-Yale also produces hydrogen fuel-cell stacks, positioning itself at the forefront of innovation. This competitive advantage in technology and brand reach fortifies its economic moat, shaping the future of materials handling worldwide.
Financial Performance & Fundamental Metrics
I will analyze Hyster-Yale Materials Handling, Inc.’s income statement, key financial ratios, and dividend payout policy to assess its fundamental strength and shareholder value.
Income Statement
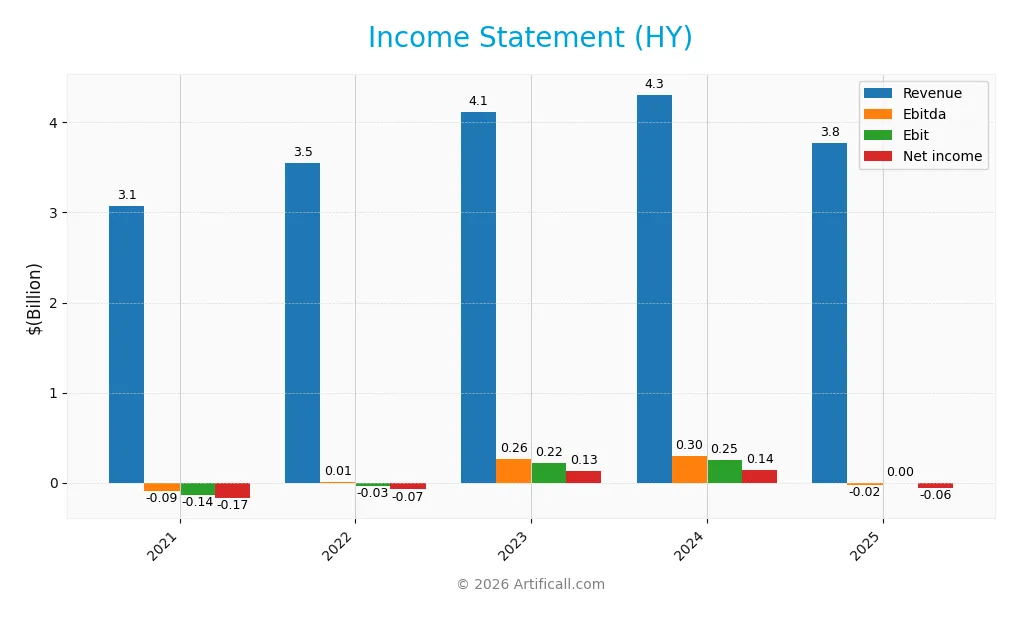
The following table summarizes Hyster-Yale Materials Handling, Inc.’s key income statement figures for the fiscal years 2021 through 2025 in USD.
| 2021 | 2022 | 2023 | 2024 | 2025 | |
|---|---|---|---|---|---|
| Revenue | 3.08B | 3.55B | 4.12B | 4.31B | 3.77B |
| Cost of Revenue | 2.71B | 3.11B | 3.33B | 3.41B | 3.14B |
| Operating Expenses | 516M | 473M | 577M | 651M | 617M |
| Gross Profit | 363M | 434M | 786M | 896M | 633M |
| EBITDA | -93M | 9.4M | 263M | 300M | -22M |
| EBIT | -139M | -34M | 218M | 253M | 0 |
| Interest Expense | 15.5M | 28.4M | 37.3M | 33.8M | 31.2M |
| Net Income | -173M | -74.1M | 126M | 142M | -60.1M |
| EPS | -10.29 | -4.38 | 7.35 | 8.16 | -3.39 |
| Filing Date | 2022-02-28 | 2023-02-27 | 2024-02-27 | 2025-02-25 | 2026-03-03 |
Income Statement Evolution
Between 2021 and 2025, Hyster-Yale’s revenue grew 22.6%, showing moderate expansion. Net income improved 65.3% over the period but turned negative in 2025. Margins weakened sharply last year, with gross margin around 16.8%, EBIT margin dropping to zero, and net margin slipping to -1.6%. This signals deteriorating profitability despite prior gains.
Is the Income Statement Favorable?
The 2025 income statement reveals unfavorable fundamentals. Revenue declined 12.5% year-over-year, dragging gross profit down 29.3%. Operating income was negative, erasing a positive EBIT from 2024. Interest expense remained low at 0.83% of revenue, but net income fell to -$60M, with EPS at -$3.39. Overall, performance appears weak and margin compression is a clear risk.
Financial Ratios
The following table presents key financial ratios for Hyster-Yale Materials Handling, Inc. over the fiscal years 2021 to 2025:
| Ratios | 2021 | 2022 | 2023 | 2024 | 2025 |
|---|---|---|---|---|---|
| Net Margin | -5.62% | -2.09% | 3.06% | 3.30% | -1.59% |
| ROE | -48.45% | -36.25% | 32.29% | 29.95% | -12.73% |
| ROIC | -13.57% | -4.03% | 13.08% | 13.59% | -1.92% |
| P/E | -3.99 | -5.77 | 8.47 | 6.24 | 0 |
| P/B | 1.94 | 2.09 | 2.73 | 1.87 | 0 |
| Current Ratio | 1.22 | 1.09 | 1.22 | 1.35 | 1.34 |
| Quick Ratio | 0.52 | 0.49 | 0.55 | 0.64 | 0.71 |
| D/E | 1.45 | 2.70 | 1.47 | 1.14 | 0.82 |
| Debt-to-Assets | 26.32% | 27.29% | 27.51% | 26.70% | 19.04% |
| Interest Coverage | -9.83 | -1.38 | 5.60 | 7.24 | -0.71 |
| Asset Turnover | 1.56 | 1.75 | 1.98 | 2.12 | 1.87 |
| Fixed Asset Turnover | 9.31 | 11.45 | 13.12 | 14.05 | 11.46 |
| Dividend Yield | 3.12% | 5.10% | 2.09% | 2.70% | 0% |
Evolution of Financial Ratios
Return on Equity (ROE) has declined sharply, turning negative at -12.73% in 2025 after positive returns in prior years. The Current Ratio remained stable around 1.34, indicating consistent liquidity. Debt-to-Equity Ratio improved from over 2.7 in 2022 to 0.82 in 2025, signaling reduced leverage but still moderate debt load. Profitability weakened considerably in 2025 with negative net margins.
Are the Financial Ratios Fovorable?
In 2025, profitability ratios like ROE (-12.73%) and net margin (-1.59%) are unfavorable, highlighting operational challenges. Liquidity is mixed: current ratio is neutral at 1.34, but quick ratio at 0.71 signals weaker short-term asset coverage. Leverage metrics are neutral to favorable, with debt-to-assets at 19.04% favorable. Asset turnover ratios are strong, supporting efficient use of assets. Overall, the ratios lean slightly unfavorable due to profitability and coverage concerns.
Shareholder Return Policy
Hyster-Yale Materials Handling, Inc. paid dividends consistently from 2021 to 2024, with payout ratios around 16-18% and yields between 2.1% and 3.1%. The company’s dividend payments appear covered by free cash flow, supporting disciplined capital allocation despite fluctuating profitability.
In 2025, the firm reported negative net income and ceased dividends, reflecting operational challenges. No dividend yield was recorded, and buyback activity is not indicated. This shift suggests a focus on financial stabilization, which may better align with sustainable long-term shareholder value amid recent margin pressures.
Score analysis
The following radar chart displays key financial scores for a comprehensive view of the company’s valuation and operational efficiency:
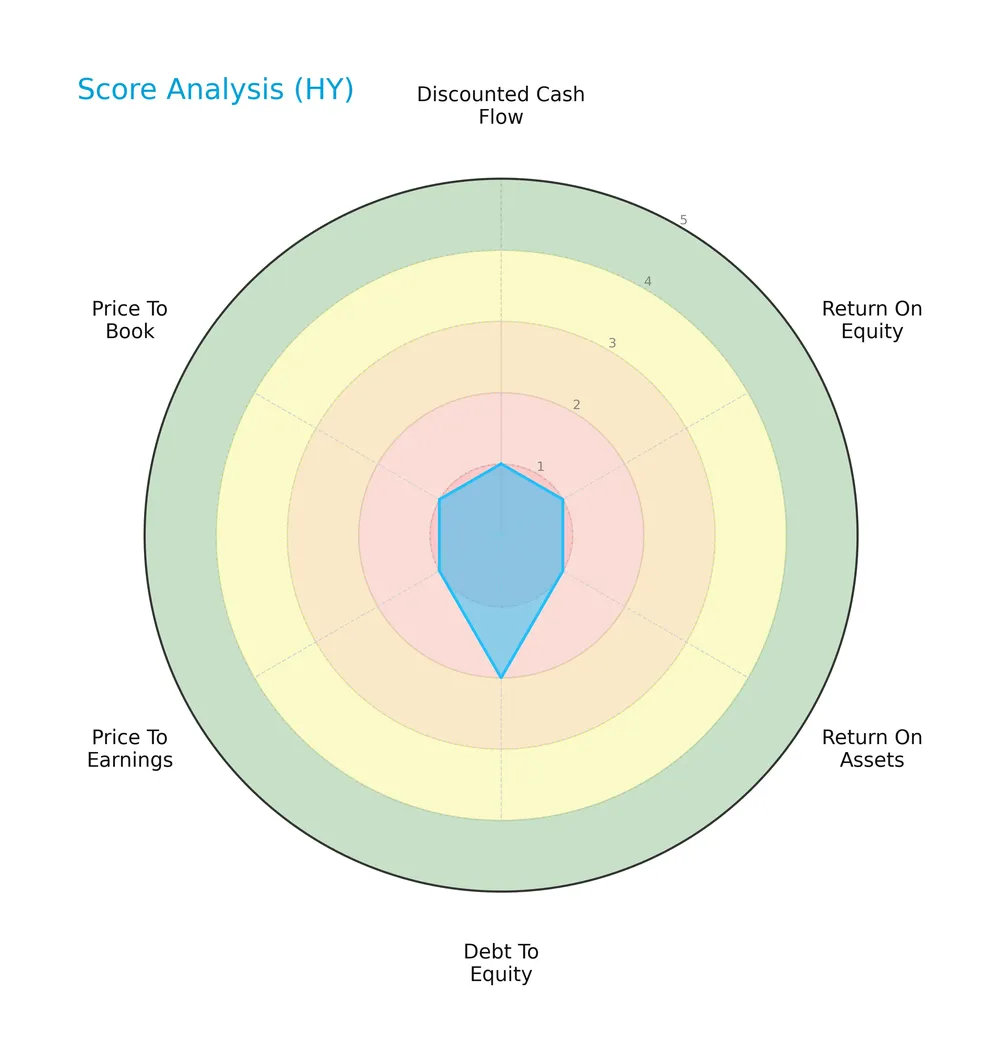
Hyster-Yale Materials Handling, Inc. shows significant weaknesses, with very unfavorable scores in discounted cash flow, ROE, ROA, PE, and PB ratios. Its debt-to-equity score is slightly better but still unfavorable, signaling financial strain.
Analysis of the company’s bankruptcy risk
The Altman Z-Score places Hyster-Yale in the grey zone, indicating moderate bankruptcy risk and financial uncertainty:

Is the company in good financial health?
This Piotroski diagram illustrates the company’s financial strength based on nine critical criteria:

With a Piotroski Score of 4, Hyster-Yale’s financial health is average, reflecting mixed signals in profitability, leverage, and liquidity measures. This suggests neither strong resilience nor alarming weakness.
Competitive Landscape & Sector Positioning
This section analyzes Hyster-Yale Materials Handling, Inc.’s strategic role within the industrial machinery sector. We will examine its revenue breakdown, key products, and main competitors. I will assess whether the company holds a sustainable competitive advantage in its market segment.
Strategic Positioning
Hyster-Yale concentrates on lift trucks, attachments, and aftermarket parts, with a strong presence in the Americas (2.8B in 2025) and EMEA (570M). It diversifies product lines across brands like Bolzoni and Nuvera, including hydrogen fuel-cell technology, reflecting a focused yet multi-brand industrial strategy.
Revenue by Segment
This pie chart displays Hyster-Yale Materials Handling, Inc.’s revenue by segment for the fiscal year 2025, highlighting the distribution of income sources within that period.

In 2025, “Other revenue” accounts for $384M, representing the sole reported segment. Historically, the “Lift truck business” dominated with revenues exceeding $3B in earlier years. The absence of detailed segment breakdown in 2025 signals a concentration risk and potential reporting changes. Notably, the steady increase in “Other revenue” from $311M in 2023 to $384M in 2025 indicates a modest growth trend outside the traditional lift truck segment.
Key Products & Brands
The table below outlines Hyster-Yale Materials Handling’s main products and brand descriptions:
| Product | Description |
|---|---|
| Lift Trucks | Designs, engineers, manufactures, and assembles lift trucks under Hyster and Yale brand names. |
| Aftermarket Parts | Sells parts for lift trucks, including Hyster, Yale, UNISOURCE, and PREMIER brands. |
| Attachments & Forks | Produces and distributes attachments, forks, and lift tables under Bolzoni, Auramo, and Meyer. |
| Hydrogen Fuel-Cell Stacks and Engines | Designs and sells hydrogen fuel-cell technology for material handling equipment. |
| JAPIC | Segment revenue contributor, specifics not detailed in the data provided. |
| Bolzoni | Brand generating significant revenue by manufacturing attachments and related products. |
| Nuvera | Focuses on hydrogen fuel-cell systems, a smaller but growing segment. |
Hyster-Yale’s portfolio centers on lift trucks and aftermarket parts under strong brand names. Attachments and hydrogen fuel-cell technologies diversify its industrial product base. Bolzoni and Nuvera represent key specialized segments supporting steady revenue streams.
Main Competitors
There are 5 competitors in the Agricultural – Machinery industry, with the table listing the top 5 leaders by market capitalization:
| Competitor | Market Cap. |
|---|---|
| Caterpillar Inc. | 280B |
| Deere & Company | 126B |
| PACCAR Inc | 59B |
| Hyster-Yale Materials Handling, Inc. | 527M |
| Columbus McKinnon Corporation | 496M |
Hyster-Yale ranks 4th among its 5 competitors. Its market cap is only 0.24% of Caterpillar’s, the sector leader. The company sits well below both the average market cap of the top 10 (93B) and the sector median (59B). The gap to the next competitor above is exceptionally wide at +8504.67%, highlighting significant scale differences.
Comparisons with competitors
Check out how we compare the company to its competitors:
Does Hyster-Yale have a competitive advantage?
Hyster-Yale currently lacks a strong competitive advantage, as its ROIC remains below WACC, indicating value destruction despite improving profitability. The company operates in a capital-intensive industrial sector with modest gross margins and negative net margins.
Looking ahead, Hyster-Yale focuses on expanding hydrogen fuel-cell technologies and diversifying into port equipment and rough terrain forklifts. These initiatives could open new markets and enhance its product portfolio, potentially improving future competitive positioning.
SWOT Analysis
This SWOT analysis highlights the critical internal and external factors shaping Hyster-Yale Materials Handling, Inc.’s strategic position.
Strengths
- Strong brand recognition with Hyster and Yale
- Diverse product portfolio including hydrogen fuel-cell technology
- Solid asset turnover ratios
Weaknesses
- Negative net margin and ROIC indicating value destruction
- Declining revenue and profit growth in the latest year
- Low liquidity with quick ratio below 1
Opportunities
- Growing demand for sustainable industrial equipment
- Expansion potential in emerging markets like EMEA
- Increasing aftermarket parts sales
Threats
- Intense competition in industrial machinery sector
- Economic downturns impacting capital expenditures
- Supply chain disruptions increasing costs
Hyster-Yale faces structural profitability challenges despite a growing ROIC trend and strong brands. The company must leverage innovation and geographic expansion to offset margin pressures and external risks.
Stock Price Action Analysis
The weekly stock chart for Hyster-Yale Materials Handling, Inc. (HY) displays price movements and key support-resistance levels over the past 12 months:

Trend Analysis
Over the past 12 months, HY’s stock price declined by 37.93%, indicating a clear bearish trend with accelerating downward momentum. The price ranged between a high of 78.14 and a low of 28.15, with volatility measured by a 13.78 standard deviation. Recent months show a 25.24% rebound since December 2025, reflecting a short-term bullish correction.
Volume Analysis
Trading volume is increasing, with total activity at 51.2M shares over 12 months. Buyers slightly dominate with 50.65% of volume overall and 51.87% recently. Buyer behavior remains neutral, suggesting balanced participation and cautious investor sentiment amid price volatility.
Target Prices
Analysts currently set a firm target price consensus for Hyster-Yale Materials Handling, Inc. at $40.
| Target Low | Target High | Consensus |
|---|---|---|
| 40 | 40 | 40 |
This unanimity at $40 reflects a clear market expectation for the stock’s potential value in the near term.

Don’t Let Luck Decide Your Entry Point
Optimize your entry points with our advanced ProRealTime indicators. You’ll get efficient buy signals with precise price targets for maximum performance. Start outperforming now!
Analyst & Consumer Opinions
This section reviews recent analyst grades and consumer feedback to assess Hyster-Yale Materials Handling, Inc.’s market perception.
Stock Grades
Here are the latest verified stock grades from reputable analysts for Hyster-Yale Materials Handling, Inc.:
| Grading Company | Action | New Grade | Date |
|---|---|---|---|
| Roth MKM | Maintain | Buy | 2024-11-06 |
| Northland Capital Markets | Upgrade | Outperform | 2024-06-05 |
| Northland Capital Markets | Downgrade | Market Perform | 2024-05-10 |
| EF Hutton | Maintain | Buy | 2023-05-04 |
The consensus leans toward a Buy rating, reflecting moderate confidence in the stock. Some grade volatility from Northland Capital Markets indicates cautious re-evaluation within the sector.
Consumer Opinions
Consumers express mixed feelings about Hyster-Yale Materials Handling, Inc., highlighting its robust equipment alongside service challenges.
| Positive Reviews | Negative Reviews |
|---|---|
| Equipment is durable and reliable under heavy use. | Customer service response times are slow. |
| Strong performance in industrial environments. | Spare parts availability can be inconsistent. |
| Good fuel efficiency reduces operational costs. | Some models have higher maintenance needs. |
Overall, users praise Hyster-Yale for durable and efficient machinery. However, recurring complaints about customer support and parts logistics suggest areas needing improvement.
Risk Analysis
Below is a summary table of key risks facing Hyster-Yale Materials Handling, Inc., assessing their likelihood and potential impact:
| Category | Description | Probability | Impact |
|---|---|---|---|
| Financial Health | Negative net margin and ROE indicate ongoing profitability issues. | High | High |
| Liquidity | Quick ratio at 0.71 signals potential short-term cash flow strain. | Medium | Medium |
| Credit Risk | Interest coverage at 0.0 suggests inability to cover interest expense. | High | High |
| Market Volatility | Beta of 1.545 implies above-average stock price fluctuations. | High | Medium |
| Bankruptcy Risk | Altman Z-Score of 2.7 places company in grey zone, moderate risk. | Medium | High |
The most pressing risks are financial distress indicators: losses and weak interest coverage expose HY to bankruptcy risk, magnified by its grey zone Altman Z-Score. The quick ratio below 1 warns of liquidity challenges. Market volatility adds trading risk, but the fundamental financial weaknesses are paramount. Investors should weigh these factors carefully before committing capital.
Should You Buy Hyster-Yale Materials Handling, Inc.?
Hyster-Yale appears to be in a slightly unfavorable moat position, shedding value despite improving profitability. Its leverage profile remains manageable, yet financial strength metrics suggest caution. The overall D+ rating could be seen as indicative of risk in value creation.
Strength & Efficiency Pillars
Hyster-Yale Materials Handling, Inc. exhibits operational resilience despite challenges. Its gross margin stands at a modest 16.79%, reflecting some pricing power. However, the company reports negative net margin (-1.59%), ROE (-12.73%), and ROIC (-1.92%), indicating profitability struggles. ROIC remains below the WACC of 9.52%, signaling value destruction rather than creation. Still, asset turnover at 1.87 and fixed asset turnover at 11.46 highlight efficient asset utilization. Overall, operational efficiency is mixed but leans toward caution.
Weaknesses and Drawbacks
The Altman Z-Score of 2.70 places the company in the “Grey Zone,” signaling moderate bankruptcy risk. This solvency concern overshadows some operational metrics. Profitability metrics are unfavorable, with negative margins and returns. Valuation metrics show zero P/E and P/B ratios, which might reflect reporting anomalies or distress. Liquidity ratios are weak; the quick ratio at 0.71 flags short-term liquidity pressure. Interest coverage at zero raises alarms about debt servicing ability. These factors collectively heighten financial risk.
Our Final Verdict about Hyster-Yale Materials Handling, Inc.
Hyster-Yale’s fundamentals reveal operational challenges compounded by moderate financial risk. The “Grey Zone” Altman Z-Score advises prudence despite some improving revenue and profit trends over the longer term. Recent buyer dominance at 51.87% and volume growth might suggest early recovery signs. Nonetheless, the profile might appear too risky for conservative capital and calls for a cautious, wait-and-see stance until solvency improves.
Disclaimer: This content is for informational purposes only and does not constitute financial, investment, or other professional advice. Investing in financial markets involves a significant risk of loss, and past performance is not indicative of future results.
Additional Resources
- Hyster-Yale Materials Handling’s (NYSE:HY) Q4 CY2025 Sales Beat Estimates – TradingView (Mar 03, 2026)
- Hyster-Yale (NYSE: HY) outlines 2025 operations and tariff impacts – Stock Titan (Mar 03, 2026)
- Why Hyster-Yale Materials Handling (HY) Stock Is Up Today – Finviz (Mar 02, 2026)
- HYSTER-YALE ANNOUNCES COST REDUCTION ACTIONS AMID CHALLENGING MARKET CONDITIONS – PR Newswire (Nov 19, 2025)
- HYSTER-YALE ANNOUNCES DATES OF FOURTH QUARTER AND FULL YEAR 2025 EARNINGS RELEASE AND WEBCAST – Sahm (Feb 24, 2026)
For more information about Hyster-Yale Materials Handling, Inc., please visit the official website: hyster-yale.com