Home > Analyses > Industrials > Huntington Ingalls Industries, Inc.
Huntington Ingalls Industries shapes the future of naval defense by building and maintaining the U.S. Navy’s most advanced ships. Its expertise spans nuclear-powered aircraft carriers to amphibious assault vessels, making it indispensable to national security. Renowned for innovation and precision engineering, HII commands a unique industry position. As defense budgets evolve, I question whether HII’s robust fundamentals still support its premium valuation and long-term growth prospects.

Table of contents
Business Model & Company Overview
Huntington Ingalls Industries, Inc., founded in 1886 and headquartered in Newport News, Virginia, stands as a dominant force in the Aerospace & Defense sector. With 44K employees, it operates a cohesive ecosystem focused on designing, building, and overhauling military ships, including nuclear-powered vessels and advanced surface combatants. Its three core segments—Ingalls Shipbuilding, Newport News Shipbuilding, and Technical Solutions—work in unison to support U.S. naval superiority and national security.
The company’s revenue engine balances large-scale shipbuilding contracts with recurring sustainment, maintenance, and high-end IT services for U.S. defense and federal agencies. Its strategic footprint spans key global markets, leveraging expertise in nuclear management and unmanned systems. Huntington Ingalls Industries’ enduring economic moat lies in its unparalleled technical capabilities and critical role in shaping U.S. naval defense infrastructure.
Financial Performance & Fundamental Metrics
I will analyze Huntington Ingalls Industries, Inc.’s income statement, key financial ratios, and dividend payout policy to assess its fundamental strength and investment appeal.
Income Statement
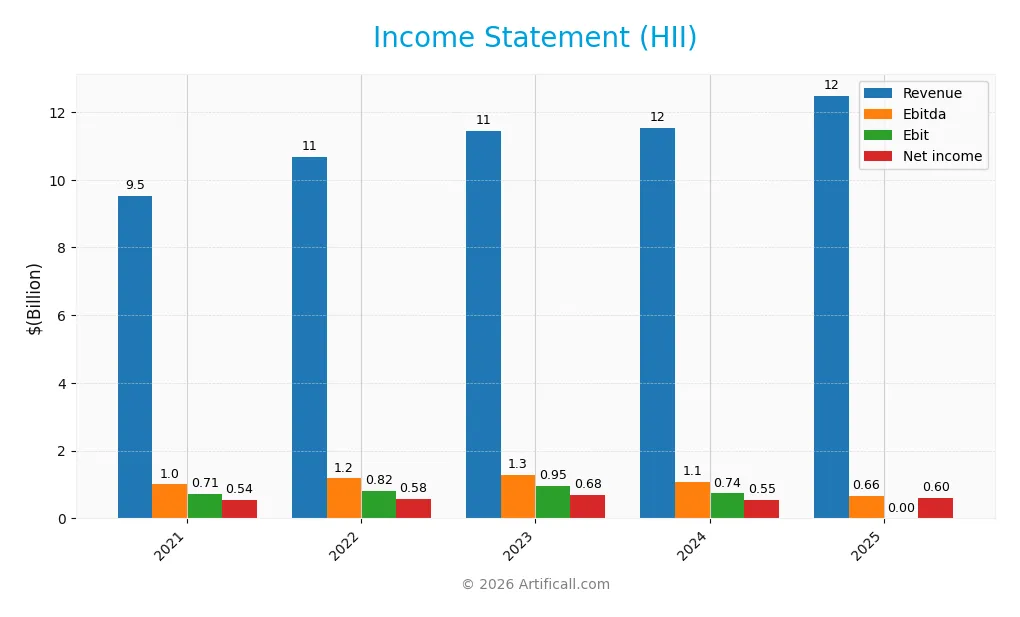
The table below summarizes Huntington Ingalls Industries, Inc.’s income statement over the past five fiscal years, highlighting key profitability metrics and EPS values.
| 2021 | 2022 | 2023 | 2024 | 2025 | |
|---|---|---|---|---|---|
| Revenue | 9.52B | 10.68B | 11.45B | 11.54B | 12.48B |
| Cost of Revenue | 8.16B | 9.24B | 9.81B | 10.09B | 3.82B |
| Operating Expenses | 882M | 924M | 1.02B | 915M | 977M |
| Gross Profit | 1.37B | 1.44B | 1.65B | 1.45B | 8.67B |
| EBITDA | 1.00B | 1.18B | 1.30B | 1.06B | 657M |
| EBIT | 711M | 821M | 948M | 738M | 0 |
| Interest Expense | 89M | 102M | 95M | 95M | 105M |
| Net Income | 544M | 579M | 681M | 550M | 605M |
| EPS | 13.50 | 14.44 | 17.07 | 13.96 | 15.39 |
| Filing Date | 2022-02-10 | 2023-02-09 | 2024-02-01 | 2025-02-06 | 2026-02-05 |
Income Statement Evolution
From 2021 to 2025, Huntington Ingalls Industries’ revenue rose 31% to $12.5B, reflecting solid top-line growth. Net income increased 11% to $605M, but net margin declined by 15%, signaling margin pressure despite higher earnings. Gross margin improved substantially, while EBIT margin dropped to zero in 2025, indicating volatility in operating profitability.
Is the Income Statement Favorable?
In 2025, strong revenue growth of 8.2% and a 497% surge in gross profit underline operational efficiency gains. However, EBIT margin collapsed to zero, contrasting with a positive net margin near 5%, indicating significant non-operating impacts. Interest expense remains low at 0.84% of revenue. Overall, fundamentals appear favorable but with clear operating income challenges.
Financial Ratios
The following table summarizes key financial ratios for Huntington Ingalls Industries, Inc. over recent fiscal years:
| Ratios | 2021 | 2022 | 2023 | 2024 | 2025 |
|---|---|---|---|---|---|
| Net Margin | 5.7% | 5.4% | 5.9% | 4.8% | 4.8% |
| ROE | 19.4% | 16.6% | 16.6% | 11.8% | N/A |
| ROIC | 5.2% | 5.0% | 5.9% | 4.7% | N/A |
| P/E | 13.8 | 16.0 | 15.2 | 13.5 | 22.1 |
| P/B | 2.7 | 2.7 | 2.5 | 1.6 | 0.0 |
| Current Ratio | 1.15 | 0.95 | 0.95 | 1.08 | 0.0 |
| Quick Ratio | 1.08 | 0.89 | 0.89 | 1.01 | 0.0 |
| D/E | 1.24 | 0.90 | 0.65 | 0.73 | 0.0 |
| Debt-to-Assets | 33% | 29% | 24% | 28% | 0% |
| Interest Coverage | 5.5x | 5.1x | 6.6x | 5.6x | -6.3x |
| Asset Turnover | 0.90 | 0.98 | 1.02 | 0.95 | 0.0 |
| Fixed Asset Turnover | 2.84 | 3.07 | 3.22 | 3.13 | 0.0 |
| Dividend Yield | 2.5% | 2.1% | 1.9% | 2.8% | 1.6% |
Notes:
- ROE and ROIC are unavailable for 2025.
- Current and quick ratios at zero in 2025 signal missing data or reporting gaps.
- Negative interest coverage in 2025 is a red flag, indicating earnings insufficient to cover interest expenses.
- P/B ratio dropping to zero in 2025 also suggests missing or incomplete data.
Evolution of Financial Ratios
Return on Equity (ROE) for Huntington Ingalls Industries dropped to zero by 2025, reflecting a sharp decline from previous years. The Current Ratio also fell to zero, indicating worsening liquidity. Debt-to-Equity Ratio improved to zero in 2025, suggesting reduced leverage, though profitability weakened overall with net margins declining slightly.
Are the Financial Ratios Favorable?
In 2025, profitability ratios such as net margin and ROE were unfavorable, signaling weak earnings performance. Liquidity ratios, including current and quick ratios, also registered unfavorable scores, raising red flags on short-term financial health. Conversely, debt-related metrics like debt-to-equity and debt-to-assets appeared favorable. Market valuation ratios were mostly neutral, but the overall ratio assessment remains unfavorable.
Shareholder Return Policy
Huntington Ingalls Industries maintains a consistent dividend payout ratio near 35%, with dividends per share rising from $4.62 in 2021 to $5.42 in 2025. The annual yield hovers around 1.5%-2.7%, supported by coverage ratios above 1.4, indicating dividends are well covered by free cash flow.
The company also engages in share buybacks, complementing dividends in returning capital. This balanced approach aligns with sustainable shareholder value creation, avoiding excessive payouts or repurchases that could strain financial flexibility.
Score analysis
Here is a radar chart illustrating Huntington Ingalls Industries, Inc.’s key financial scores for a comprehensive view:
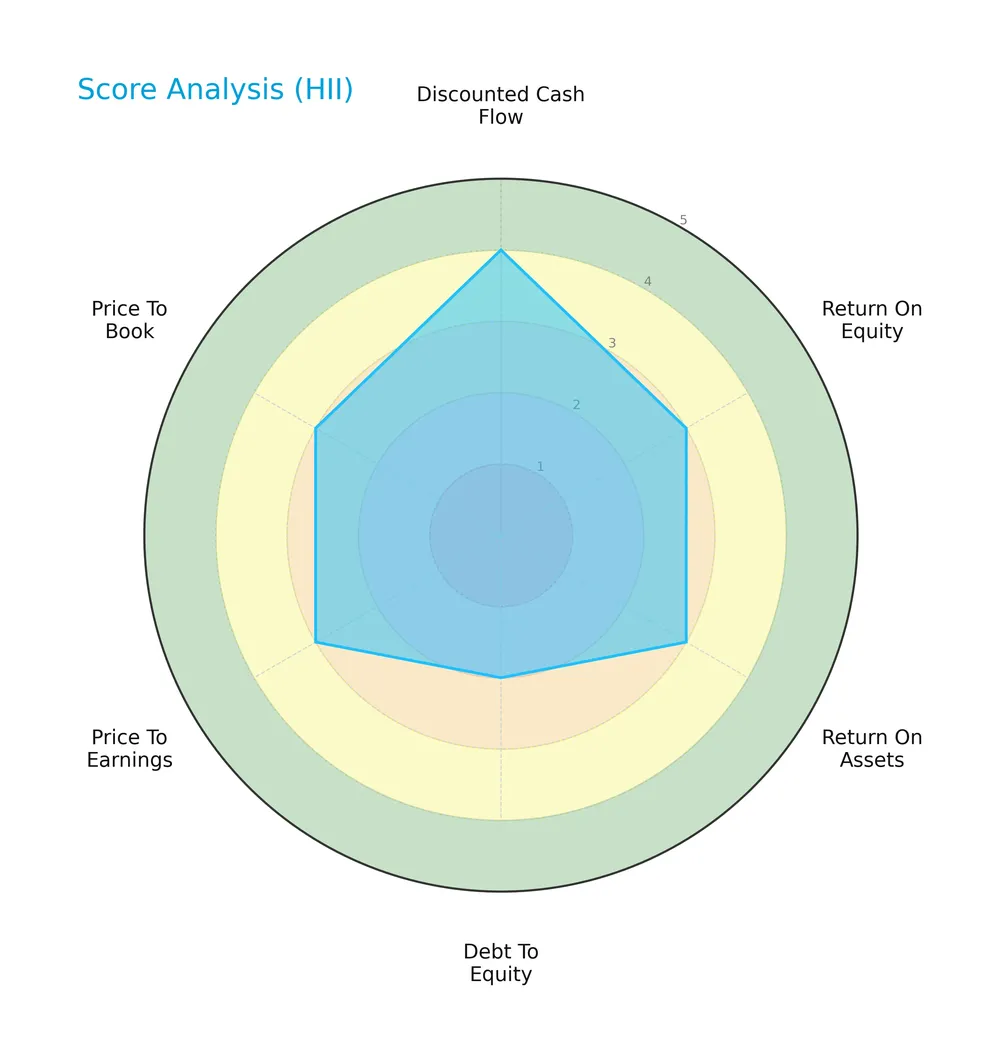
The company scores favorably on discounted cash flow with a 4, while return on equity, return on assets, price to earnings, and price to book each hold moderate scores of 3. Debt to equity is slightly lower at 2, indicating moderate leverage concerns.
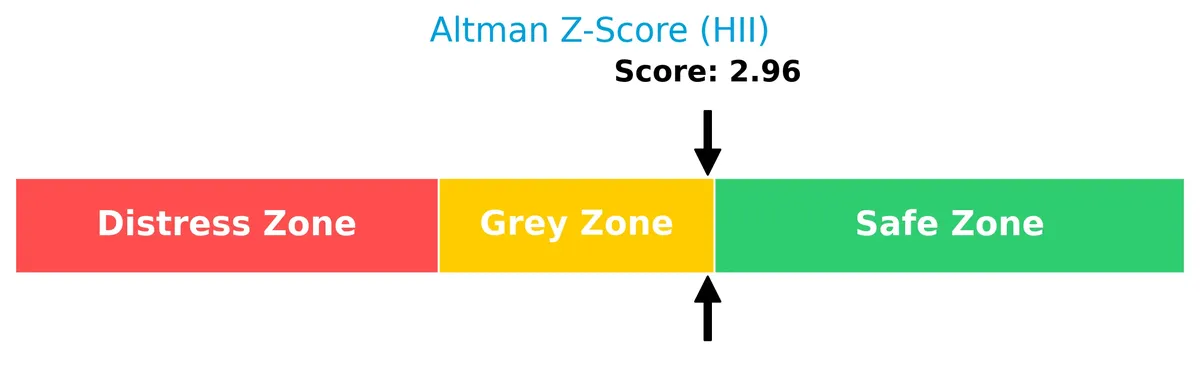
Analysis of the company’s bankruptcy risk
Huntington Ingalls Industries, Inc. falls in the Altman Z-Score grey zone at 2.96, signaling a moderate risk of financial distress:
Is the company in good financial health?
The Piotroski Score diagram highlights the company’s financial strength based on nine key criteria:
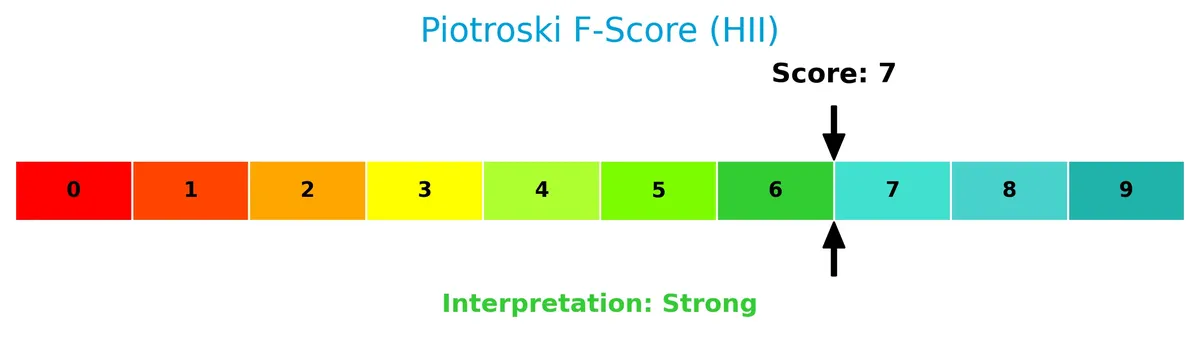
With a strong Piotroski Score of 7, the company demonstrates solid financial health, reflecting effective profitability, liquidity, and operational efficiency.
Competitive Landscape & Sector Positioning
This sector analysis explores Huntington Ingalls Industries’ strategic positioning, revenue segments, key products, and main competitors. I will assess whether the company holds a competitive advantage within the aerospace and defense industry.
Strategic Positioning
Huntington Ingalls Industries concentrates on U.S. military shipbuilding with three segments: Newport News Shipbuilding (6B+ revenue), Ingalls Shipbuilding (~2.7B), and Mission Technologies (~2.9B). It focuses on defense contracts and nuclear-powered vessels, maintaining a specialized, geographically concentrated portfolio.
Revenue by Segment
This pie chart illustrates Huntington Ingalls Industries’ revenue breakdown by segment for the fiscal year ending December 31, 2024. It highlights the relative size of each business unit within that period.
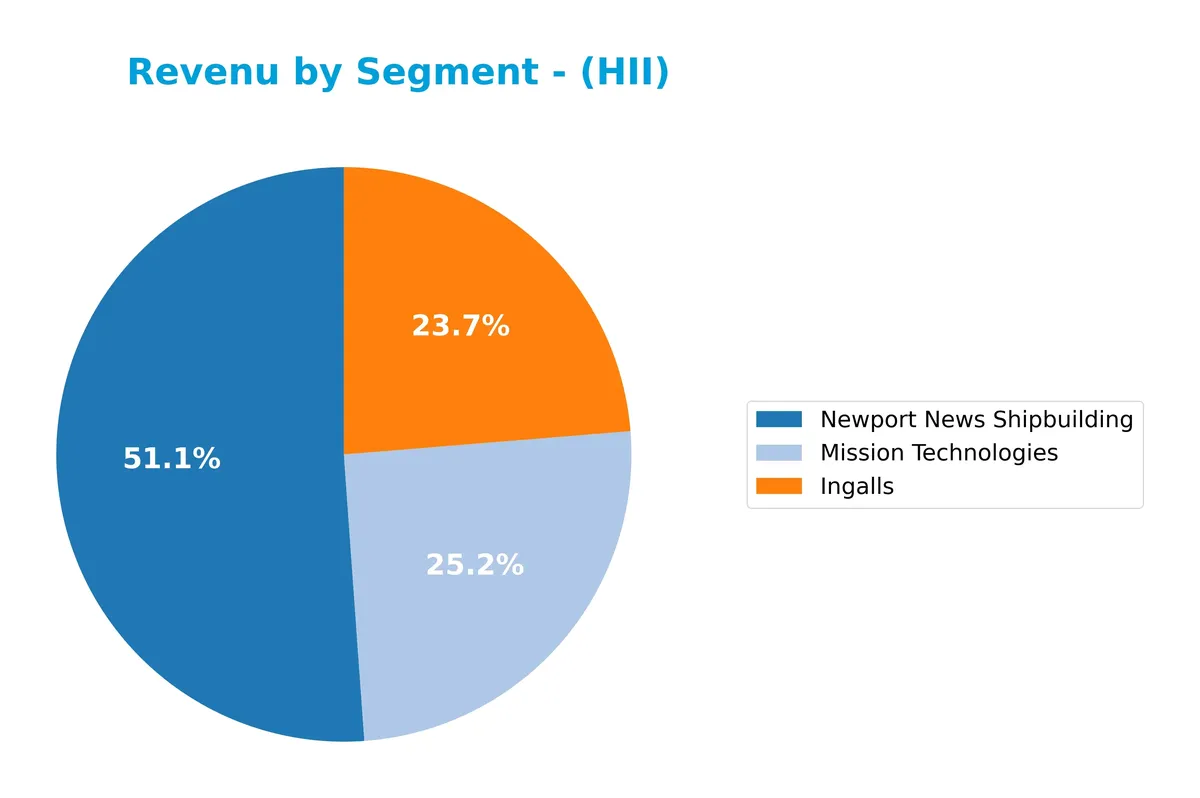
In 2024, Newport News Shipbuilding remains the largest segment at 6B, though it declined slightly from 6.13B in 2023. Mission Technologies shows steady growth, reaching 2.94B, while Ingalls holds stable near 2.77B. The data reveals a concentrated business with shipbuilding driving over half the revenue, but Mission Technologies’ acceleration signals diversification. Watch for potential risks tied to shipbuilding’s modest recent slowdown.
Key Products & Brands
The table below outlines Huntington Ingalls Industries’ primary products and business segments:
| Product | Description |
|---|---|
| Ingalls Shipbuilding | Designs and constructs non-nuclear military ships, including amphibious assault and expeditionary warfare vessels. |
| Newport News Shipbuilding | Builds nuclear-powered ships such as aircraft carriers and submarines; also provides refueling and overhaul services. |
| Mission Technologies | Offers high-end IT, mission-based solutions, and defense systems for DoD, intelligence, and federal agencies. |
| Technical Solutions | Provides naval nuclear support, life-cycle sustainment services, and environmental management for military and government clients. |
Huntington Ingalls Industries operates through distinct segments covering shipbuilding and advanced defense technologies. Its portfolio balances traditional naval construction with innovative technical services, supporting U.S. military and federal agencies.
Main Competitors
The Aerospace & Defense sector has 12 competitors, with the table below showing the top 10 leaders by market capitalization:
| Competitor | Market Cap. |
|---|---|
| GE Aerospace | 338B |
| RTX Corporation | 251B |
| The Boeing Company | 171B |
| Lockheed Martin Corporation | 116B |
| General Dynamics Corporation | 93B |
| Northrop Grumman Corporation | 84B |
| TransDigm Group Incorporated | 77B |
| L3Harris Technologies, Inc. | 57B |
| Axon Enterprise, Inc. | 44B |
| BWX Technologies, Inc. | 17B |
Huntington Ingalls Industries ranks 12th among 12 competitors in this sector. Its market cap is just 4.29% of the leader, GE Aerospace. The company is below both the average market cap of the top 10 (125B) and the sector median (80B). It sits 5.75% below its closest competitor above, indicating a noticeable gap in scale.
Comparisons with competitors
Check out how we compare the company to its competitors:
Does HII have a competitive advantage?
Huntington Ingalls Industries presents a competitive advantage through its specialized expertise in military shipbuilding and lifecycle sustainment for the U.S. Navy and Coast Guard. Its high gross margin of 69%, stable net margin near 5%, and strong revenue growth above 8% reflect operational strength despite challenges in EBIT margin and declining ROIC trends.
Looking ahead, HII’s opportunities lie in expanding advanced naval nuclear support and mission-based IT solutions for defense and federal clients. Continued innovation in unmanned systems and new shipbuilding contracts could drive future market penetration, though margin volatility and capital efficiency require close monitoring.
SWOT Analysis
This SWOT analysis highlights Huntington Ingalls Industries’ core strategic position as of 2026.
Strengths
- strong revenue growth
- diversified defense segments
- stable market position
Weaknesses
- declining ROIC trend
- weak EBIT margin
- unfavorable liquidity ratios
Opportunities
- expanding defense budgets
- technological innovation in naval systems
- increased demand for sustainment services
Threats
- government budget volatility
- competitive aerospace landscape
- geopolitical uncertainties
Huntington Ingalls shows robust growth and a solid niche in military shipbuilding. However, declining returns and liquidity weaknesses require cautious capital allocation. The company must leverage defense spending growth while managing budget and geopolitical risks.
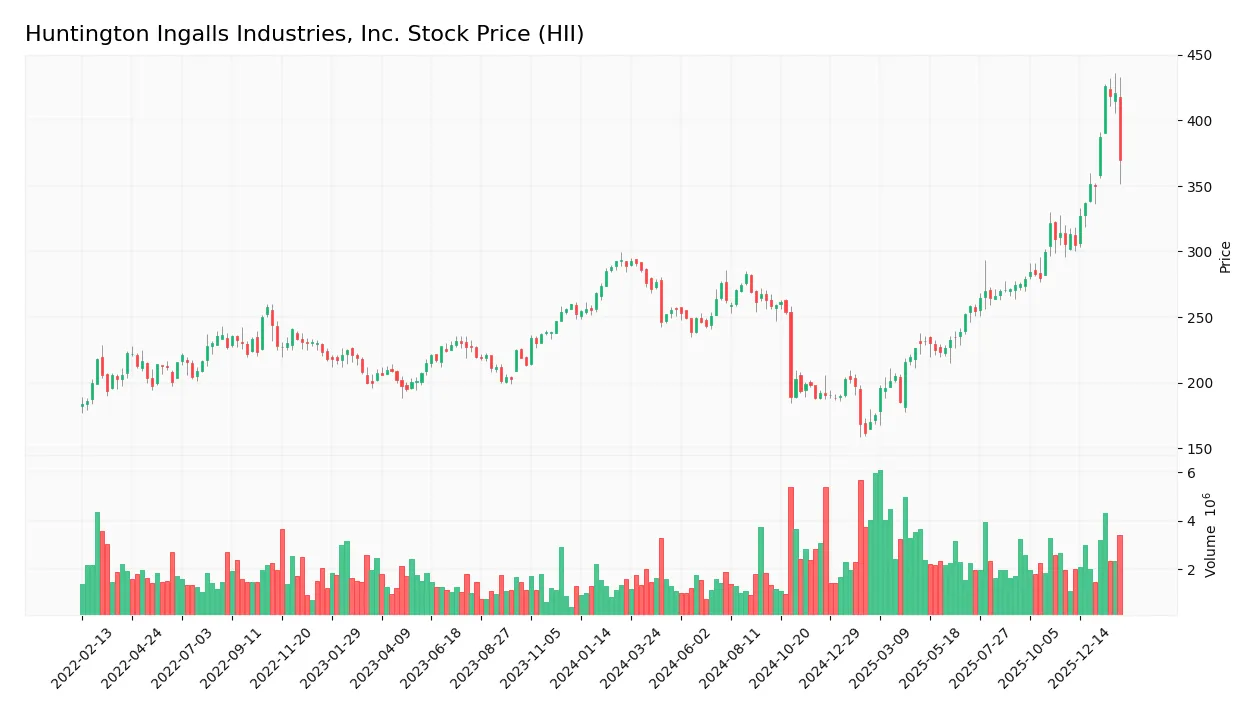
Stock Price Action Analysis
The following weekly stock price chart for Huntington Ingalls Industries, Inc. shows significant appreciation with notable price swings over the past two years:
Trend Analysis
Over the past 12 months, the stock price increased by 27.91%, confirming a bullish trend with clear acceleration. The price ranged from a low of 161.27 to a high of 425.9. Volatility is high, with a standard deviation of 53.57, indicating wide price fluctuations.
Volume Analysis
Trading volume shows an increasing trend, with buyers accounting for 63.04% of total volume over the analyzed period. Recent three-month data confirms buyer dominance at 61.7%, suggesting strong investor interest and positive market participation.
Target Prices
Analysts set a clear target consensus for Huntington Ingalls Industries, reflecting confident growth expectations.
| Target Low | Target High | Consensus |
|---|---|---|
| 264 | 425 | 367 |
The target prices indicate analysts expect HII to appreciate significantly, with a bullish outlook supported by a high consensus near 370.

Don’t Let Luck Decide Your Entry Point
Optimize your entry points with our advanced ProRealTime indicators. You’ll get efficient buy signals with precise price targets for maximum performance. Start outperforming now!
Analyst & Consumer Opinions
This section examines analyst ratings and consumer feedback to provide a balanced view of Huntington Ingalls Industries, Inc.
Stock Grades
Here is the latest summary of Huntington Ingalls Industries, Inc. grades from leading financial institutions:
| Grading Company | Action | New Grade | Date |
|---|---|---|---|
| Goldman Sachs | Maintain | Buy | 2026-01-20 |
| Citigroup | Maintain | Buy | 2026-01-13 |
| JP Morgan | Maintain | Neutral | 2025-11-03 |
| TD Cowen | Maintain | Buy | 2025-10-31 |
| Goldman Sachs | Maintain | Buy | 2025-10-31 |
| B of A Securities | Maintain | Underperform | 2025-08-13 |
| Barclays | Maintain | Equal Weight | 2025-08-04 |
| TD Cowen | Upgrade | Buy | 2025-07-10 |
| Barclays | Maintain | Equal Weight | 2025-05-05 |
| Goldman Sachs | Maintain | Buy | 2025-05-02 |
The grades reflect a prevailing Buy sentiment with major firms maintaining positive stances, though some caution appears with Underperform and Equal Weight ratings. This mixed pattern suggests balanced investor views on near-term prospects.
Consumer Opinions
Consumers show a mixed yet insightful view of Huntington Ingalls Industries, reflecting both respect for craftsmanship and concern over pricing.
| Positive Reviews | Negative Reviews |
|---|---|
| “Exceptional build quality on naval vessels.” | “Long delivery times on contracts.” |
| “Strong commitment to safety and innovation.” | “High program costs compared to peers.” |
| “Experienced workforce with skilled engineers.” | “Limited transparency in project updates.” |
Overall, consumers praise HII’s craftsmanship and innovation but frequently cite delays and pricing as pain points. The company’s strengths lie in quality and expertise, while operational efficiency needs attention.
Risk Analysis
Below is a summary table of key risks facing Huntington Ingalls Industries, Inc.:
| Category | Description | Probability | Impact |
|---|---|---|---|
| Financial Health | Altman Z-Score of 2.96 places the company in the grey zone for distress. | Medium | High |
| Profitability | Unfavorable net margin (4.85%) and zero ROE signal weak earnings power. | High | Medium |
| Liquidity | Current and quick ratios at zero indicate severe short-term liquidity risk. | High | High |
| Interest Expense | Negative interest coverage ratio suggests difficulty covering interest. | Medium | High |
| Market Volatility | Stock dropped 10.5%, reflecting market sensitivity despite low beta (0.33). | Medium | Medium |
The grey zone Altman Z-Score and zero liquidity ratios are red flags. I see liquidity risk as the most urgent. Weak profitability further limits financial flexibility. Recent 10.5% price drop signals investor caution amid sector pressures. Investors must weigh these risks prudently.
Should You Buy Huntington Ingalls Industries, Inc.?
Huntington Ingalls Industries appears to exhibit improving profitability with moderate operational efficiency, while its competitive moat could be seen as eroding given declining ROIC trends. Despite a manageable leverage profile, the overall rating suggests a very favorable B+ investment profile.
Strength & Efficiency Pillars
Huntington Ingalls Industries, Inc. shows a strong financial foundation with a gross margin of 69.42% and favorable revenue growth of 31.08% over the last period. The Piotroski score of 7 signals robust financial health, underpinned by effective capital allocation and operational efficiency. The Altman Z-Score of 2.96 places the company in the grey zone for bankruptcy risk, indicating moderate financial stability. While ROE and ROIC data are unavailable or unfavorable, the strong profitability metrics and solid Piotroski score highlight its resilience.
Weaknesses and Drawbacks
Significant risks emerge from unfavorable net margin at 4.85% and zero values for ROE and ROIC, which suggest limited returns on equity and capital invested. The company’s current and quick ratios are reported as zero, signaling potential liquidity concerns that could impede its ability to cover short-term obligations. Additionally, an interest coverage ratio near zero flags vulnerability to rising debt costs. Valuation metrics like P/E at 22.09 remain neutral but do not offer a margin of safety in a volatile market environment.
Our Verdict about Huntington Ingalls Industries, Inc.
The company presents an overall favorable fundamental profile, driven by strong operational metrics and a healthy Piotroski score. Coupled with a bullish long-term stock trend and buyer dominance of 61.7% in the recent period, Huntington Ingalls Industries might appear attractive. However, liquidity red flags and weak return metrics suggest prudence. Despite long-term strength, recent financial weaknesses imply a wait-and-see approach may be prudent for a better entry point.
Disclaimer: This content is for informational purposes only and does not constitute financial, investment, or other professional advice. Investing in financial markets involves a significant risk of loss, and past performance is not indicative of future results.
Additional Resources
- Strong Newport News Shipbuilding Performance Drives HII’s Q4 Results – TradingView (Feb 05, 2026)
- Are Aerospace Stocks Lagging Huntington Ingalls Industries (HII) This Year? – Yahoo Finance (Feb 05, 2026)
- Huntington Ingalls Industries (NYSE:HII) Shares Gap Down – Should You Sell? – MarketBeat (Feb 05, 2026)
- Huntington Ingalls beats Q4 estimates, but cash flow outlook weighs on shares (HII:NYSE) – Seeking Alpha (Feb 05, 2026)
- How Investors Are Reacting To Huntington Ingalls Industries (HII) Completing CVN 79 Builder’s Sea Trials – simplywall.st (Feb 05, 2026)
For more information about Huntington Ingalls Industries, Inc., please visit the official website: huntingtoningalls.com