Home > Analyses > Financial Services > Huntington Bancshares Incorporated
Huntington Bancshares shapes everyday financial experiences for millions, powering small businesses and families across the Midwest. It commands regional banking with diverse services, from retail and commercial loans to wealth management and vehicle financing. Known for customer-centric innovation and solid community ties, Huntington navigates a competitive landscape with disciplined growth. The critical question: does Huntington’s current financial health and market position justify its valuation and future growth potential?

Table of contents
Business Model & Company Overview
Huntington Bancshares Incorporated, founded in 1866 and headquartered in Columbus, Ohio, commands a dominant position in regional banking across 11 states. Its core mission integrates commercial, consumer, mortgage, and private client banking into a cohesive financial ecosystem. The bank operates through four distinct segments, each targeting diverse client needs from small businesses to high-net-worth individuals, reinforcing its comprehensive market coverage.
The company’s revenue engine balances traditional banking products like loans and deposits with specialized services in vehicle finance and wealth management. It leverages a strategic footprint across the US, primarily in the Midwest, with expanding digital platforms enhancing customer reach. Huntington’s economic moat lies in its broad service mix and deep regional relationships, positioning it as a key architect of the financial landscape in its markets.
Financial Performance & Fundamental Metrics
I will analyze Huntington Bancshares Incorporated’s income statement, key financial ratios, and dividend payout policy to assess its core financial health and shareholder returns.
Income Statement
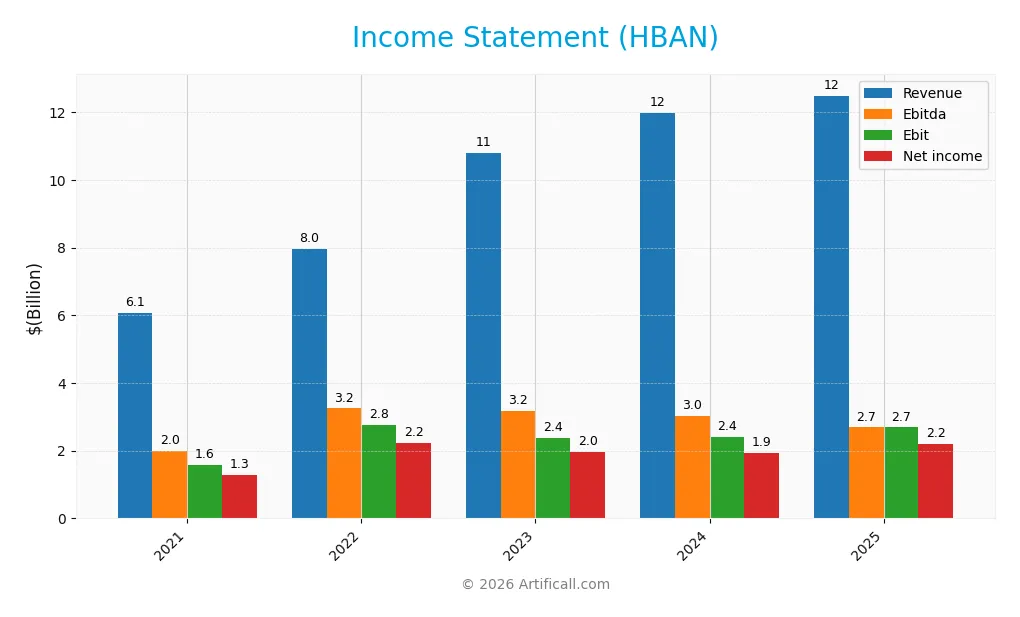
The table below summarizes Huntington Bancshares Incorporated’s key income statement items over the last five fiscal years, reflecting revenue trends and profitability metrics.
| 2021 | 2022 | 2023 | 2024 | 2025 | |
|---|---|---|---|---|---|
| Revenue | 6.08B | 7.95B | 10.78B | 11.96B | 12.49B |
| Cost of Revenue | 114M | 985M | 3.88B | 5.00B | 4.78B |
| Operating Expenses | 4.38B | 4.20B | 4.52B | 4.56B | 5.02B |
| Gross Profit | 5.97B | 6.97B | 6.90B | 6.97B | 7.70B |
| EBITDA | 1.98B | 3.25B | 3.18B | 3.03B | 2.69B |
| EBIT | 1.59B | 2.76B | 2.38B | 2.40B | 2.69B |
| Interest Expense | 89M | 696M | 3.48B | 4.58B | 4.32B |
| Net Income | 1.30B | 2.24B | 1.95B | 1.94B | 2.21B |
| EPS | 0.91 | 1.47 | 1.26 | 1.24 | 1.41 |
| Filing Date | 2022-02-18 | 2023-02-17 | 2024-02-16 | 2025-02-14 | 2026-02-13 |
Income Statement Evolution
Huntington Bancshares’ revenue grew steadily, rising 4.4% in 2025 and more than doubling since 2021. Net income increased 9.2% in the last year and 71% overall, despite a 17% decline in net margins over five years. Gross and EBIT margins improved, reflecting efficient cost management amid rising revenues.
Is the Income Statement Favorable?
In 2025, strong gross (61.7%) and EBIT (21.5%) margins signal operational strength. Net margin remains favorable at 17.7%, yet interest expense consumes 34.6% of income, a notable weakness. Revenue and EPS growth rates are positive, but rising operating expenses relative to revenue warrant attention. Overall, fundamentals appear generally favorable with some caution advised.
Financial Ratios
The following table summarizes key financial ratios for Huntington Bancshares Incorporated (HBAN) over the last five fiscal years:
| Ratios | 2021 | 2022 | 2023 | 2024 | 2025 |
|---|---|---|---|---|---|
| Net Margin | 21.3% | 28.2% | 18.1% | 16.2% | 17.7% |
| ROE | 6.7% | 12.6% | 10.1% | 9.8% | 9.1% |
| ROIC | 4.2% | 6.4% | 5.2% | 4.7% | -1.8% |
| P/E | 15.0 | 9.1 | 9.4 | 12.2 | 11.6 |
| P/B | 1.01 | 1.15 | 0.95 | 1.20 | 1.05 |
| Current Ratio | 0.088 | 0.095 | 0.135 | 0.153 | 0.096 |
| Quick Ratio | 0.088 | 0.095 | 0.135 | 0.153 | 0.096 |
| D/E | 0.39 | 0.66 | 0.67 | 0.84 | 0.76 |
| Debt-to-Assets | 4.3% | 6.4% | 6.9% | 8.1% | 8.2% |
| Interest Coverage | 17.9 | 4.0 | 0.69 | 0.53 | 0.62 |
| Asset Turnover | 0.035 | 0.043 | 0.057 | 0.059 | 0.055 |
| Fixed Asset Turnover | 5.22 | 6.88 | 9.72 | 11.22 | 9.45 |
| Dividend Yield | 4.6% | 5.0% | 5.6% | 4.4% | 4.0% |
Evolution of Financial Ratios
From 2021 to 2025, HBAN’s Return on Equity (ROE) declined from 6.7% to 9.1%, showing modest fluctuation but a slight downward trend in recent years. The Current Ratio remained consistently low, hovering around 0.1, indicating minimal short-term liquidity. The Debt-to-Equity Ratio increased from 0.39 to 0.76, reflecting a cautious rise in leverage. Profitability margins declined steadily, with net margin dropping from 21.3% to 17.7%, signaling thinner profits.
Are the Financial Ratios Fovorable?
In 2025, HBAN shows mixed financial health. Profitability metrics like net margin (17.7%) and dividend yield (3.96%) are favorable, but ROE (9.1%) and return on invested capital (−1.8%) fall below ideal benchmarks. Liquidity ratios remain critically low, with the current ratio at 0.1, a red flag for short-term obligations. Leverage is neutral to favorable, with debt to assets at 8.2% but interest coverage weak at 0.62. Overall, the ratios present a slightly unfavorable profile.
Shareholder Return Policy
Huntington Bancshares Incorporated maintains a dividend payout ratio around 45-68%, with dividend yields between 3.96% and 5.62% over recent years. Dividend payments are supported by strong free cash flow coverage, indicating disciplined capital allocation.
The company also engages in share buybacks, complementing dividend distributions. This balanced approach supports sustainable long-term shareholder value by aligning returns with available cash generation and avoiding overextension risks.
Score analysis
The following radar chart highlights Huntington Bancshares’ key financial scores for a comprehensive performance snapshot:
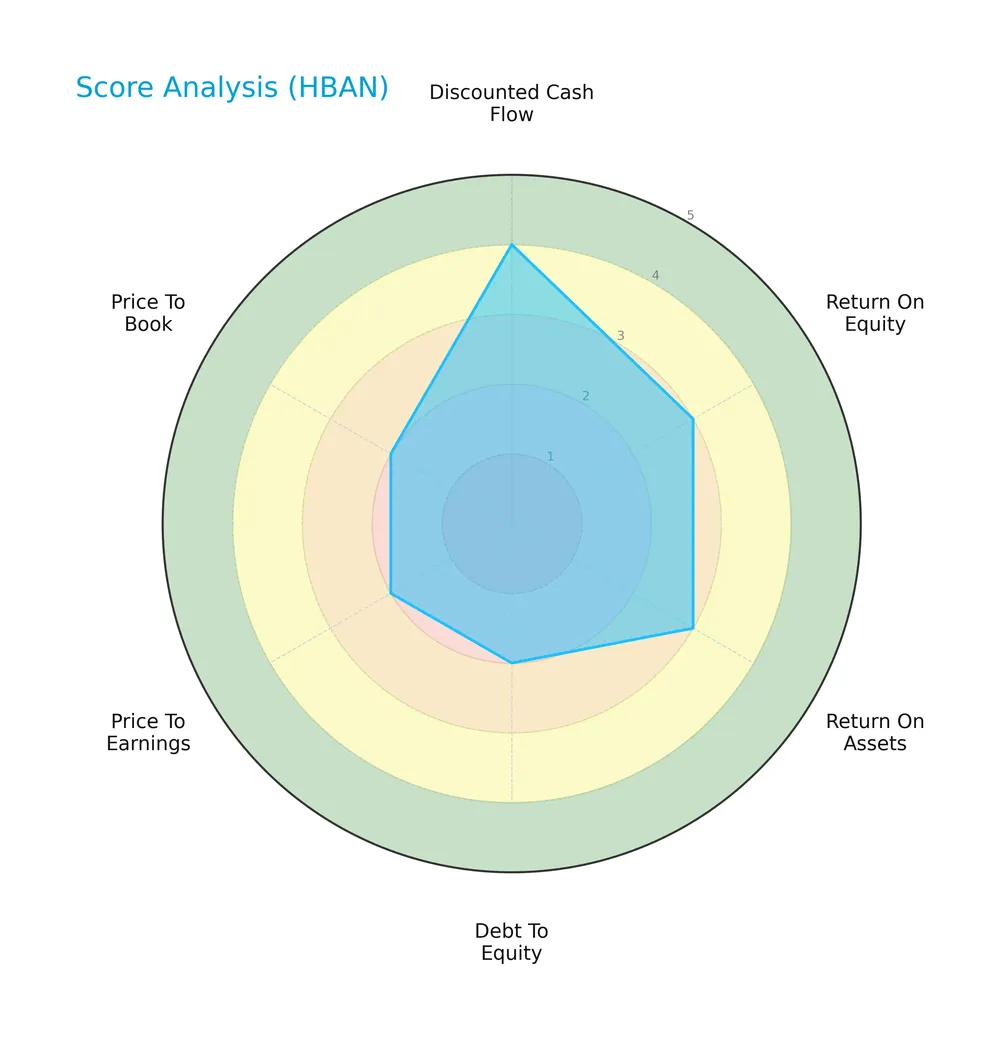
Huntington Bancshares scores well on discounted cash flow (4) but shows moderate returns on equity and assets (3 each). Debt-to-equity, price-to-earnings, and price-to-book ratios score unfavorably at 2, indicating valuation and leverage concerns.
Analysis of the company’s bankruptcy risk
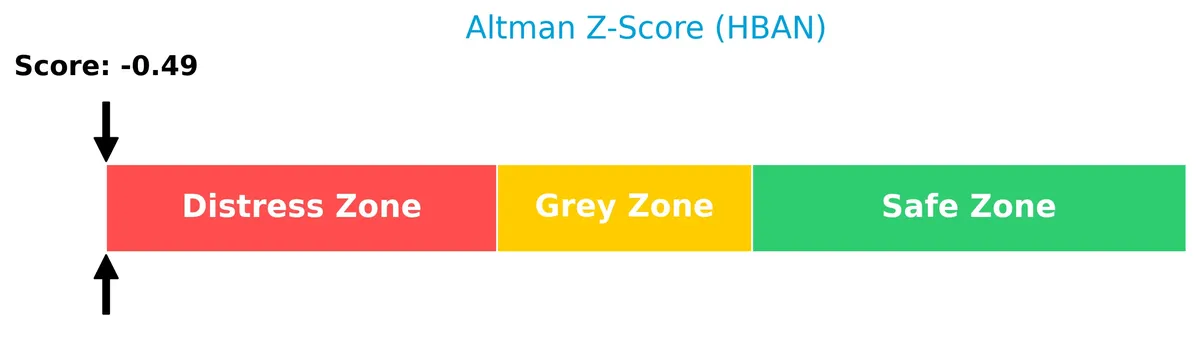
The Altman Z-Score places the company in the distress zone, signaling a significant risk of financial distress and potential bankruptcy:
Is the company in good financial health?
The Piotroski F-Score diagram provides insight into the company’s financial strength and operational efficiency:

With a Piotroski score of 5, Huntington Bancshares shows average financial health, suggesting moderate strength but room for improvement in profitability and efficiency.
Competitive Landscape & Sector Positioning
This sector analysis explores Huntington Bancshares Incorporated’s strategic positioning and revenue segments. I will examine key products, main competitors, and competitive advantages. I aim to determine if Huntington holds a clear competitive edge over its peers.
Strategic Positioning
Huntington Bancshares operates a diversified banking model across four segments, blending consumer, commercial, vehicle finance, and private client services. Its presence spans 1,000 branches in 11 states, emphasizing regional concentration with multi-product exposure, balancing traditional banking and specialized financial services.
Revenue by Segment
This pie chart illustrates Huntington Bancshares Incorporated’s revenue distribution by segment for fiscal year 2025, highlighting the key contributors to its business model.
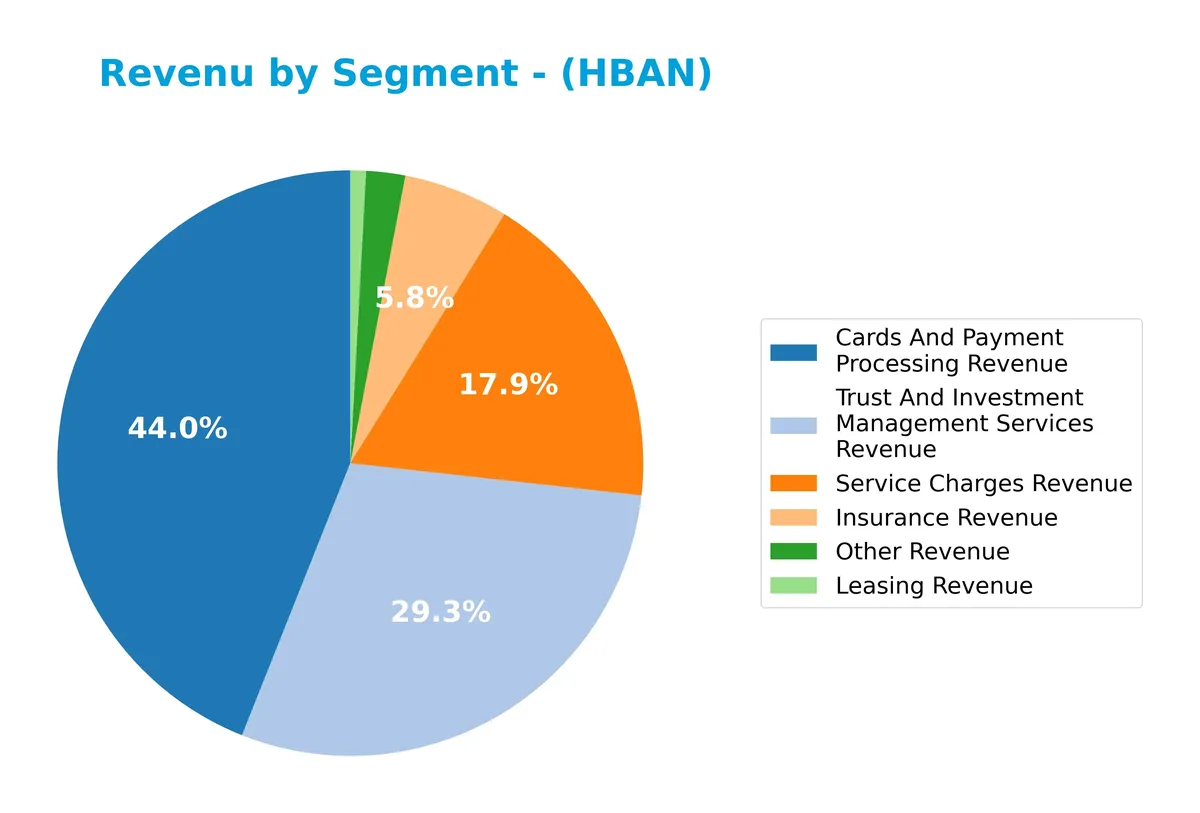
In 2025, Cards and Payment Processing Revenue leads with 613M, followed by Service Charges at 250M and Trust and Investment Management Services at 408M. Insurance Revenue shows steady growth, reaching 81M. Notably, Leasing Revenue declined to 12M after previous fluctuations. The concentration in payment processing and trust services signals a strategic emphasis, though diversification remains crucial to mitigate segment-specific risks.
Key Products & Brands
The table below summarizes Huntington Bancshares’ main products and services with concise descriptions:
| Product | Description |
|---|---|
| Consumer and Business Banking | Checking, savings, money market accounts, CDs, credit cards, consumer and small business loans, mortgages, insurance, online and mobile banking. |
| Commercial Banking | Middle market business loans, government/public sector financing, commercial real estate, specialty banking for healthcare, tech, telecom, franchise finance, and global services. Includes asset finance and treasury management. |
| Vehicle Finance | Consumer and dealer financing for automobiles, light trucks, recreational vehicles, and marine craft. |
| Regional Banking & Private Client | Private banking, wealth and investment management, retirement plan services. |
| Cards and Payment Processing | Revenue from issuing and processing credit and debit cards. |
| Service Charges | Fees from account maintenance, overdrafts, and other banking services. |
| Trust and Investment Management | Wealth management and fiduciary services generating revenue through asset administration and advisory. |
| Insurance | Insurance products and related revenue streams. |
| Leasing | Leasing services generating revenue from equipment and asset leases. |
| Other Revenue | Miscellaneous revenue sources not categorized elsewhere. |
Huntington Bancshares offers a diverse product mix, spanning traditional banking, commercial financing, vehicle loans, and wealth management. Its income streams reflect a broad financial services footprint, driven by both fee-based and interest income components.
Main Competitors
There are 9 competitors in total. The table below lists the top 10 leaders by market capitalization:
| Competitor | Market Cap. |
|---|---|
| U.S. Bancorp | 83.8B |
| The PNC Financial Services Group, Inc. | 82.9B |
| Truist Financial Corporation | 64.6B |
| Fifth Third Bancorp | 31.5B |
| M&T Bank Corporation | 31.4B |
| Huntington Bancshares Incorporated | 25.5B |
| Citizens Financial Group, Inc. | 25.5B |
| Regions Financial Corporation | 24.9B |
| KeyCorp | 22.9B |
Huntington Bancshares ranks 6th among its peers. It holds roughly 32% of the leader’s market cap, U.S. Bancorp. The company falls below both the average market cap of the top 10 competitors (43.7B) and the sector median (31.4B). Its market cap exceeds the next competitor above by 15.4%, indicating a moderate gap with its closest rival.
Comparisons with competitors
Check out how we compare the company to its competitors:
Does HBAN have a competitive advantage?
Huntington Bancshares Incorporated does not present a competitive advantage. Its return on invested capital (ROIC) falls significantly below its weighted average cost of capital (WACC), indicating value destruction and declining profitability.
Looking ahead, Huntington operates across diverse banking segments including consumer, commercial, vehicle finance, and private client services. Opportunities exist to leverage new products and expand in regional markets, but value creation remains a key challenge.
SWOT Analysis
This SWOT analysis highlights Huntington Bancshares Incorporated’s core internal and external factors to guide strategic decisions.
Strengths
- strong gross margin at 61.7%
- favorable net margin growth of 9.19%
- consistent dividend yield near 4%
Weaknesses
- negative ROIC versus WACC signals value destruction
- weak liquidity with current ratio at 0.1
- low interest coverage ratio at 0.62
Opportunities
- expanding digital and mobile banking services
- regional commercial banking growth potential
- wealth management segment expansion
Threats
- rising interest expenses impacting profitability
- intense regional banking competition
- macroeconomic risks affecting loan demand
Huntington’s strengths in margins and dividends support a stable income base but value destruction and liquidity weaknesses pose risks. Strategic focus should prioritize improving capital efficiency and managing rising expenses to seize growth opportunities while mitigating competitive and economic threats.
Stock Price Action Analysis
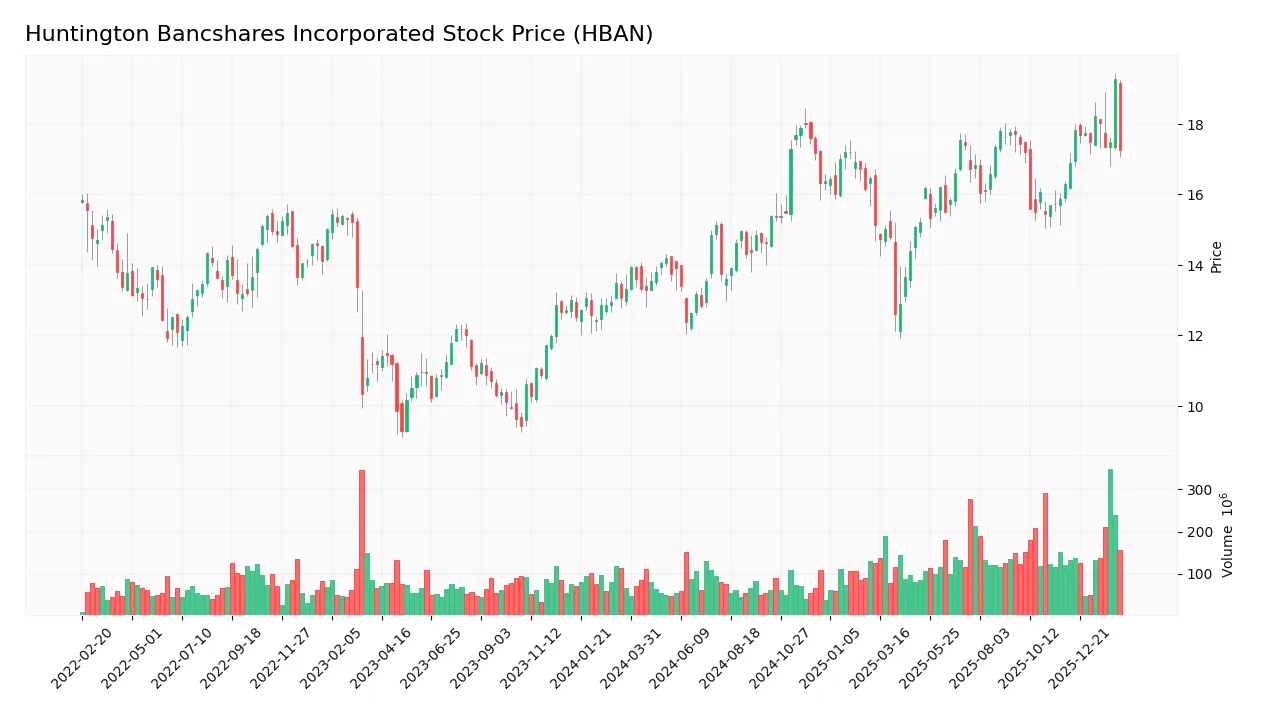
The weekly chart displays Huntington Bancshares Incorporated’s stock price evolution over the past 12 months, highlighting key price movements and volatility:
Trend Analysis
Over the past 12 months, HBAN’s stock price rose 29.68%, confirming a bullish trend with accelerating momentum. The price ranged from a low of 12.37 to a high of 19.27, supported by moderate volatility (1.6 std deviation). Recent months continue this positive slope with a 5.89% gain and lower volatility (0.7).
Volume Analysis
Trading volume has increased overall, with buyers accounting for 55.44% of 12.6B shares traded. In the recent 2.5-month period, buyer dominance strengthened to 62.98%, signaling buyer-driven activity. This suggests growing investor confidence and heightened market participation in HBAN shares.
Target Prices
Analysts set a clear target consensus for Huntington Bancshares Incorporated (HBAN).
| Target Low | Target High | Consensus |
|---|---|---|
| 16 | 23 | 20.22 |
The target range reflects moderate optimism, with analysts expecting upside potential near 20% from current levels. This signals cautious confidence in HBAN’s growth prospects.

Don’t Let Luck Decide Your Entry Point
Optimize your entry points with our advanced ProRealTime indicators. You’ll get efficient buy signals with precise price targets for maximum performance. Start outperforming now!
Analyst & Consumer Opinions
This section reviews analyst ratings and consumer feedback to provide a comprehensive view of Huntington Bancshares Incorporated’s market perception.
Stock Grades
Here are the latest verified analyst grades for Huntington Bancshares Incorporated (HBAN) from reputable firms:
| Grading Company | Action | New Grade | Date |
|---|---|---|---|
| JP Morgan | Maintain | Overweight | 2026-02-09 |
| Truist Securities | Maintain | Buy | 2026-01-26 |
| Keefe, Bruyette & Woods | Maintain | Market Perform | 2026-01-23 |
| Morgan Stanley | Maintain | Overweight | 2026-01-23 |
| Barclays | Maintain | Equal Weight | 2026-01-05 |
| RBC Capital | Maintain | Outperform | 2025-12-19 |
| Piper Sandler | Maintain | Underweight | 2025-12-10 |
| DA Davidson | Maintain | Buy | 2025-10-28 |
| Keefe, Bruyette & Woods | Maintain | Market Perform | 2025-10-20 |
| TD Cowen | Maintain | Buy | 2025-10-20 |
The consensus reflects a stable outlook with most analysts maintaining Buy or Overweight ratings. A minority hold Market Perform or Underweight views, indicating cautious optimism within the sector.
Consumer Opinions
Huntington Bancshares Incorporated (HBAN) evokes mixed emotions from its customers, reflecting both loyalty and areas needing improvement.
| Positive Reviews | Negative Reviews |
|---|---|
| Friendly, helpful staff who resolve issues quickly | Long wait times for customer service calls |
| Convenient branch locations and extended hours | Mobile app frequently crashes or lags |
| Transparent fees and clear communication | Limited ATM network compared to larger banks |
| Competitive interest rates on savings accounts | Occasional errors in transaction processing |
Overall, consumers praise Huntington’s customer service and accessibility but consistently flag technology glitches and network limitations as pain points. These feedback themes suggest operational focus areas to enhance customer satisfaction.
Risk Analysis
Below is a summary table of key risks Huntington Bancshares faces, highlighting their likelihood and potential impact:
| Category | Description | Probability | Impact |
|---|---|---|---|
| Financial Health | Altman Z-score in distress zone signals high bankruptcy risk | High | High |
| Liquidity | Critically low current and quick ratios (0.1) indicate liquidity risk | High | High |
| Profitability | Negative ROIC (-1.8%) below WACC (12.67%) reflects poor capital returns | Medium | Medium |
| Leverage | Debt-to-equity score unfavorable; moderate debt levels | Medium | Medium |
| Market Valuation | Low P/E and P/B scores despite favorable absolute values | Medium | Low |
| Interest Coverage | Very low interest coverage (0.62) poses refinancing and solvency risks | High | High |
The most alarming risks are Huntington’s financial distress signals and liquidity challenges. The Altman Z-score below zero and a current ratio of 0.1 show severe vulnerability to external shocks. Negative ROIC relative to a high WACC erodes intrinsic value. Interest coverage below 1 heightens default risk if interest rates rise. These red flags warrant cautious position sizing despite the bank’s solid market cap and dividend yield.
Should You Buy Huntington Bancshares Incorporated?
Huntington Bancshares appears to have declining profitability and a very unfavorable moat, suggesting value destruction. Despite a manageable leverage profile, the overall B rating and distress-zone Altman Z-score signal moderate financial health and elevated risk.
Strength & Efficiency Pillars
Huntington Bancshares Incorporated delivers solid operational performance with a net margin of 17.71% and a gross margin of 61.7%. The EBIT margin of 21.53% further underscores efficient core operations. However, the company’s return on invested capital (ROIC) stands at -1.8%, well below its weighted average cost of capital (WACC) at 12.67%. This signals value destruction rather than creation. While operational margins are favorable, the negative ROIC trend highlights weakening profitability and capital inefficiency.
Weaknesses and Drawbacks
The company is in financial distress with an Altman Z-Score of -0.49, indicating a high bankruptcy risk. This solvency concern overshadows other financial metrics. Additionally, liquidity is a critical red flag: the current and quick ratios both sit at 0.1, signaling severe short-term liquidity constraints. Interest coverage is weak at 0.62, raising concerns about debt servicing ability. Despite moderate debt-to-equity of 0.76, valuation metrics such as P/E (11.61) and P/B (1.05) remain reasonable but may not compensate for solvency risks.
Our Final Verdict about Huntington Bancshares Incorporated
Despite decent operational margins and a bullish stock trend with recent buyer dominance, the company’s distressed solvency profile makes it highly speculative. The Altman Z-Score firmly places Huntington Bancshares in the distress zone, overshadowing profitability gains. Investors seeking safety should be cautious, as the risk of bankruptcy is significant, and capital preservation should take priority over growth potential at this stage.
Disclaimer: This content is for informational purposes only and does not constitute financial, investment, or other professional advice. Investing in financial markets involves a significant risk of loss, and past performance is not indicative of future results.
Additional Resources
- JP Morgan Increases Target Price on Huntington Bancshares (HBAN) to $21 – Yahoo Finance (Feb 16, 2026)
- Huntington Bancshares Incorporated to Acquire Cadence Bank – Huntington Bancshares Incorporated (HBAN) (Oct 27, 2025)
- Shell Asset Management Co. Trims Stock Holdings in Huntington Bancshares Incorporated $HBAN – MarketBeat (Feb 16, 2026)
- Huntington Bancshares (HBAN) Is Up 7.8% After Outsourcing Wealth Unit And Refreshing Board – What’s Changed – Sahm (Feb 13, 2026)
- Huntington Bank Completes Merger with Cadence Bank, Expanding Presence Across Texas and the South – PR Newswire (Feb 02, 2026)
For more information about Huntington Bancshares Incorporated, please visit the official website: huntington.com