Home > Analyses > Healthcare > Humana Inc.
Humana Inc. transforms healthcare by delivering comprehensive medical and wellness solutions that touch millions of Americans daily. As a powerhouse in healthcare plans, Humana commands leadership through its diverse offerings—from Medicare and Medicaid services to specialty and pharmacy solutions. Renowned for innovation and quality, it shapes how care is accessed and managed nationwide. Yet, as market dynamics shift, I ask: do Humana’s fundamentals still support its lofty valuation and future growth prospects?

Table of contents
Business Model & Company Overview
Humana Inc., founded in 1961 and headquartered in Louisville, KY, stands as a leading player in the U.S. healthcare plans industry. It operates a comprehensive ecosystem spanning Retail, Group and Specialty, and Healthcare Services segments. This structure supports a core mission to enhance health and well-being through integrated medical and supplemental benefit plans tailored to individual and employer group needs.
Humana’s revenue engine balances commercial fully insured medical plans with specialty products, pharmacy solutions, and home health services. It leverages government contracts, including Medicare, Medicaid, and military programs, to maintain broad market reach across the Americas. The company’s robust member base—over 22M combined—fuels recurring revenue and underpins a powerful economic moat in the evolving healthcare landscape.
Financial Performance & Fundamental Metrics
I analyze Humana Inc.’s income statement, key financial ratios, and dividend payout policy to assess its core financial health and shareholder value.
Income Statement
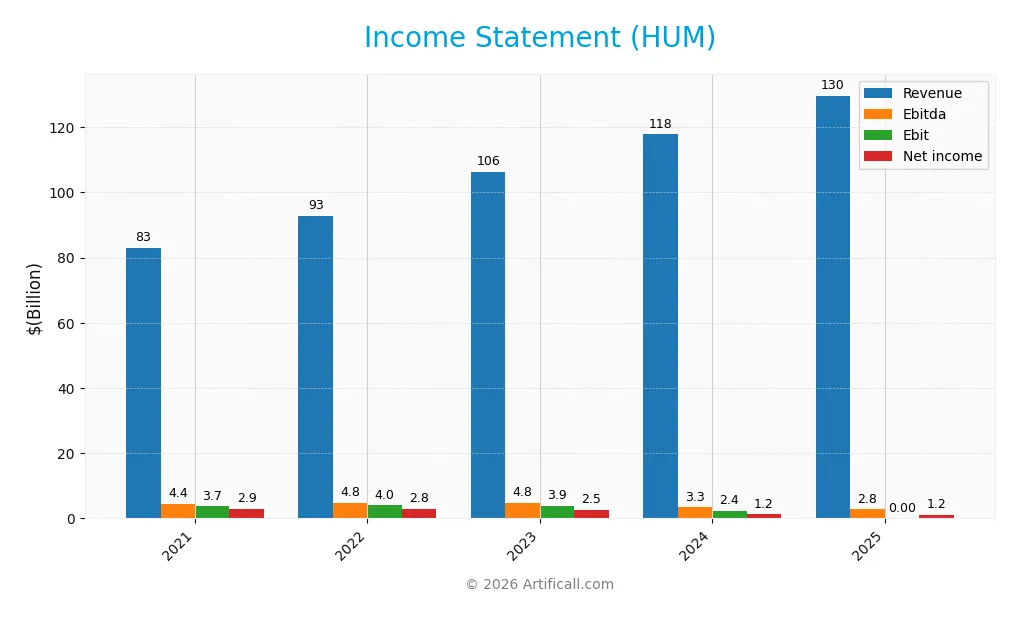
The table below summarizes Humana Inc.’s key income statement items for the fiscal years 2021 through 2025, reported in USD.
| 2021 | 2022 | 2023 | 2024 | 2025 | |
|---|---|---|---|---|---|
| Revenue | 83.6B | 92.9B | 106.4B | 117.8B | 129.7B |
| Cost of Revenue | 69.2B | 75.7B | 88.4B | 100.7B | 110.8B |
| Operating Expenses | 11.0B | 13.7B | 14.7B | 15.5B | 17.4B |
| Gross Profit | 14.4B | 17.2B | 18.0B | 17.1B | 18.9B |
| EBITDA | 4.5B | 4.8B | 4.7B | 3.3B | 2.9B |
| EBIT | 3.7B | 4.0B | 3.8B | 2.3B | 2.1B |
| Interest Expense | 326M | 401M | 493M | 660M | 631M |
| Net Income | 2.9B | 2.8B | 2.5B | 1.2B | 1.2B |
| EPS | 22.79 | 22.20 | 20.09 | 10.01 | 9.87 |
| Filing Date | 2022-02-17 | 2023-02-16 | 2024-02-15 | 2025-02-20 | 2026-02-19 |
Income Statement Evolution
Humana’s revenue rose steadily by 55% from 2021 to 2025, with a 10% increase in 2025 alone. However, net income declined sharply by nearly 60% over the same period, falling again in 2025. Gross margins remained stable around 14.5%, while net margins contracted significantly, reflecting rising costs and weakening profitability.
Is the Income Statement Favorable?
In 2025, Humana’s fundamentals appear mixed. Revenue growth is favorable at 10%, but operating expenses grew at the same pace, eroding profitability. EBIT and net margin both declined year-over-year, signaling margin pressure. Interest expense remains low, which is positive, but overall income statement trends are unfavorable, highlighting challenges in translating top-line gains into earnings.
Financial Ratios
The table below summarizes key financial ratios for Humana Inc. from 2021 to 2025, illustrating its profitability, leverage, liquidity, and market valuation metrics:
| Ratios | 2021 | 2022 | 2023 | 2024 | 2025 |
|---|---|---|---|---|---|
| Net Margin | 3.51% | 3.02% | 2.34% | 1.02% | 0.92% |
| ROE | 18.24% | 18.33% | 15.31% | 7.37% | 6.73% |
| ROIC | — | — | — | 0.00% | 3.69% |
| P/E | 20.35 | 23.08 | 22.78 | 25.34 | 25.97 |
| P/B | 3.71 | 4.23 | 3.49 | 1.87 | 1.75 |
| Current Ratio | 0.00 | 0.00 | 0.00 | 0.00 | 2.00 |
| Quick Ratio | 0.00 | 0.00 | 0.00 | 0.00 | 2.00 |
| D/E | 0.66 | 0.59 | 0.63 | 0.68 | 0.70 |
| Debt-to-Assets | 23.76% | 21.00% | 21.70% | 23.98% | 25.29% |
| Interest Coverage | 10.49 | 8.89 | 6.73 | 2.47 | 2.30 |
| Asset Turnover | 1.89 | 2.16 | 2.26 | 2.53 | 2.65 |
| Fixed Asset Turnover | 22.30 | 24.87 | 30.07 | 39.57 | 58.12 |
| Dividend Yield | 0.59% | 0.61% | 0.76% | 1.41% | 1.39% |
Evolution of Financial Ratios
Humana Inc.’s Return on Equity (ROE) declined from 18.3% in 2022 to 6.7% in 2025, indicating a slowdown in profitability. The Current Ratio remained stable and favorable at about 2.0 in 2025, reflecting solid liquidity. Debt-to-Equity rose modestly to 0.7, suggesting moderate leverage with manageable risk.
Are the Financial Ratios Favorable?
In 2025, Humana shows mixed financial health. Profitability ratios, including ROE (6.7%) and net margin (0.92%), are unfavorable, signaling pressure on earnings. Liquidity is strong, with current and quick ratios at 2.0. Leverage is neutral to favorable, with a debt-to-assets ratio of 25.3% and interest coverage around 3.3x. Asset turnover ratios are favorable, but valuation metrics like P/E at 26x remain elevated. Overall, the ratios lean slightly favorable.
Shareholder Return Policy
Humana Inc. pays dividends consistently with a payout ratio near 36%, supported by a dividend yield around 1.4%. Dividend per share has steadily increased, while free cash flow covers roughly 40% of dividends and capex combined. The company also engages in share buybacks, though specific amounts are not provided.
This balanced approach indicates Humana maintains dividend growth without overly straining cash flow, suggesting prudent capital allocation. Coverage ratios and steady yield imply a sustainable policy aligned with long-term shareholder value, minimizing risks of unsustainable distributions or excessive repurchases.
Score analysis
The radar chart below displays Humana Inc.’s key financial scores, highlighting valuation, profitability, and leverage metrics:
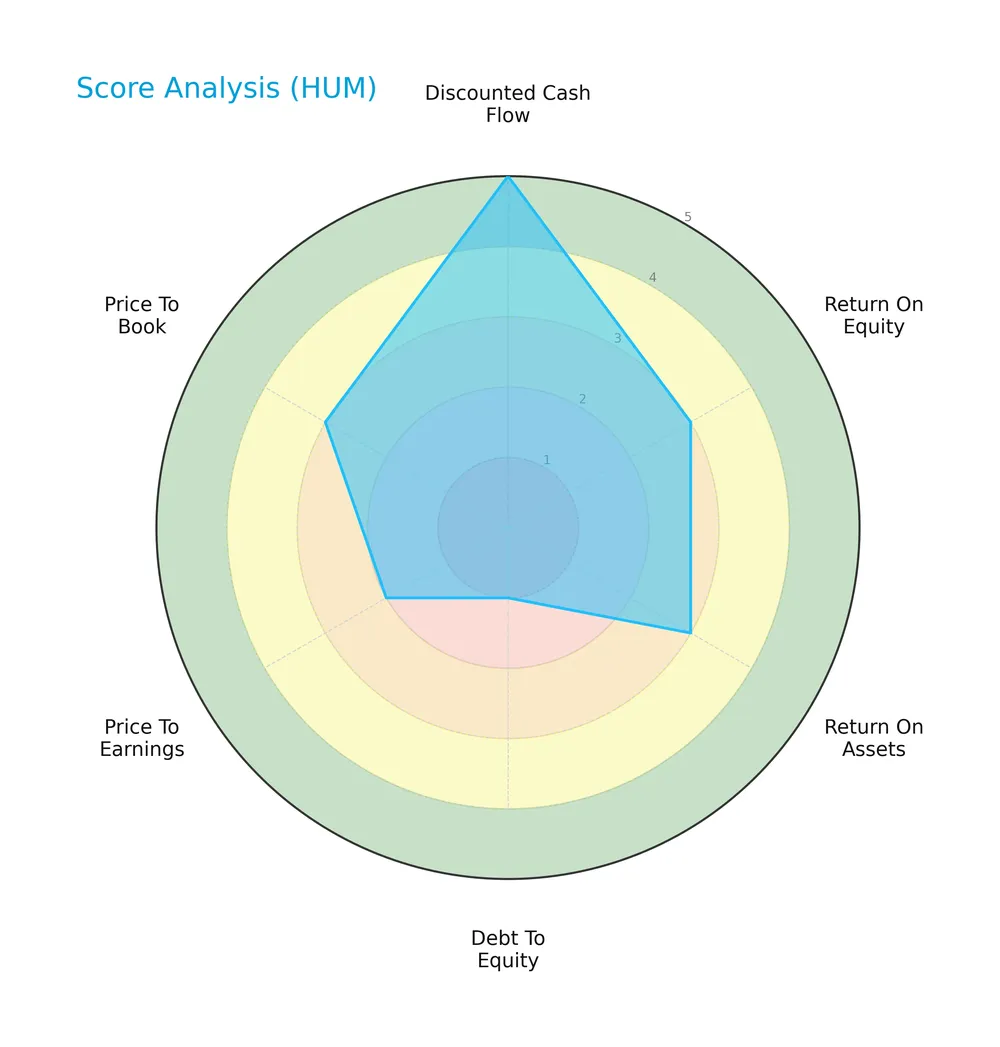
Humana’s discounted cash flow score stands out as very favorable at 5. Return on equity and assets are moderate at 3 each. However, the debt-to-equity score is very unfavorable at 1, signaling leverage concerns. Price-to-earnings is unfavorable at 2, while price-to-book remains moderate at 3.
Analysis of the company’s bankruptcy risk
Humana’s Altman Z-Score places it firmly in the safe zone, indicating low bankruptcy risk and solid financial stability:

Is the company in good financial health?
The Piotroski Score diagram illustrates Humana’s financial strength based on profitability, leverage, and efficiency measures:

With a score of 6 classified as average, Humana shows reasonable financial health but leaves room for improvement in operational and balance sheet metrics.
Competitive Landscape & Sector Positioning
This section analyzes Humana Inc.’s strategic positioning, revenue segments, key products, and competitors within healthcare. I will assess whether Humana maintains a competitive advantage over its main rivals.
Strategic Positioning
Humana Inc. concentrates its operations in the U.S. healthcare sector, with a dual-segment focus on Insurance ($125B in 2025) and CenterWell healthcare services ($22.5B). It leverages a broad product mix spanning medical plans, specialty benefits, and home health services, emphasizing integrated care delivery.
Revenue by Segment
The pie chart presents Humana Inc.’s revenue distribution across its key segments for the fiscal year 2025, highlighting the relative scale of each business line.
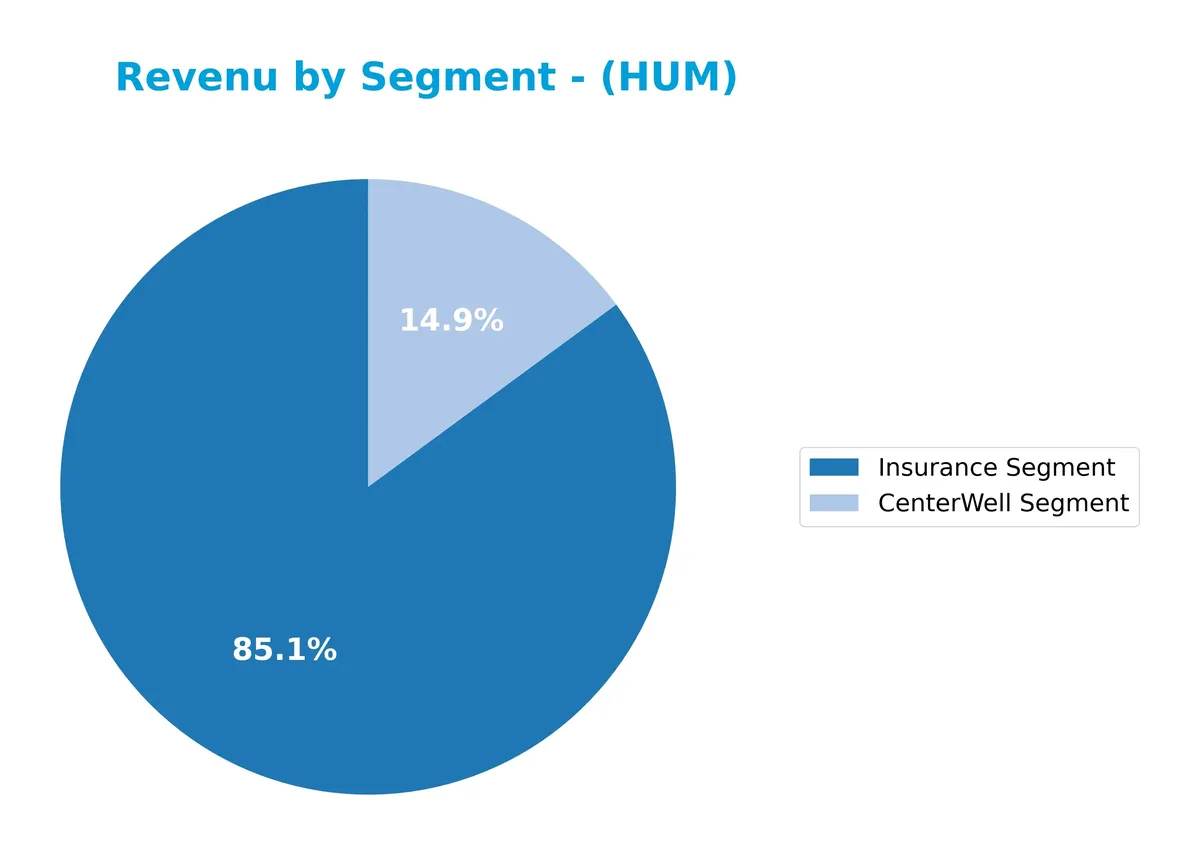
In 2025, the Insurance Segment dominates with $125B in revenue, showing consistent growth from $89B in 2022. The CenterWell Segment, at $22.5B, also expanded notably, up from $17.3B in 2022. This shift indicates a strategic emphasis on insurance services, while healthcare operations maintain a solid secondary role. The growing concentration in Insurance suggests both opportunity and risk tied to regulatory and market changes in this segment.
Key Products & Brands
The following table outlines Humana Inc.’s key products and brands with their respective descriptions:
| Product | Description |
|---|---|
| Retail Segment | Offers medical and supplemental benefit plans to individuals, including commercial fully insured medical and specialty health insurance benefits such as dental and vision. |
| Group and Specialty | Provides medical and specialty health insurance benefits, including contracts with Medicare, Medicaid, and military services like TRICARE. |
| Healthcare Services | Delivers pharmacy solutions, provider services, and home health services to members and third parties. |
| CenterWell Segment | Comprises healthcare services focused on care delivery, including home health and specialty services. |
Humana’s product mix spans insurance and healthcare services, with a strong emphasis on individual and group insurance plans complemented by expanding healthcare service offerings. The company leverages contracts with government programs and commercial clients to diversify revenue streams.
Main Competitors
There are 7 main competitors in the Healthcare sector; below is a table of the top 7 leaders by market capitalization:
| Competitor | Market Cap. |
|---|---|
| UnitedHealth Group Incorporated | 305B |
| CVS Health Corporation | 102B |
| Elevance Health Inc. | 79B |
| Cigna Corporation | 75B |
| Humana Inc. | 32B |
| Centene Corporation | 21B |
| Molina Healthcare, Inc. | 9.7B |
Humana Inc. ranks 5th among its 7 competitors. Its market cap is 7.5% that of UnitedHealth Group, the sector leader. Humana’s market cap is below both the average top 10 competitor cap of 88.8B and the sector median of 74.6B. The company holds a significant 226.6% gap above its nearest competitor, Centene Corporation.
Comparisons with competitors
Check out how we compare the company to its competitors:
Does Humana have a competitive advantage?
Humana does not present a clear competitive advantage, as it consistently destroys value with ROIC below WACC and a neutral ROIC trend. Its profitability remains stable but insufficient to create economic profits.
Looking ahead, Humana’s diverse segments and contracts, including Medicare and Medicaid programs, offer opportunities to expand in specialty health insurance and pharmacy solutions. These areas may provide new avenues for growth in evolving healthcare markets.
SWOT Analysis
This SWOT analysis highlights Humana Inc.’s core strategic factors to guide investment decisions.
Strengths
- Strong market position in Healthcare Plans
- Diverse product segments including retail, group, specialty
- Solid liquidity ratios (current and quick ratio at 2.0)
Weaknesses
- Value destruction indicated by ROIC below WACC
- Declining net margin over recent years
- Moderate debt to equity ratio signaling leverage concerns
Opportunities
- Growth in Medicare and Medicaid programs
- Expansion in specialty and home health services
- Increasing demand for integrated healthcare solutions
Threats
- Regulatory risks in healthcare policies
- Competitive pressure from larger insurers
- Margin compression from rising operating expenses
Humana’s stable market presence and liquidity are offset by persistent profitability challenges. The company must leverage growth opportunities while managing regulatory and operational risks to restore value creation.
Stock Price Action Analysis
The weekly chart illustrates Humana Inc. (HUM) stock performance over the past 12 months, highlighting price fluctuations and key levels:
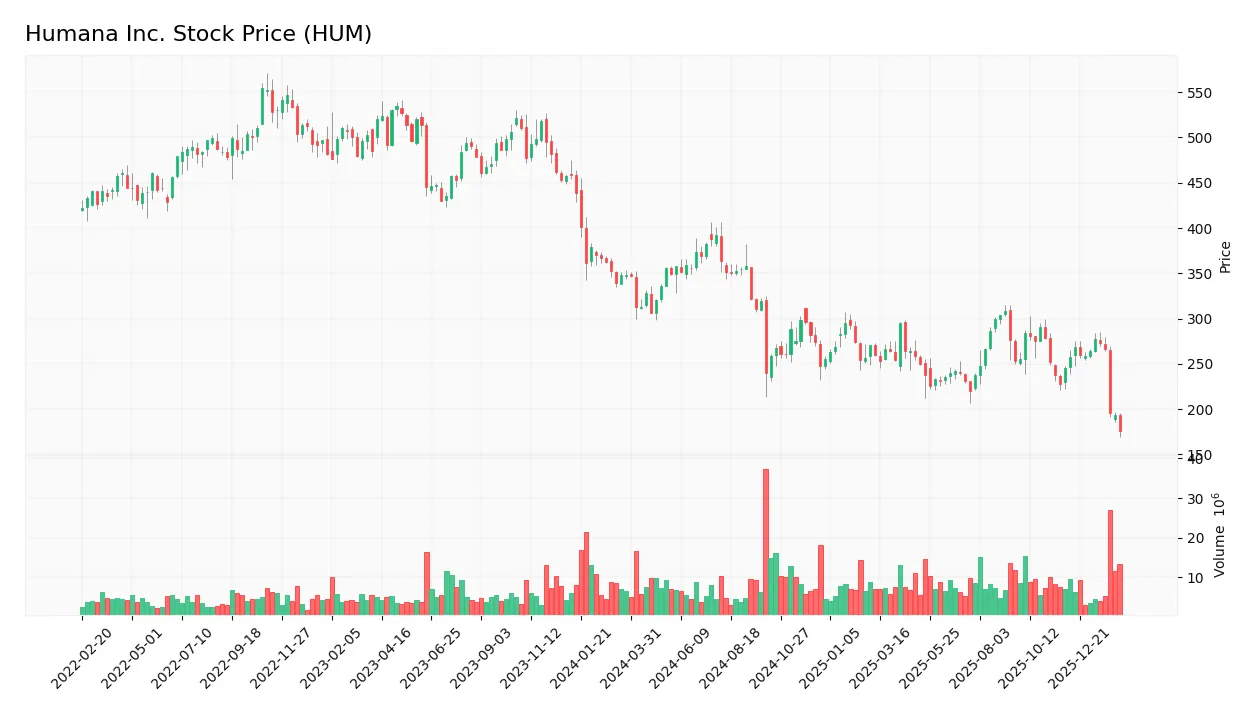
Trend Analysis
Humana’s stock declined by 45.25% over the past year, confirming a bearish trend. The trend shows deceleration despite high volatility (46.65 std deviation). The price peaked at 392.63 and bottomed at 184.1, with no recent acceleration in the downtrend.
Volume Analysis
Trading volume shows an increasing trend with sellers dominating 60.45% overall. Recent three-month data reveals seller dominance at 72.19%, indicating persistent selling pressure and cautious investor sentiment. Buyer volume declined, suggesting reduced market participation on the demand side.
Target Prices
Analysts set a target consensus for Humana Inc. at $235, signaling moderate optimism.
| Target Low | Target High | Consensus |
|---|---|---|
| 146 | 345 | 235 |
The wide range reflects varied market expectations, but the $235 consensus suggests confidence in Humana’s growth potential.

Don’t Let Luck Decide Your Entry Point
Optimize your entry points with our advanced ProRealTime indicators. You’ll get efficient buy signals with precise price targets for maximum performance. Start outperforming now!
Analyst & Consumer Opinions
This section examines the latest analyst ratings and consumer feedback on Humana Inc., highlighting key insights.
Stock Grades
Here are the latest verified analyst grades for Humana Inc., reflecting a mix of opinions from top firms:
| Grading Company | Action | New Grade | Date |
|---|---|---|---|
| Wells Fargo | Maintain | Equal Weight | 2026-02-18 |
| Truist Securities | Maintain | Hold | 2026-02-17 |
| Goldman Sachs | Maintain | Sell | 2026-02-17 |
| TD Cowen | Maintain | Hold | 2026-02-13 |
| Cantor Fitzgerald | Maintain | Neutral | 2026-02-12 |
| Jefferies | Maintain | Buy | 2026-02-12 |
| Guggenheim | Maintain | Buy | 2026-02-12 |
| RBC Capital | Downgrade | Sector Perform | 2026-02-12 |
| UBS | Maintain | Neutral | 2026-02-12 |
| Morgan Stanley | Downgrade | Underweight | 2026-02-02 |
The consensus leans toward a Hold rating with a notable split between Buy and Sell opinions. Recent downgrades highlight some caution among analysts amid mixed sector performance.
Consumer Opinions
Consumers express a mix of appreciation and frustration toward Humana Inc., reflecting its complex service landscape.
| Positive Reviews | Negative Reviews |
|---|---|
| Efficient customer service response. | High premiums compared to competitors. |
| Comprehensive Medicare plans offered. | Confusing claims processing experience. |
| User-friendly digital tools. | Limited in-network providers in some areas. |
Overall, consumers praise Humana’s strong Medicare offerings and digital accessibility. However, high costs and claims complexity remain common pain points, suggesting areas for operational refinement.
Risk Analysis
The following table outlines key risks for Humana Inc., detailing their likelihood and potential impact on the company:
| Category | Description | Probability | Impact |
|---|---|---|---|
| Profitability Risk | Low net margin (0.92%) signals pressure on earnings amid rising healthcare costs | High | High |
| Valuation Risk | Elevated P/E ratio (25.97) suggests shares may be overvalued relative to sector norms | Medium | Medium |
| Leverage Risk | Debt-to-equity score is very unfavorable, indicating potential financial strain | Medium | High |
| Operational Risk | Moderate Piotroski score (6) reflects average financial health, signaling some underlying issues | Medium | Medium |
| Market Volatility | Low beta (0.44) reduces market risk but limits upside during bullish cycles | Low | Low |
Humana’s most pressing risks stem from its weak profitability and high leverage, which could impair capital allocation amid healthcare inflation. Despite a safe Altman Z-Score (4.47), the elevated P/E and moderate operational scores warrant caution. Recent sector trends show increasing regulation and reimbursement uncertainty, amplifying these risks.
Should You Buy Humana Inc.?
Humana Inc. appears to be a firm with stable but value-destroying profitability and an unfavorable competitive moat. While its leverage profile signals risk, the overall rating of B suggests moderate operational efficiency and cautious value creation potential.
Strength & Efficiency Pillars
Humana Inc. operates with a solid financial foundation, evidenced by a safe zone Altman Z-Score of 4.47, signaling strong solvency. The company maintains moderate profitability, with a net margin at 0.92% and return on equity of 6.73%. Its weighted average cost of capital (WACC) stands at a favorable 5.14%, yet the return on invested capital (ROIC) lags at 3.69%, indicating the company is currently shedding value rather than creating it. Operational efficiency is supported by strong asset turnover metrics, including a fixed asset turnover of 58.12.
Weaknesses and Drawbacks
Despite its solvency strength, Humana faces several notable challenges. The price-to-earnings ratio of 25.97 suggests a premium valuation that may limit upside potential. Leverage indicators are neutral to slightly unfavorable, with a debt-to-equity ratio of 0.7 and interest coverage at 3.3, which could constrain financial flexibility in adverse conditions. Market pressure intensifies as sellers dominate recent trading activity with only 27.8% buyer volume, exerting short-term downward pressure and increasing volatility risk.
Our Final Verdict about Humana Inc.
Humana’s fundamental profile is mixed. The company benefits from strong solvency and operational efficiency but struggles to generate returns above its cost of capital. Despite long-term safety, the bearish trend and seller dominance in recent months imply a cautious stance. This profile might appear suitable for investors prioritizing stability but suggests waiting for clearer market signals before committing significant capital.
Disclaimer: This content is for informational purposes only and does not constitute financial, investment, or other professional advice. Investing in financial markets involves a significant risk of loss, and past performance is not indicative of future results.
Additional Resources
- Humana Inc. (NYSE:HUM) Q4 2025 earnings call transcript – MSN (Feb 17, 2026)
- Humana Inc. (NYSE:HUM) to Issue $0.89 Quarterly Dividend – MarketBeat (Feb 19, 2026)
- Humana will pay shareholders $0.885 per share this April – Stock Titan (Feb 19, 2026)
- Humana Board Declares Payment of Quarterly Dividend to Stockholders – Business Wire (Feb 19, 2026)
- Decoding Humana Inc (HUM): A Strategic SWOT Insight – GuruFocus (Feb 20, 2026)
For more information about Humana Inc., please visit the official website: humana.com