Home > Analyses > Industrials > Hubbell Incorporated
Hubbell Incorporated powers critical infrastructure that keeps industries and communities connected. Its electrical and utility solutions shape the backbone of commercial, industrial, and utility operations worldwide. Renowned for durable products and cutting-edge innovation, Hubbell commands respect across electrical equipment markets. As the energy transition and digitalization accelerate, I question whether Hubbell’s robust fundamentals can sustain its premium valuation and drive future growth in an evolving landscape.

Table of contents
Business Model & Company Overview
Hubbell Incorporated, founded in 1888 and headquartered in Shelton, Connecticut, holds a dominant position in the Electrical Equipment & Parts industry. It operates through a cohesive ecosystem of Electrical and Utility Solutions, supplying a broad range of electrical and electronic products tailored for industrial, commercial, and utility markets. Its extensive brand portfolio supports diverse applications, from wiring devices to smart meters, serving contractors, utilities, and OEMs worldwide.
The company’s revenue engine balances hardware manufacturing with integrated communication and control systems, generating steady income across its two main segments. Hubbell’s strategic footprint spans the Americas, Europe, and Asia, leveraging distributor networks and direct sales channels. Its economic moat lies in its robust product diversity and entrenched customer relationships, positioning it as a key architect in the evolving electrical infrastructure landscape.
Financial Performance & Fundamental Metrics
I analyze Hubbell Incorporated’s income statement, key financial ratios, and dividend payout policy to assess its core profitability and shareholder value creation.
Income Statement
The table below summarizes Hubbell Incorporated’s key income statement metrics over the past five fiscal years, reflecting operational performance and profitability trends.

| 2021 | 2022 | 2023 | 2024 | 2025 | |
|---|---|---|---|---|---|
| Revenue | 4.19B | 4.95B | 5.37B | 5.63B | 5.84B |
| Cost of Revenue | 3.04B | 3.48B | 3.48B | 3.72B | 3.77B |
| Operating Expenses | 619M | 763M | 850M | 813M | 855M |
| Gross Profit | 1.15B | 1.47B | 1.89B | 1.90B | 2.07B |
| EBITDA | 663M | 855M | 1.17B | 1.29B | 1.34B |
| EBIT | 514M | 707M | 1.02B | 1.08B | 1.20B |
| Interest Expense | 55M | 50M | 37M | 74M | 64M |
| Net Income | 400M | 546M | 760M | 778M | 887M |
| EPS | 7.34 | 9.49 | 14.14 | 14.46 | 16.63 |
| Filing Date | 2022-02-11 | 2023-02-09 | 2024-02-08 | 2025-02-13 | 2026-02-12 |
Income Statement Evolution
Hubbell’s revenue grew steadily, rising 39.35% from 2021 to 2025, with a 3.84% increase in the latest year. Net income surged 122.05% over the period. Margins improved consistently; gross margin reached 35.46% and net margin 15.18% in 2025, reflecting enhanced profitability and operational efficiency.
Is the Income Statement Favorable?
In 2025, Hubbell reported $5.84B revenue and $886M net income, with a net margin of 15.18%, signaling strong earnings quality. EBIT margin at 20.52% indicates effective cost control despite a slight rise in operating expenses. Interest expense remains low at 1.1% of revenue. Overall, fundamentals show favorable trends with solid margin expansion and profit growth.
Financial Ratios
The table below presents key financial ratios for Hubbell Incorporated (HUBB) over the past five fiscal years, reflecting profitability, liquidity, valuation, leverage, and efficiency:
| Ratios | 2021 | 2022 | 2023 | 2024 | 2025 |
|---|---|---|---|---|---|
| Net Margin | 9.5% | 11.0% | 14.1% | 13.8% | 15.2% |
| ROE | 17.9% | 23.1% | 26.4% | 23.8% | 23.1% |
| ROIC | 10.1% | 12.8% | 14.1% | 15.3% | 13.8% |
| P/E | 28.3 | 23.1 | 23.2 | 29.1 | 26.6 |
| P/B | 5.1 | 5.3 | 6.1 | 6.9 | 6.1 |
| Current Ratio | 1.76 | 1.86 | 1.64 | 1.64 | 1.72 |
| Quick Ratio | 1.14 | 1.18 | 1.01 | 0.98 | 1.00 |
| D/E | 0.69 | 0.66 | 0.80 | 0.53 | 0.60 |
| Debt-to-Assets | 29.0% | 28.8% | 33.1% | 25.7% | 28.3% |
| Interest Coverage | 9.7 | 14.3 | 28.3 | 14.8 | 19.0 |
| Asset Turnover | 0.79 | 0.92 | 0.78 | 0.84 | 0.71 |
| Fixed Asset Turnover | 9.1 | 9.4 | 8.2 | 7.7 | 6.9 |
| Dividend Yield | 1.9% | 1.8% | 1.4% | 1.2% | 1.2% |
Evolution of Financial Ratios
Hubbell’s Return on Equity (ROE) improved steadily from 17.9% in 2021 to 23.1% in 2025, signaling rising profitability. The Current Ratio remained stable around 1.6-1.8, indicating consistent liquidity. Debt-to-Equity Ratio fluctuated mildly, ending at 0.60 in 2025, suggesting moderate leverage management without significant risk escalation.
Are the Financial Ratios Fovorable?
In 2025, Hubbell posted favorable profitability ratios with a 15.2% net margin and ROE exceeding 23%. Liquidity measures, including a 1.72 Current Ratio and 1.0 Quick Ratio, are solid. Leverage is moderate with a 0.60 Debt-to-Equity ratio. However, valuation metrics such as a 26.65 P/E and 6.14 P/B ratios appear stretched. Overall, the financial ratios lean favorable, balanced by some valuation caution.
Shareholder Return Policy
Hubbell Incorporated maintains a consistent dividend payout ratio near 32%, with dividends per share rising from $4.00 in 2021 to $5.38 in 2025. The annual dividend yield hovers around 1.2%, supported by free cash flow coverage and moderate share buyback activity.
This balanced distribution strategy aligns with sustainable long-term value creation by avoiding excessive payouts or repurchases. The company’s prudent dividend growth and cash flow support mitigate risks associated with over-distribution in a capital-intensive sector.
Score analysis
The following radar chart presents a comprehensive view of Hubbell Incorporated’s key financial scores:
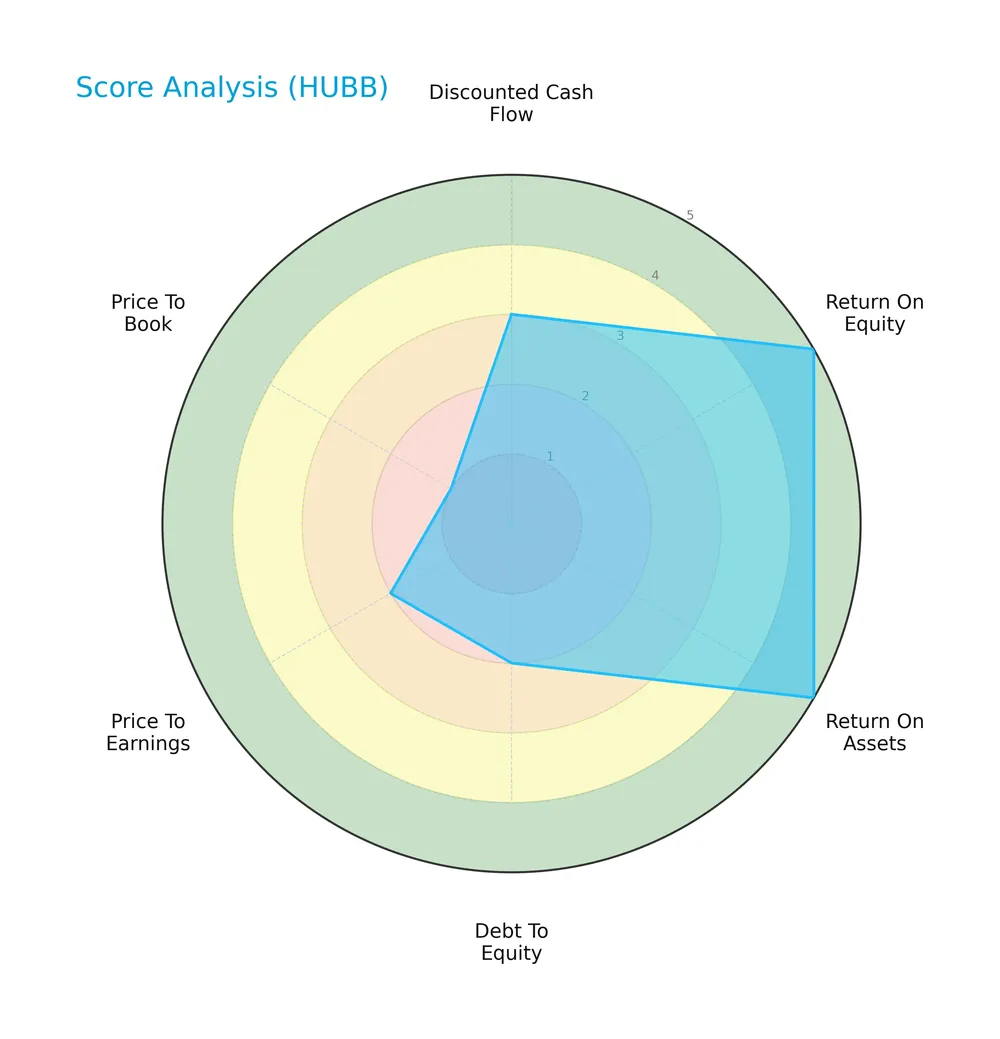
Hubbell shows strong profitability with top scores in ROE and ROA at 5 each. However, leverage and valuation metrics lag, with debt-to-equity, P/E, and P/B scores falling below average. The overall score stands at a moderate 3.
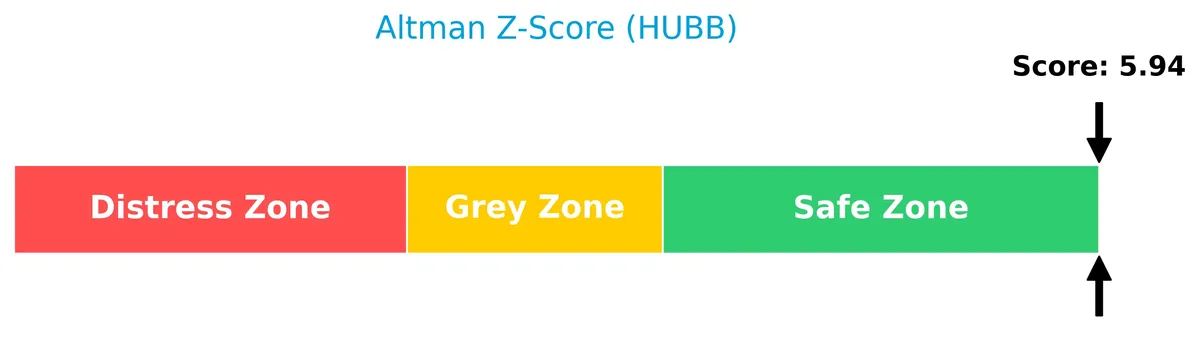
Analysis of the company’s bankruptcy risk
Hubbell’s Altman Z-Score firmly places it in the safe zone, indicating a low risk of bankruptcy and strong financial stability:
Is the company in good financial health?
The Piotroski Score diagram illustrates Hubbell’s solid financial fundamentals and operational efficiency:
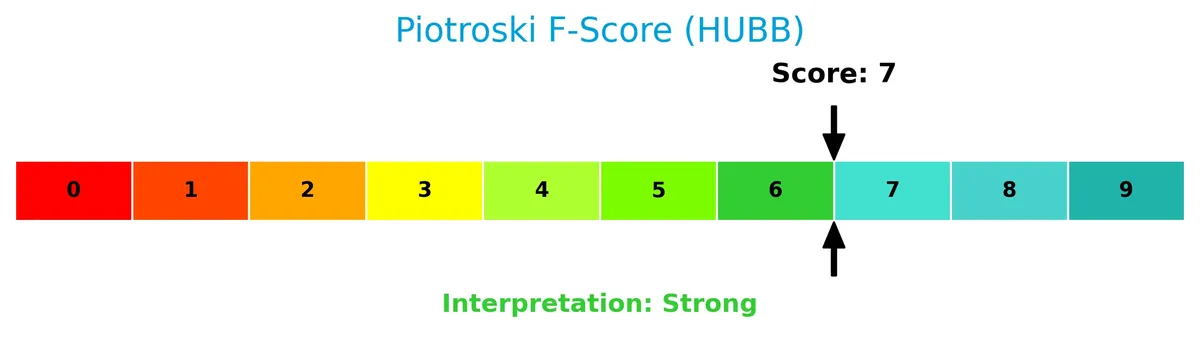
With a score of 7, Hubbell demonstrates strong financial health, signaling effective profitability, liquidity, and capital management practices.
Competitive Landscape & Sector Positioning
This analysis covers Hubbell Incorporated’s strategic positioning, revenue segments, key products, main competitors, and competitive advantages. I will evaluate whether Hubbell maintains a competitive edge within the electrical equipment sector.
Strategic Positioning
Hubbell Incorporated operates with a diversified product portfolio across two segments: Electrical Solutions and Utility Solutions, generating $2.17B and $3.67B respectively in 2025. The company’s geographic exposure is concentrated in the US, which accounts for the majority of its $5.0B+ revenue, with a smaller non-US presence of $433M.
Revenue by Segment
This pie chart illustrates Hubbell Incorporated’s revenue distribution by segment for the fiscal year 2025, highlighting the relative contribution of each business line.
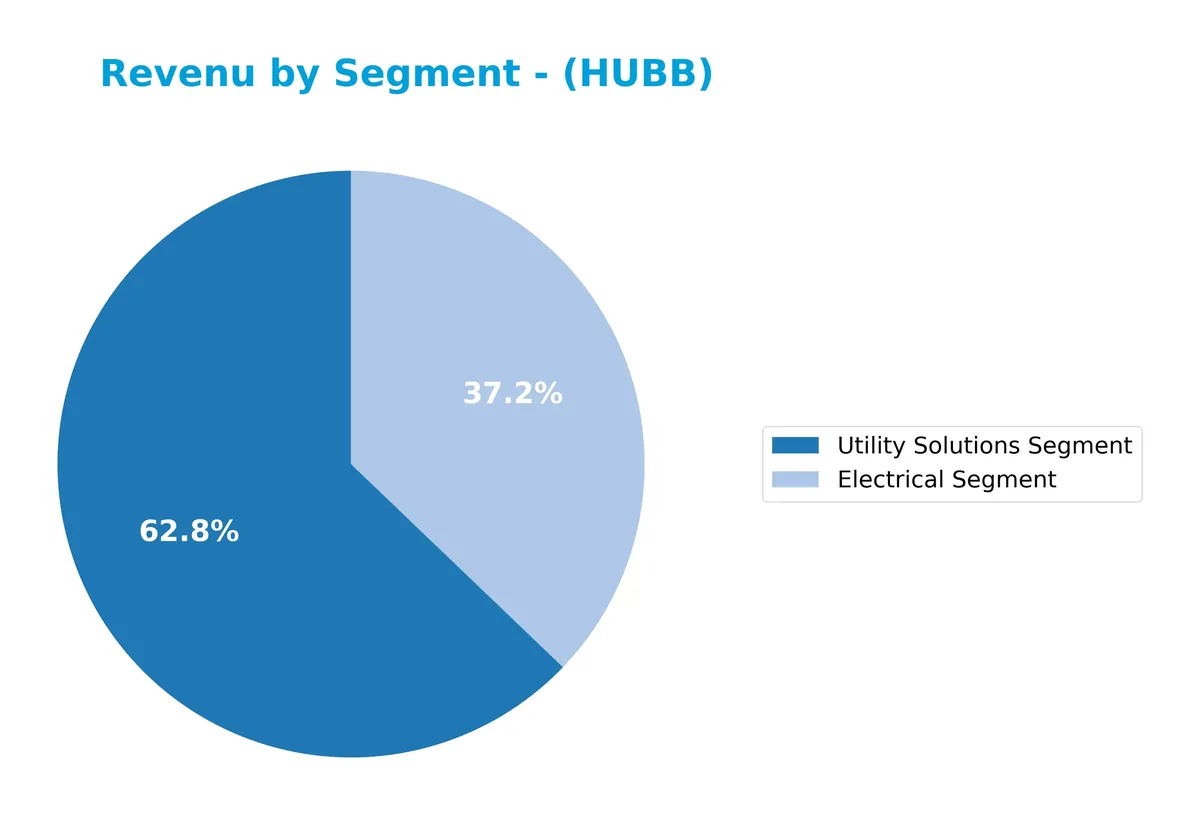
In 2025, Utility Solutions leads with $3.67B, surpassing Electrical at $2.17B. Utility Solutions shows strong acceleration since 2020, nearly doubling revenue and becoming the primary growth engine. Electrical revenue displays moderate growth but lacks the momentum of Utility Solutions. The business concentration risk leans towards Utility Solutions, which now dominates Hubbell’s segment mix. This shift reflects strategic focus and market demand evolution.
Key Products & Brands
Hubbell Incorporated’s portfolio includes electrical and utility products serving industrial and utility markets:
| Product | Description |
|---|---|
| Electrical Solution | Wiring devices, rough-in electrical products, connectors, lighting fixtures, industrial controls, and communication systems for industrial, commercial, and institutional use. |
| Utility Solution | Distribution, transmission, substation, and telecommunications products including arresters, insulators, connectors, smart meters, and protection devices. |
| Brand Portfolio | Includes Hubbell, Kellems, Bryant, Burndy, CMC, Bell, TayMac, Wiegmann, Killark, Hawke, Aclara, Fargo, Quazite, Hot Box. |
Hubbell’s two main segments address distinct markets. Electrical Solutions focus on wiring and industrial controls. Utility Solutions deliver infrastructure and communications products for utilities and telecom. Its broad brand base supports diverse customer needs across sectors.
Main Competitors
This sector includes 89 competitors; below are the top 10 leaders by market capitalization:
| Competitor | Market Cap. |
|---|---|
| GE Aerospace | 338B |
| Caterpillar Inc. | 280B |
| RTX Corporation | 251B |
| The Boeing Company | 171B |
| Union Pacific Corporation | 138B |
| Eaton Corporation plc | 127B |
| Deere & Company | 126B |
| Honeywell International Inc. | 124B |
| Lockheed Martin Corporation | 116B |
| Parker-Hannifin Corporation | 114B |
Hubbell Incorporated ranks 55th among 89 competitors, with a market cap about 8.1% of the leader GE Aerospace. The company sits below both the average top 10 market cap of 179B and the sector median of 36B. Its market cap is approximately 3.38% below the next closest competitor above.
Comparisons with competitors
Check out how we compare the company to its competitors:
Aucun article trouvé pour ces critères.
Does HUBB have a competitive advantage?
Hubbell Incorporated demonstrates a sustainable competitive advantage, evidenced by a very favorable moat status. Its return on invested capital (ROIC) exceeds the weighted average cost of capital (WACC) by 5.85%, indicating consistent value creation.
Looking ahead, HUBB’s diversified product portfolio and presence in both Electrical and Utility Solutions segments position it well for growth. Expansion into new markets and ongoing innovation in smart meters and communication systems offer promising opportunities.
SWOT Analysis
This analysis highlights Hubbell Incorporated’s key strategic factors affecting its market position and growth potential.
Strengths
- Strong ROIC well above WACC
- Diverse product portfolio across electrical and utility segments
- Consistent revenue and net income growth over 5 years
Weaknesses
- High P/B ratio signals potential overvaluation
- Moderate debt-to-equity ratio may limit financial flexibility
- Limited international revenue diversification
Opportunities
- Expansion in smart grid and utility infrastructure markets
- Growing demand for industrial automation solutions
- Increasing adoption of energy-efficient electrical products
Threats
- Intense competition in electrical equipment sector
- Supply chain disruptions impacting production costs
- Economic downturns reducing capital expenditures by utilities and industries
Hubbell’s robust profitability and growing competitive advantage set a solid foundation. However, valuation concerns and moderate leverage require cautious capital allocation. Strategic focus on innovation and market expansion can offset competitive and macroeconomic risks.
Stock Price Action Analysis
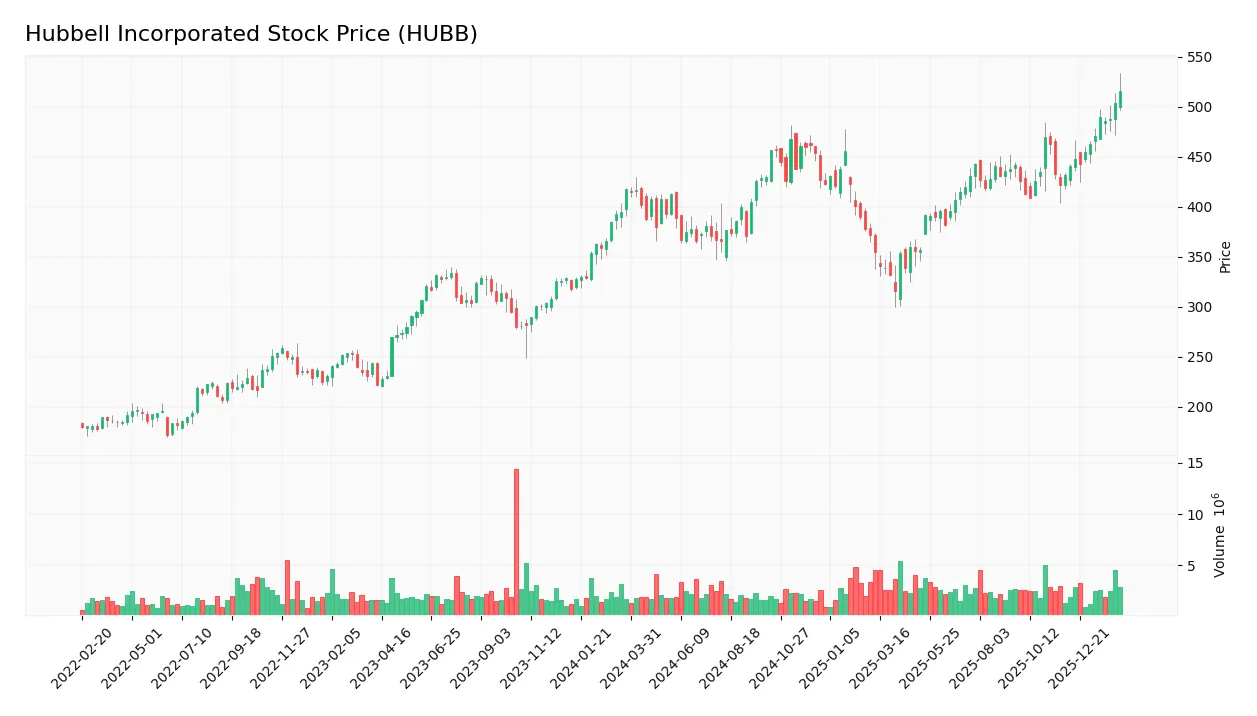
The weekly stock chart of Hubbell Incorporated (HUBB) highlights price movements and key levels over the past 100 weeks:
Trend Analysis
Over the past 100 weeks, HUBB’s price rose 23.47%, confirming a bullish trend with accelerating momentum. The stock’s highest point reached 516.02, and the lowest was 315.94, reflecting significant volatility with a 39.82 standard deviation. Recent months show a 19.61% gain and a positive slope of 7.36.
Volume Analysis
Trading volume for HUBB is increasing, with total volume at 294M shares. Buyers represent 52.48% of activity overall, shifting to a strongly buyer-dominant 81.76% in the recent period. This surge in buying suggests rising investor confidence and heightened market participation.
Target Prices
Analysts set a robust target consensus for Hubbell Incorporated, signaling confidence in its growth potential.
| Target Low | Target High | Consensus |
|---|---|---|
| 450 | 575 | 526.38 |
The target range from 450 to 575 reflects strong upside expectations, with a consensus price of 526.38 indicating solid market confidence.

Don’t Let Luck Decide Your Entry Point
Optimize your entry points with our advanced ProRealTime indicators. You’ll get efficient buy signals with precise price targets for maximum performance. Start outperforming now!
Analyst & Consumer Opinions
This section reviews recent analyst ratings and consumer feedback to provide a comprehensive view of Hubbell Incorporated.
Stock Grades
Here are the latest verified grades from major financial institutions for Hubbell Incorporated:
| Grading Company | Action | New Grade | Date |
|---|---|---|---|
| Wells Fargo | Maintain | Overweight | 2026-02-04 |
| Barclays | Maintain | Equal Weight | 2026-02-04 |
| Evercore ISI Group | Maintain | Outperform | 2026-02-04 |
| JP Morgan | Maintain | Neutral | 2026-02-04 |
| Mizuho | Maintain | Outperform | 2026-01-05 |
The grades show consistency with no recent changes, reflecting a balanced view between overweight, outperform, and equal weight ratings. The consensus remains cautious, with a hold consensus prevailing among analysts.
Consumer Opinions
Consumers of Hubbell Incorporated express a mix of appreciation and concern, reflecting the company’s solid reputation and areas for improvement.
| Positive Reviews | Negative Reviews |
|---|---|
| Durable products that withstand harsh conditions | Some customers report delayed shipping times |
| Excellent customer service and support | Pricing perceived as higher than competitors |
| Wide range of innovative electrical solutions | Occasional quality control issues noted |
Overall, consumers praise Hubbell’s product durability and customer service. However, recurring complaints about shipping delays and pricing suggest areas where operational efficiency and value perception could improve.
Risk Analysis
Below is a summary table outlining key risks affecting Hubbell Incorporated’s investment profile:
| Category | Description | Probability | Impact |
|---|---|---|---|
| Valuation Risk | Elevated P/E of 26.65 and P/B of 6.14 suggest overvaluation relative to industry benchmarks. | Medium | High |
| Debt Risk | Debt-to-equity ratio at 0.6 reflects moderate leverage; interest coverage of 18.7 reduces concern. | Low | Medium |
| Market Volatility | Beta near 1.0 indicates stock moves in line with market fluctuations, exposing it to general risk. | Medium | Medium |
| Industry Cyclicality | Electrical Equipment demand depends on industrial activity, vulnerable to economic downturns. | Medium | High |
| Liquidity Risk | Current ratio of 1.72 and quick ratio of 1.0 confirm solid short-term liquidity position. | Low | Low |
Valuation risk stands out as the most significant. Hubbell trades at a premium, which may pressure returns if market sentiment shifts or earnings disappoint. Industry cyclicality also poses notable impact, given sensitivity to economic cycles. Strong liquidity and interest coverage mitigate immediate financial distress risks. I advise cautious monitoring of market conditions and valuation trends.
Should You Buy Hubbell Incorporated?
Hubbell Incorporated appears to be a robustly profitable company with a durable moat, supported by growing ROIC well above WACC, indicating strong value creation. Despite a manageable but cautious leverage profile, its overall B+ rating suggests a very favorable financial health profile.
Strength & Efficiency Pillars
Hubbell Incorporated exhibits solid profitability, with a net margin of 15.18% and a return on equity of 23.05%. Its return on invested capital (ROIC) stands at 13.84%, well above the weighted average cost of capital (WACC) of 7.99%, confirming that the company is a clear value creator. I observe a growing ROIC trend of 36.9%, indicating improving capital efficiency. These metrics reflect a sustainable competitive advantage and operational strength, supported by favorable gross (35.46%) and EBIT margins (20.52%).
Weaknesses and Drawbacks
Hubbell’s valuation metrics raise caution. The price-to-earnings ratio sits at 26.65, signaling a premium valuation, while the price-to-book ratio is elevated at 6.14, a very unfavorable signal compared to sector norms. Although leverage is moderate with a debt-to-equity ratio of 0.6, the company’s current ratio of 1.72 is favorable but warrants monitoring amid any liquidity shifts. Despite a safe Altman Z-Score of 5.94, these valuation multiples suggest a market premium that may limit upside and increase downside risk if growth slows.
Our Final Verdict about Hubbell Incorporated
Hubbell’s strong profitability and value-creation capacity underpin a fundamentally solid profile. The stock’s bullish price trend (+23.47%) and recent strong buyer dominance (81.76%) support positive momentum. However, the premium valuation metrics advise prudence. Despite long-term strength, the elevated multiples might suggest a wait-and-see approach for a better entry point. Overall, Hubbell could appeal to investors seeking quality but may appear expensive relative to growth prospects.
Disclaimer: This content is for informational purposes only and does not constitute financial, investment, or other professional advice. Investing in financial markets involves a significant risk of loss, and past performance is not indicative of future results.
Additional Resources
- Hear Hubbell’s CEO and CFO live at Barclays investor event – Stock Titan (Feb 12, 2026)
- Hubbell Inc $HUBB Position Decreased by Impax Asset Management Group plc – MarketBeat (Feb 11, 2026)
- Hubbell Incorporated (HUBB): A Bull Case Theory – Yahoo Finance (Feb 04, 2026)
- Insider Sell Alert: DEL NERO JONATHAN M. Sells Shares of Hubbell Inc (HUBB) – GuruFocus (Feb 12, 2026)
- The Top 5 Analyst Questions From Hubbell’s Q4 Earnings Call – Finviz (Feb 10, 2026)
For more information about Hubbell Incorporated, please visit the official website: hubbell.com