Home > Analyses > Technology > HP Inc.
HP Inc. powers the devices and printers that connect millions of people and businesses daily, shaping how we work and create. As a key player in the computer hardware industry, HP is renowned for its innovative personal systems and printing solutions, serving diverse sectors from education to enterprise. With a strong legacy and continuous technological advancements, the question remains: does HP’s current market valuation reflect its growth potential and solid fundamentals in an evolving tech landscape?

Table of contents
Business Model & Company Overview
HP Inc., founded in 1939 and headquartered in Palo Alto, California, stands as a leader in the computer hardware industry. Its ecosystem integrates personal computing devices, imaging and printing products, and related technologies, forming a cohesive portfolio that serves diverse markets from individual consumers to large enterprises. The company’s evolution reflects a commitment to innovation, blending hardware with software and services under one roof to meet modern demands.
The company’s revenue engine balances sales across its Personal Systems and Printing segments, supplemented by corporate investments in R&D and incubation projects. HP maintains a strategic footprint across the Americas, Europe, and Asia, supporting a broad customer base including government, health, and education sectors. Its robust competitive advantage lies in its integrated solutions and global reach, underpinning a durable economic moat that shapes the future of technology hardware.
Financial Performance & Fundamental Metrics
In this section, I analyze HP Inc.’s income statement, key financial ratios, and dividend payout policy to assess its overall financial health and performance.
Income Statement
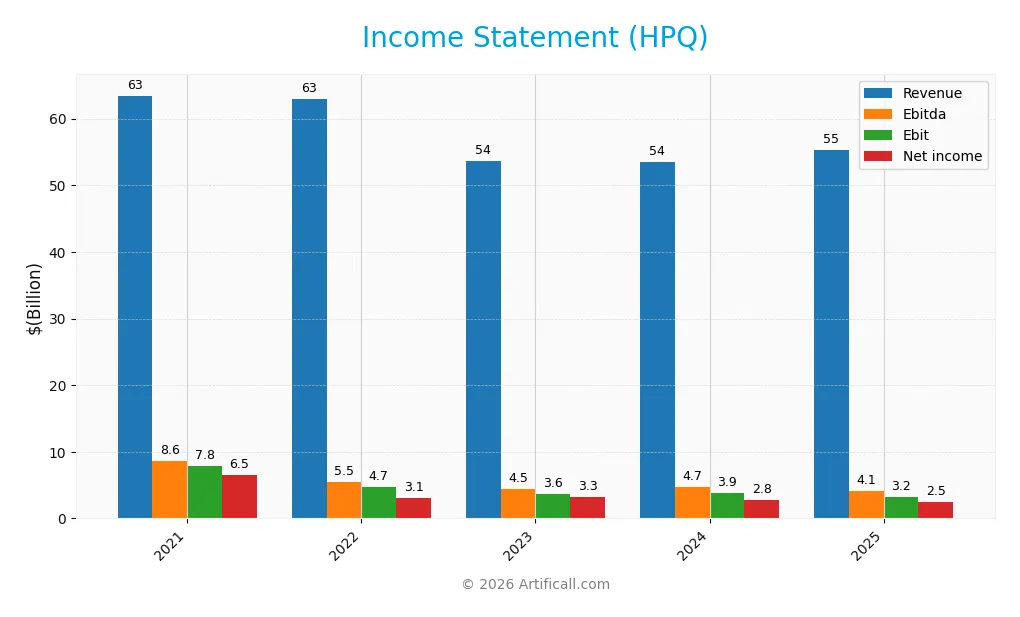
The table below presents HP Inc.’s key income statement figures over the past five fiscal years, highlighting revenue, expenses, profitability, and earnings per share.
| 2021 | 2022 | 2023 | 2024 | 2025 | |
|---|---|---|---|---|---|
| Revenue | 63.5B | 62.9B | 53.7B | 53.6B | 55.3B |
| Cost of Revenue | 50.1B | 50.6B | 42.2B | 41.7B | 44.2B |
| Operating Expenses | 8.0B | 7.7B | 8.1B | 8.0B | 7.4B |
| Gross Profit | 13.4B | 12.3B | 11.5B | 11.8B | 11.0B |
| EBITDA | 8.6B | 5.5B | 4.5B | 4.7B | 4.1B |
| EBIT | 7.8B | 4.7B | 3.6B | 3.9B | 3.2B |
| Interest Expense | 254M | 359M | 684M | 607M | 506M |
| Net Income | 6.5B | 3.1B | 3.3B | 2.8B | 2.5B |
| EPS | 5.41 | 3.02 | 3.29 | 2.83 | 2.67 |
| Filing Date | 2021-12-09 | 2023-09-11 | 2023-12-18 | 2024-12-13 | 2025-12-10 |
Income Statement Evolution
From 2021 to 2025, HP Inc.’s revenue declined by 12.87% overall, with a modest 3.24% increase in the latest year. Net income fell sharply by 61.34% over the period, and the net margin contracted by 55.63%. Gross profit decreased by 6.52% in the most recent year, while EBIT dropped 18.32%, reflecting pressure on profitability. Margins generally remained neutral, with gross and EBIT margins stable but showing no improvement.
Is the Income Statement Favorable?
The 2025 income statement reveals neutral fundamentals overall, with a gross margin near 20% and an EBIT margin of 5.74%. Interest expense is relatively favorable at 0.92% of revenue, supporting financial costs. However, net margin declined 11.73% year-on-year to 4.57%, and EPS dropped 5.69%, indicating challenges in converting sales growth into profits. The overall assessment of the 2025 results leans toward unfavorable, reflecting diminished profitability despite stable operational efficiency.
Financial Ratios
The following table summarizes key financial ratios for HP Inc. over the last five fiscal years, providing a snapshot of profitability, valuation, liquidity, leverage, and efficiency:
| Ratios | 2021 | 2022 | 2023 | 2024 | 2025 |
|---|---|---|---|---|---|
| Net Margin | 10.31% | 4.98% | 6.07% | 5.18% | 4.57% |
| ROE | -3.98% | -1.04% | -3.05% | -2.10% | -7.31% |
| ROIC | 42.24% | 25.54% | 26.23% | 24.72% | 24.97% |
| P/E | 5.77 | 9.15 | 8.00 | 12.53 | 10.35 |
| P/B | -22.96 | -9.48 | -24.43 | -26.28 | -75.65 |
| Current Ratio | 0.76 | 0.75 | 0.73 | 0.72 | 0.77 |
| Quick Ratio | 0.49 | 0.46 | 0.45 | 0.45 | 0.48 |
| D/E | -5.34 | -4.06 | -10.05 | -8.24 | -31.45 |
| Debt-to-Assets | 22.74% | 31.94% | 29.02% | 27.31% | 26.05% |
| Interest Coverage | 21.10 | 12.70 | 5.05 | 6.29 | 7.16 |
| Asset Turnover | 1.64 | 1.63 | 1.45 | 1.34 | 1.32 |
| Fixed Asset Turnover | 16.98 | 15.69 | 13.38 | 13.13 | 13.23 |
| Dividend Yield | 2.48% | 3.62% | 3.97% | 3.09% | 4.16% |
Evolution of Financial Ratios
Over the years, HP Inc.’s Return on Equity (ROE) declined sharply, reaching a deeply negative -730.92% in 2025, signaling significant profitability challenges. The Current Ratio remained below 1, indicating ongoing liquidity constraints, though it showed slight improvement to 0.77 in 2025. The Debt-to-Equity ratio fluctuated negatively but was marked favorable in 2025, reflecting an unusual capital structure. Profitability margins generally decreased, with net profit margin dropping to 4.57%.
Are the Financial Ratios Favorable?
In 2025, HP Inc.’s financial ratios present a mixed picture. Profitability indicators such as net margin and ROE are unfavorable, while return on invested capital (24.97%) and interest coverage (6.27) are favorable, suggesting operational efficiency and manageable debt costs. Liquidity ratios like current (0.77) and quick (0.48) are unfavorable, indicating potential short-term financial pressure. Leverage metrics, including debt-to-assets (26.05%) and debt-to-equity (-31.45), are favorable, supported by strong asset turnover (1.32) and fixed asset turnover (13.23). The dividend yield at 4.16% is also positive. Overall, about 71% of ratios are favorable, underpinning a generally positive evaluation despite some weaknesses.
Shareholder Return Policy
HP Inc. maintains a consistent dividend policy, with a payout ratio around 40-43% in recent years and a dividend yield near 4.1% in 2025. Dividend payments are well covered by free cash flow, supported by steady operating cash flow and manageable capital expenditures. The company also conducts share buybacks, complementing its dividend distribution.
This balanced approach suggests a sustainable return strategy that aligns with preserving long-term shareholder value. Coverage ratios indicate dividends and buybacks are maintained without excessive strain on cash flow, reducing risk of unsustainable distributions or overleveraging.
Score analysis
The following radar chart presents an overview of HP Inc.’s key financial scores across multiple valuation and performance metrics:
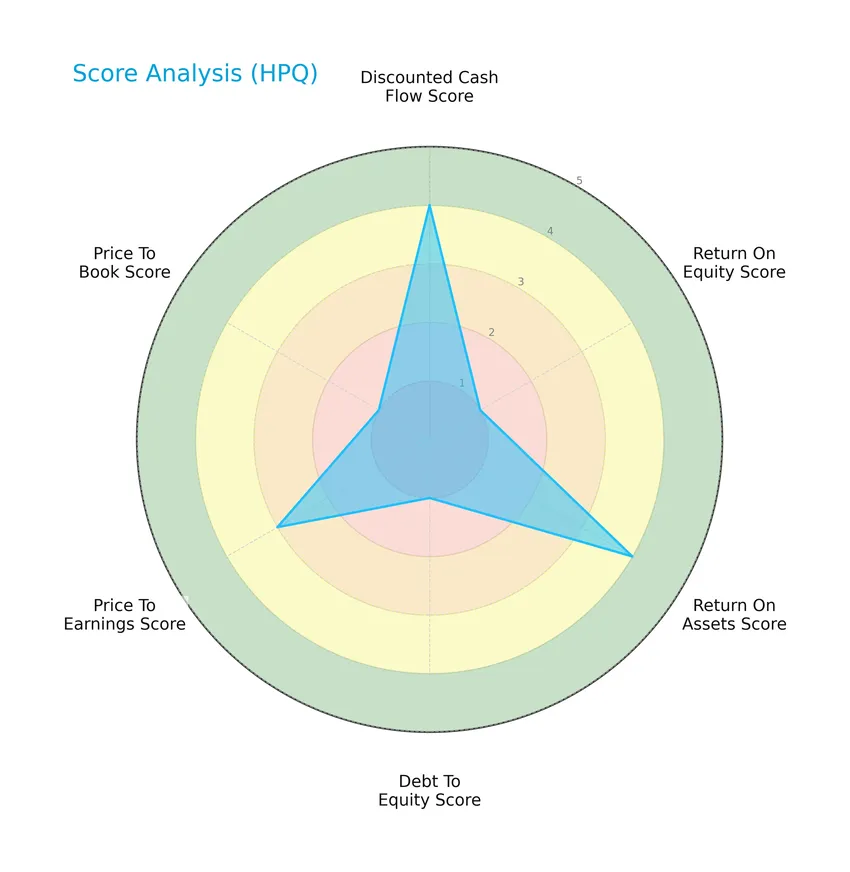
HP Inc. shows a mixed financial profile with favorable scores in discounted cash flow (4) and return on assets (4), but very unfavorable marks in return on equity (1), debt to equity (1), and price to book (1). Price to earnings is moderate at 3, reflecting some valuation balance.
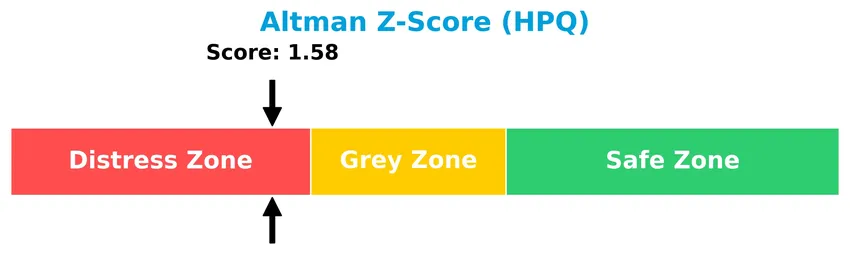
Analysis of the company’s bankruptcy risk
HP Inc.’s Altman Z-Score indicates it is currently in the distress zone, suggesting a higher likelihood of financial distress and potential bankruptcy risk:
Is the company in good financial health?
The Piotroski Score diagram provides insight into HP Inc.’s overall financial health based on profitability, leverage, and efficiency metrics:
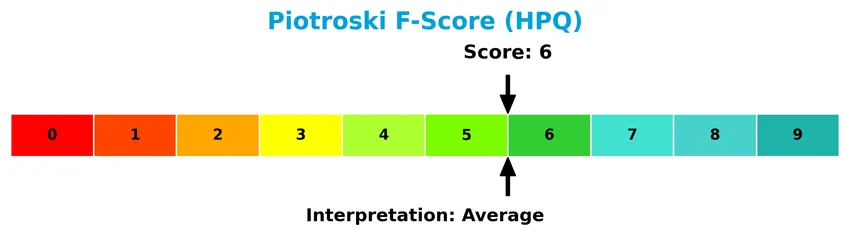
With a Piotroski Score of 6, HP Inc. is considered to have average financial health, indicating moderate strength but room for improvement in fundamental financial indicators.
Competitive Landscape & Sector Positioning
This sector analysis will examine HP Inc.’s strategic positioning, revenue by segment, key products, main competitors, and competitive advantages. I will assess whether HP Inc. holds a competitive advantage over its industry peers.
Strategic Positioning
HP Inc. maintains a diversified product portfolio focused on Personal Systems ($38.5B) and Printing ($16.7B) segments, complemented by Corporate Investments. Geographically, it operates globally with significant revenue from Americas ($23.5B), EMEA ($18.6B), and Asia Pacific ($13.2B), reflecting broad international exposure.
Revenue by Segment
This pie chart illustrates HP Inc.’s revenue distribution by segment for the fiscal year 2025, highlighting contributions from key business areas.
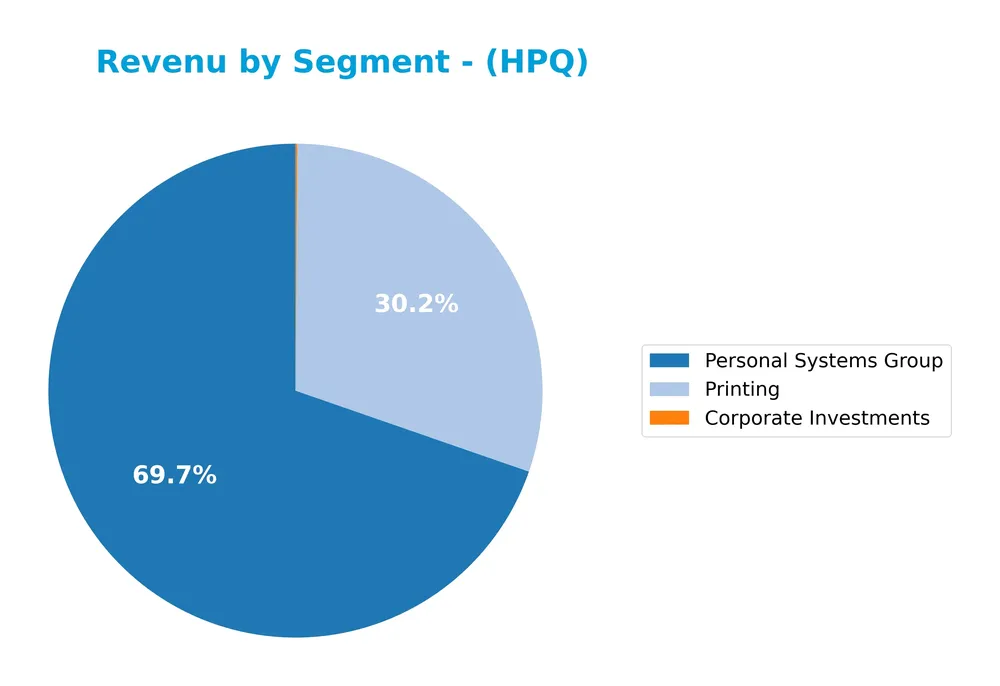
In 2025, HP’s revenue is primarily driven by the Personal Systems Group at $38.5B, followed by Printing at $16.7B, with Corporate Investments contributing a smaller $62M. Over recent years, Personal Systems shows a slight rebound after declines from 2021, while Printing revenue has gradually decreased. This shift indicates a growing reliance on personal systems, suggesting increased focus but also potential concentration risk if diversification is limited.
Key Products & Brands
The table below presents HP Inc.’s main products and brands along with concise descriptions:
| Product | Description |
|---|---|
| Personal Systems Group | Offers commercial and consumer desktops, notebooks, workstations, thin clients, mobility devices, and peripherals. |
| Printing | Provides consumer and commercial printer hardware, supplies, solutions, and services. |
| Corporate Investments | Includes HP Labs, business incubation, and investment projects. |
HP Inc.’s portfolio centers on personal computing devices and printing solutions, supported by research and development through corporate investments. The Personal Systems segment is the largest revenue contributor, followed by Printing and Corporate Investments.
Main Competitors
There are 12 competitors in the Computer Hardware industry; below is a table of the top 10 leaders by market capitalization:
| Competitor | Market Cap. |
|---|---|
| Arista Networks, Inc. | 168B |
| Dell Technologies Inc. | 86B |
| Western Digital Corporation | 65B |
| Seagate Technology Holdings plc | 61B |
| Pure Storage, Inc. | 22B |
| NetApp, Inc. | 21B |
| HP Inc. | 21B |
| Super Micro Computer, Inc. | 18B |
| IonQ, Inc. | 16B |
| D-Wave Quantum Inc. | 9.1B |
HP Inc. ranks 7th among its 12 competitors, with a market cap roughly 10.8% of the leader’s. It is positioned below both the average market cap of the top 10 competitors (49B) and the sector median (21B). The company has a 17.03% market cap gap to the next competitor above it, indicating a moderate distance from the immediate higher-ranked peer.
Comparisons with competitors
Check out how we compare the company to its competitors:
Does HP Inc. have a competitive advantage?
HP Inc. demonstrates a slight competitive advantage, as it is creating value with a ROIC significantly above its WACC by 17.4%, indicating efficient use of invested capital despite a declining profitability trend. The company’s diversified product segments, including personal systems and printing, support its market position in the competitive computer hardware industry.
Looking ahead, HP Inc. has opportunities to leverage its Corporate Investments segment, focusing on HP Labs and new business incubations, which could drive innovation and entry into emerging markets. Continued development of solutions and services for diverse customer bases, including government and health sectors, may further enhance growth prospects.
SWOT Analysis
This SWOT analysis highlights HP Inc.’s key internal and external factors to guide informed investment decisions.
Strengths
- Strong global brand recognition
- Diverse product portfolio in personal systems and printing
- Favorable financial ratios including ROIC and dividend yield
Weaknesses
- Declining revenue and net income over the past five years
- Low liquidity ratios indicating potential short-term financial stress
- Negative return on equity signaling profitability challenges
Opportunities
- Growth potential in emerging markets like Asia Pacific
- Expansion of services and solutions in corporate investments
- Increasing demand for environmentally friendly and innovative tech products
Threats
- Intense competition in computer hardware sector
- Rapid technological changes requiring continuous innovation
- Economic slowdown impacting corporate and consumer spending
Overall, HP Inc. demonstrates solid strengths and favorable financial metrics but faces significant profitability and growth challenges. Strategic focus on innovation and market expansion is crucial to mitigate risks and leverage emerging opportunities.
Stock Price Action Analysis
The following weekly stock chart illustrates HP Inc.’s price movements over the past 100 weeks, highlighting key volatility and trend shifts:
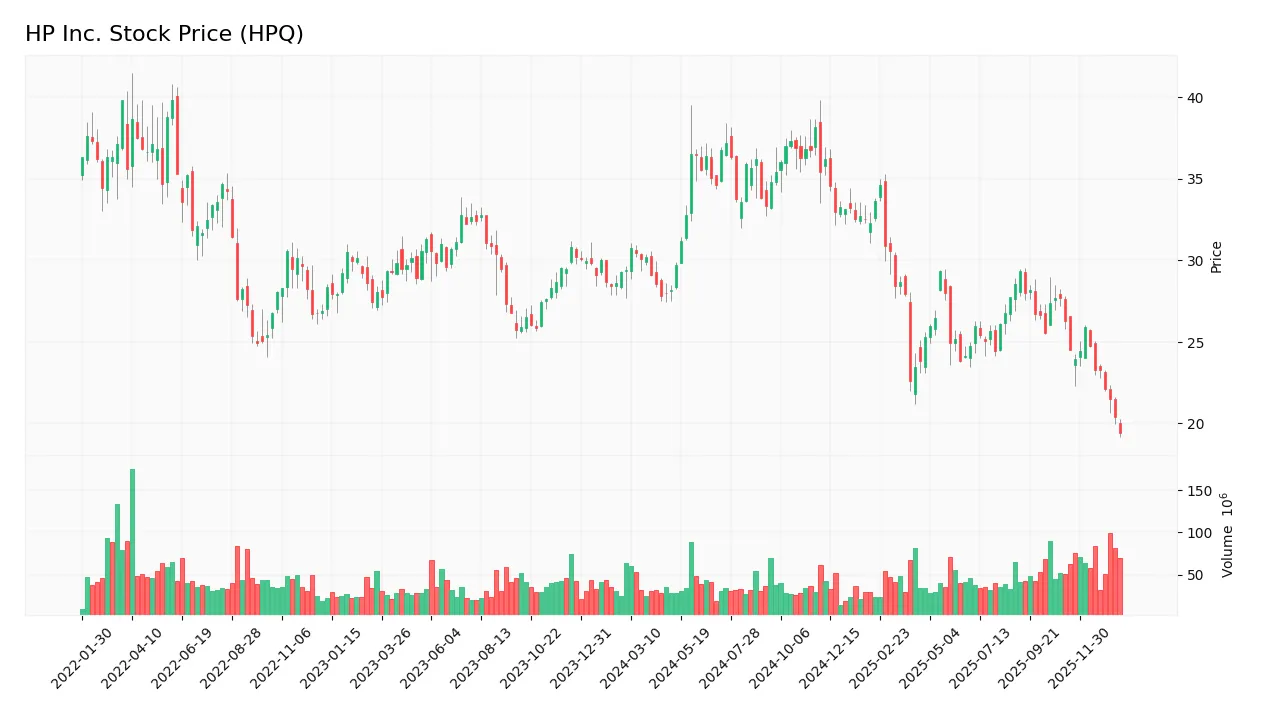
Trend Analysis
Over the past 100 weeks, HPQ’s stock price declined by 33.93%, indicating a bearish trend with deceleration in the downtrend. The price fluctuated between a high of 38.13 and a low of 19.43, with a volatility measured by a standard deviation of 4.79, reflecting notable price swings.
Volume Analysis
Trading volume shows an increasing trend with total volume at approximately 5.1B shares. Seller volume slightly surpasses buyer volume at 2.58B versus 2.46B shares, representing 48.13% buyer participation overall. Recent months confirm seller dominance with a 17.5% buyer dominance deficit, suggesting cautious or negative investor sentiment.
Target Prices
The consensus target price for HP Inc. reflects moderate upside potential based on current analyst estimates.
| Target High | Target Low | Consensus |
|---|---|---|
| 30 | 18 | 23.33 |
Analysts expect HP’s stock to trade within an $18 to $30 range, with a consensus price around $23.33, indicating cautious optimism in the near term.

Don’t Let Luck Decide Your Entry Point
Optimize your entry points with our advanced ProRealTime indicators. You’ll get efficient buy signals with precise price targets for maximum performance. Start outperforming now!
Analyst & Consumer Opinions
This section examines recent analyst ratings and consumer feedback related to HP Inc. (HPQ) for a balanced perspective.
Stock Grades
The following table presents the latest verified stock grades for HP Inc. from prominent financial institutions as of early 2026:
| Grading Company | Action | New Grade | Date |
|---|---|---|---|
| Citigroup | Maintain | Neutral | 2026-01-20 |
| Morgan Stanley | Maintain | Underweight | 2026-01-20 |
| Barclays | Downgrade | Underweight | 2026-01-16 |
| Goldman Sachs | Maintain | Neutral | 2025-11-26 |
| Citigroup | Maintain | Neutral | 2025-11-26 |
| Morgan Stanley | Maintain | Underweight | 2025-11-26 |
| JP Morgan | Maintain | Neutral | 2025-11-26 |
| Barclays | Maintain | Equal Weight | 2025-11-26 |
| UBS | Maintain | Neutral | 2025-11-26 |
| Evercore ISI Group | Maintain | In Line | 2025-11-26 |
Overall, the grading trend for HP Inc. shows a predominance of neutral or cautious stances, with multiple firms maintaining neutral ratings and a recent downgrade by Barclays to underweight, indicating some concerns among analysts. The consensus remains a hold, reflecting moderate investor sentiment.
Consumer Opinions
Consumers often express a mix of admiration and frustration when discussing HP Inc., reflecting the company’s strengths in innovation as well as areas needing improvement.
| Positive Reviews | Negative Reviews |
|---|---|
| “HP’s printers are reliable and produce high-quality prints consistently.” | “Customer service response times can be slow and unhelpful.” |
| “The design of their laptops is sleek and lightweight, perfect for professionals on the go.” | “Some products experience frequent hardware issues after a year of use.” |
| “Software updates are regular and improve the user experience noticeably.” | “Pricing feels a bit high compared to competitors offering similar specs.” |
Overall, consumers appreciate HP Inc.’s product quality and innovative design but often point to customer support delays and occasional hardware reliability problems as key concerns.
Risk Analysis
The following table summarizes key risks associated with HP Inc., highlighting their likelihood and potential impact on the company’s performance:
| Category | Description | Probability | Impact |
|---|---|---|---|
| Financial Health | Altman Z-Score in distress zone (1.58) indicates elevated bankruptcy risk | High | High |
| Profitability | Negative ROE (-730.92%) signals operational inefficiencies | High | High |
| Liquidity | Low current ratio (0.77) and quick ratio (0.48) imply short-term liquidity constraints | Medium | Medium |
| Market Volatility | Beta of 1.22 suggests stock price is moderately sensitive to market swings | Medium | Medium |
| Debt Management | Favorable debt-to-assets (26.05%) but poor debt-to-equity score | Low | Medium |
| Dividend Sustainability | Dividend yield of 4.16% is attractive but depends on stable cash flows | Medium | Medium |
The most concerning risks are HP’s distressed Altman Z-Score combined with its negative ROE, reflecting ongoing operational challenges despite favorable returns on invested capital. Liquidity ratios signal potential short-term funding issues, which investors should monitor carefully amid market volatility.
Should You Buy HP Inc.?
HP Inc. appears to be generating operational value with a slightly favorable moat despite a declining return on invested capital. While its leverage profile suggests manageable debt, profitability and equity returns are under pressure, reflecting a moderate overall rating of B-.
Strength & Efficiency Pillars
HP Inc. exhibits notable value creation with a return on invested capital (ROIC) of 24.97% significantly exceeding its weighted average cost of capital (WACC) at 7.55%, confirming it as a clear value creator. The company also boasts favorable financial health indicators, including a debt-to-assets ratio of 26.05% and an interest coverage ratio of 6.27, underscoring its ability to service debt comfortably. While return on equity (ROE) is deeply negative at -730.92%, other efficiency metrics like asset turnover (1.32) and fixed asset turnover (13.23) remain robust, reflecting operational efficiency despite profitability pressures. The Piotroski score of 6 suggests average financial strength, albeit with some room for improvement.
Weaknesses and Drawbacks
HP Inc. faces significant challenges, particularly in profitability and liquidity. The net margin is a modest 4.57%, coupled with a negative trend in earnings and margin growth over recent years. Liquidity concerns arise from a current ratio of 0.77 and quick ratio of 0.48, both below the ideal threshold of 1, indicating potential short-term financial strain. Valuation metrics are mixed; while the price-to-earnings ratio of 10.35 is reasonable, the price-to-book ratio is highly negative at -75.65, signaling potential accounting or asset valuation issues. Recent market activity also reflects seller dominance with buyer volume only 17.5% of the recent trading period, intensifying short-term downside risk.
Our Verdict about HP Inc.
HP Inc.’s fundamental profile may appear moderately favorable due to its strong value creation and operational efficiency. However, the bearish overall stock trend and pronounced seller dominance in the recent period suggest caution. Despite HP’s long-term capability to generate value above cost of capital, recent market pressures and weak profitability metrics might prompt a wait-and-see approach for investors seeking a more stable entry point. The profile suggests potential but with notable risks that should be managed carefully.
Disclaimer: This content is for informational purposes only and does not constitute financial, investment, or other professional advice. Investing in financial markets involves a significant risk of loss, and past performance is not indicative of future results.
Additional Resources
- Goldman Sachs Downgrades HP Inc (HPQ) to Sell – Yahoo Finance (Jan 19, 2026)
- Bank of America Securities maintains hold rating on HP Inc. (HPQ) stock – MSN (Jan 20, 2026)
- Why HP (HPQ) Stock Is Trading Lower Today – Finviz (Jan 20, 2026)
- How Low Can HP Stock Go? – Forbes (Jan 06, 2026)
- Do Wall Street’s Split Views On HP’s (HPQ) PC And Printing Headwinds Reveal A Deeper Risk? – simplywall.st (Jan 22, 2026)
For more information about HP Inc., please visit the official website: hp.com