Home > Analyses > Real Estate > Host Hotels & Resorts, Inc.
Host Hotels & Resorts, Inc. transforms how millions experience luxury travel by owning and managing premier hotel properties. As the largest lodging REIT, it commands a portfolio of 79 upscale hotels under top-tier brands like Marriott, Ritz-Carlton, and Hilton. Known for disciplined capital allocation and asset management, Host shapes the hospitality landscape with strategic partnerships. Yet, as market dynamics shift, I question whether its fundamentals still justify current valuations and growth prospects.

Table of contents
Business Model & Company Overview
Host Hotels & Resorts, Inc. stands as the largest lodging real estate investment trust and a dominant player in luxury and upper-upscale hotels. Founded in 1980 and headquartered in Bethesda, MD, the company owns 74 U.S. properties and five international sites, totaling roughly 46,100 rooms. Its portfolio operates as a cohesive ecosystem, partnering with top-tier brands like Marriott®, Ritz-Carlton®, and Hilton®, delivering a premium hospitality experience across its network.
The company’s revenue engine balances asset ownership with strategic partnerships, generating steady cash flow from a mix of property leasing and management contracts. Its footprint spans the Americas, Europe, and Asia, leveraging global travel trends to maximize occupancy and rates. Host’s disciplined capital allocation and aggressive asset management create a robust economic moat that cements its influence on the evolving hospitality industry.
Financial Performance & Fundamental Metrics
I analyze Host Hotels & Resorts, Inc.’s income statement, key financial ratios, and dividend payout policy to assess its profitability and capital efficiency.
Income Statement
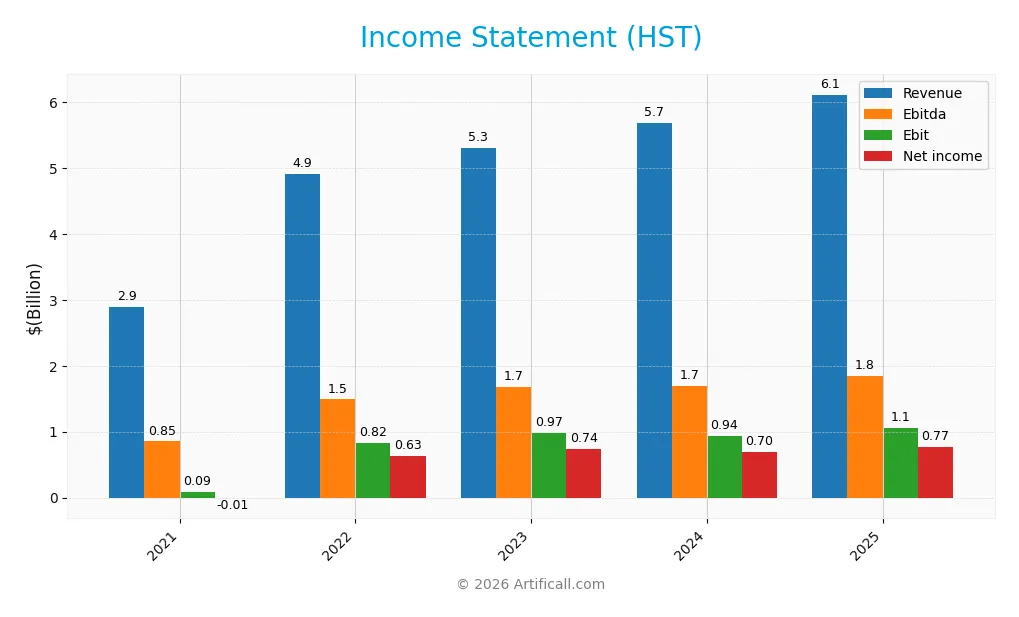
The table below summarizes Host Hotels & Resorts, Inc.’s key income statement figures for fiscal years 2021 through 2025. All values are in USD.
| 2021 | 2022 | 2023 | 2024 | 2025 | |
|---|---|---|---|---|---|
| Revenue | 2.89B | 4.91B | 5.31B | 5.68B | 6.11B |
| Cost of Revenue | 1.40B | 2.20B | 2.46B | 2.65B | 5.95B |
| Operating Expenses | 1.74B | 1.94B | 2.02B | 2.16B | -671M |
| Gross Profit | 1.49B | 2.71B | 2.85B | 3.03B | 160M |
| EBITDA | 851M | 1.49B | 1.67B | 1.70B | 1.85B |
| EBIT | 89M | 825M | 975M | 936M | 1.05B |
| Interest Expense | 191M | 156M | 187M | 215M | 235M |
| Net Income | -11M | 633M | 740M | 697M | 765M |
| EPS | -0.02 | 0.89 | 1.04 | 0.99 | 1.10 |
| Filing Date | 2022-02-24 | 2023-02-22 | 2024-02-28 | 2025-02-26 | 2026-02-25 |
Income Statement Evolution
Host Hotels & Resorts saw revenue rise steadily from 2.89B in 2021 to 6.11B in 2025, more than doubling over five years. Net income improved dramatically, turning from a slight loss in 2021 to 765M in 2025. Margins evolved unevenly; gross margin weakened sharply, but EBIT and net margins improved, reflecting better operational efficiency.
Is the Income Statement Favorable?
In 2025, HST posted a 7.6% revenue increase and a 12.5% EBIT growth, signaling operational strength. Despite a gross margin decline to 2.6%, the company maintained a solid 17.2% EBIT margin and 12.5% net margin. Interest expense remains well-controlled at 3.8% of revenue. Overall, fundamentals appear favorable, supported by margin expansion and robust bottom-line growth.
Financial Ratios
The table below presents key financial ratios for Host Hotels & Resorts, Inc. (HST) over the last five fiscal years, summarizing profitability, valuation, liquidity, leverage, and efficiency metrics:
| Ratios | 2021 | 2022 | 2023 | 2024 | 2025 |
|---|---|---|---|---|---|
| Net Margin | -0.38% | 12.90% | 13.93% | 12.26% | 12.51% |
| ROE | -0.17% | 9.43% | 11.16% | 10.55% | 11.67% |
| ROIC | -0.22% | 6.30% | 6.70% | 6.79% | 6.45% |
| P/E | -1123 | 18.12 | 18.67 | 17.65 | 16.05 |
| P/B | 1.92 | 1.71 | 2.08 | 1.86 | 1.87 |
| Current Ratio | 1.66 | 0.96 | 1.07 | 0.65 | 0.00 |
| Quick Ratio | 1.66 | 0.96 | 1.07 | 0.65 | 0.00 |
| D/E | 0.85 | 0.71 | 0.72 | 0.85 | 0.95 |
| Debt-to-Assets | 44.16% | 38.98% | 38.98% | 43.25% | 47.54% |
| Interest Coverage | -1.31 | 4.97 | 4.42 | 4.07 | 3.54 |
| Asset Turnover | 0.23 | 0.40 | 0.43 | 0.44 | 0.47 |
| Fixed Asset Turnover | 0.27 | 0.48 | 0.52 | 0.50 | 0.55 |
| Dividend Yield | 0.00% | 1.31% | 3.96% | 5.99% | 5.07% |
Evolution of Financial Ratios
Return on Equity (ROE) showed gradual improvement from negative in 2021 to around 11.7% in 2025, indicating recovery and stabilization in profitability. The Current Ratio declined sharply, reaching zero in 2025, signaling deteriorating short-term liquidity. Debt-to-Equity ratio remained relatively stable near 0.95, reflecting consistent leverage management over the period.
Are the Financial Ratios Favorable?
Profitability metrics such as net margin (12.5%) are favorable, but ROE and ROIC slightly lag behind the WACC of 7.17%, marking neutral efficiency. Liquidity ratios are unfavorable, with current and quick ratios at zero, raising red flags for short-term solvency. Asset turnover ratios also appear weak, while leverage and dividend yield present neutral signals. Overall, the financial ratios lean slightly unfavorable.
Shareholder Return Policy
Host Hotels & Resorts, Inc. maintains a high dividend payout ratio around 81%, with a 2025 dividend per share of $0.90 and a robust 5.07% yield. The dividend is well-covered by free cash flow, indicating prudent capital allocation, while no explicit share buyback data is provided.
This consistent dividend distribution aligns with sustainable value creation, supported by solid operating margins and cash flow metrics. However, the relatively high payout ratio warrants monitoring to avoid stress on financial flexibility, especially given the company’s moderate leverage levels.
Score analysis
The following radar chart presents Host Hotels & Resorts, Inc.’s key financial scores and valuation metrics for a comprehensive overview:
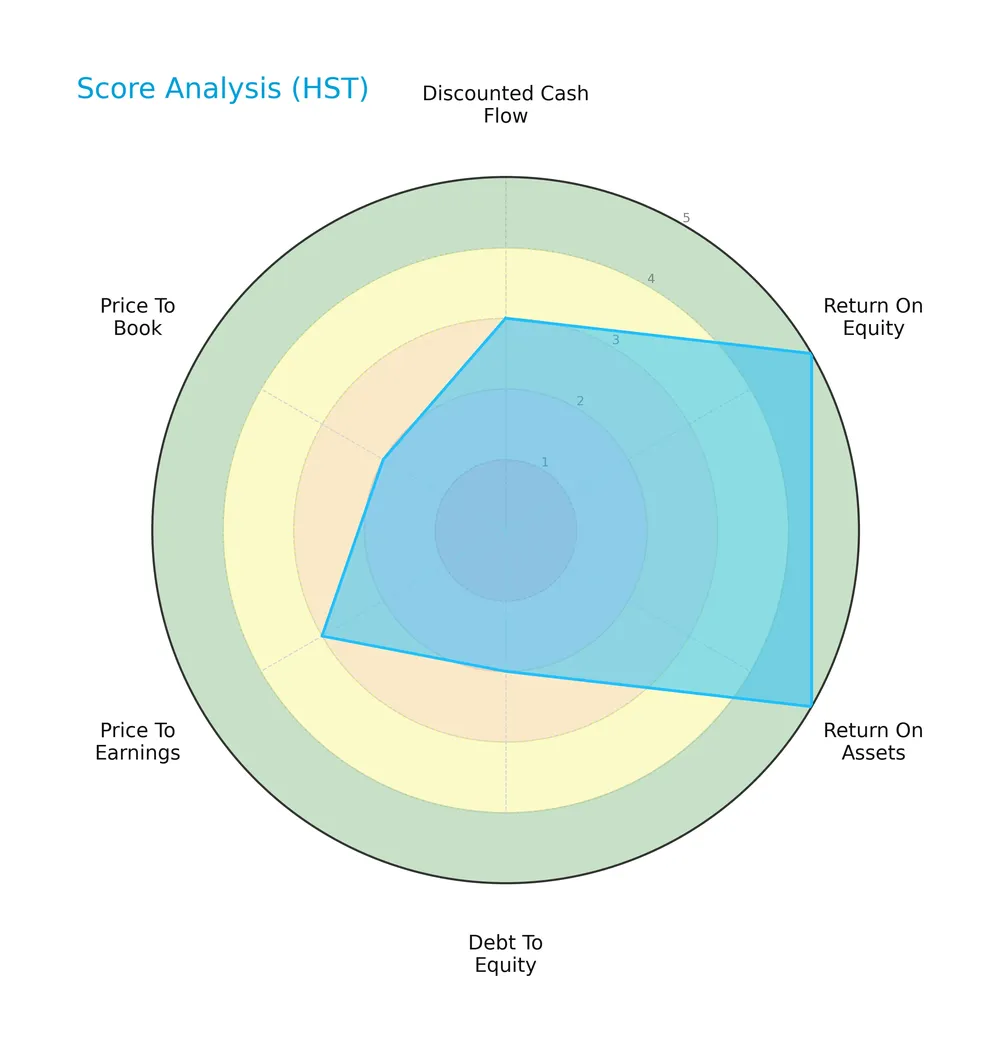
Host Hotels & Resorts scores very favorably on return on equity and assets, indicating efficient use of capital. However, its debt-to-equity and price-to-book scores remain unfavorable, highlighting leverage and valuation concerns. Discounted cash flow and price-to-earnings scores are moderate.
Analysis of the company’s bankruptcy risk
Host Hotels & Resorts’ Altman Z-Score places it in the grey zone, suggesting a moderate risk of bankruptcy and some financial uncertainty:

Is the company in good financial health?
The Piotroski Score diagram illustrates Host Hotels & Resorts’ financial strength based on profitability, leverage, and efficiency:

With a Piotroski Score of 6, the company shows average financial health, reflecting neither strong nor weak fundamentals but a balanced profile overall.
Competitive Landscape & Sector Positioning
This sector analysis explores Host Hotels & Resorts, Inc.’s strategic positioning, revenue segments, and key products. I will assess whether Host Hotels holds a competitive advantage over its main competitors.
Strategic Positioning
Host Hotels & Resorts, Inc. concentrates its portfolio in luxury and upper-upscale hotels, owning 74 U.S. properties and five international ones, with 6,100 rooms outside the U.S. Revenue heavily favors U.S. markets, with over $6B in 2025, signaling geographic focus and strategic partnerships with premium brands.
Revenue by Segment
This pie chart displays Host Hotels & Resorts, Inc.’s revenue distribution by segment for fiscal year 2025, illustrating the contribution of key business areas.
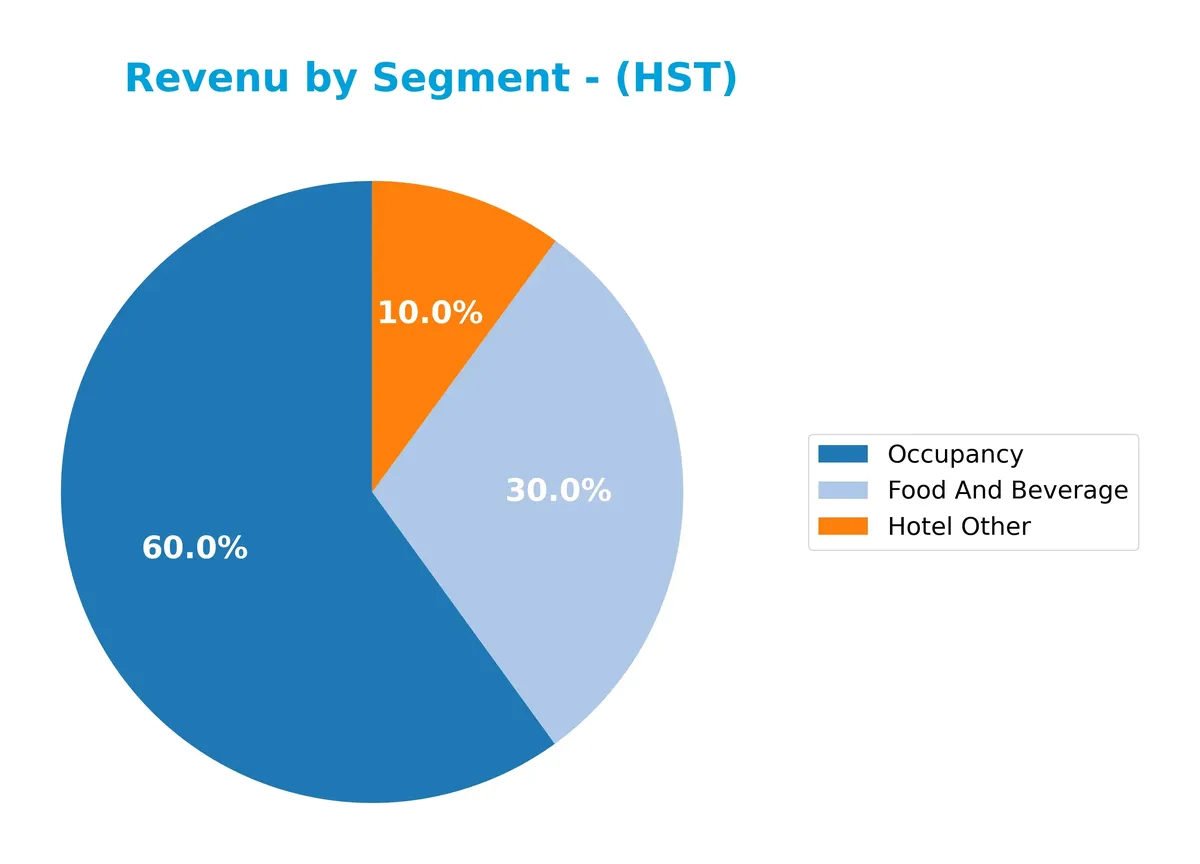
In 2025, Occupancy remains the dominant revenue driver at 3.6B, reflecting steady growth since 2021. Food and Beverage climbed to 1.8B, showing consistent expansion. Hotel Other, at 604M, also grew but remains the smallest segment. The trend highlights a solid recovery and diversification, with occupancy revenue accelerating moderately, reducing concentration risk in a historically cyclical hospitality sector.
Key Products & Brands
Host Hotels & Resorts generates revenue through three main segments, reflecting its diversified hospitality portfolio:
| Product | Description |
|---|---|
| Occupancy | Revenue from room bookings across 74 U.S. and 5 international luxury and upper-upscale hotels. |
| Food And Beverage | Sales from dining services within hotel properties, including restaurants and catering. |
| Hotel Other | Income from ancillary hotel services and amenities beyond room rentals and dining. |
Host Hotels & Resorts leverages premium partnerships with brands like Marriott, Ritz-Carlton, and Hilton. Its revenue streams show steady growth in occupancy and food and beverage, highlighting robust demand in luxury lodging and hospitality services.
Main Competitors
In total, 31 competitors exist in the Real Estate sector, with the table below listing the top 10 by market capitalization:
| Competitor | Market Cap. |
|---|---|
| Welltower Inc. | 128.3B |
| Prologis, Inc. | 119.7B |
| American Tower Corporation | 81.8B |
| Equinix, Inc. | 74.5B |
| Simon Property Group, Inc. | 60.1B |
| Digital Realty Trust, Inc. | 53.3B |
| Realty Income Corporation | 52.7B |
| CBRE Group, Inc. | 47.7B |
| Public Storage | 45.3B |
| Crown Castle Inc. | 38.6B |
Host Hotels & Resorts, Inc. ranks 24th among 31 competitors. Its market cap is 10.56% of the leader, Welltower Inc. The company sits below both the average market cap of the top 10 (70.2B) and the sector median (24.6B). Host Hotels’ market cap is just 0.22% below the next competitor above it, indicating a tight cluster in its immediate competitive range.
Comparisons with competitors
Check out how we compare the company to its competitors:
Aucun article trouvé pour ces critères.
Does HST have a competitive advantage?
Host Hotels & Resorts, Inc. currently does not present a strong competitive advantage, as it is shedding value with a ROIC below its WACC, reflecting slight value destruction. However, the company shows a growing ROIC trend, signaling improving profitability despite its current challenges.
Looking ahead, HST benefits from disciplined capital allocation and partnerships with premium hotel brands, owning 74 U.S. properties and expanding internationally. This portfolio diversification and asset management approach may present growth opportunities in luxury and upper-upscale hotel markets.
SWOT Analysis
This SWOT analysis highlights Host Hotels & Resorts, Inc.’s key strategic factors to inform investment decisions.
Strengths
- Largest lodging REIT with 74 US properties
- Strong partnerships with premium hotel brands
- Favorable EBIT and net margins
Weaknesses
- Low current and quick ratios indicate liquidity risk
- ROIC below WACC signals value destruction
- Unfavorable asset turnover ratios
Opportunities
- Revenue growth over 111% in five years
- Growing ROIC trend suggests improving profitability
- Expansion potential in international markets
Threats
- High leverage with debt-to-equity near 1
- Competitive hospitality industry dynamics
- Economic sensitivity impacting travel demand
Host Hotels commands a leading market position but faces liquidity and efficiency challenges. Its strategy should prioritize strengthening balance sheet health while leveraging its brand partnerships and growth momentum.
Stock Price Action Analysis
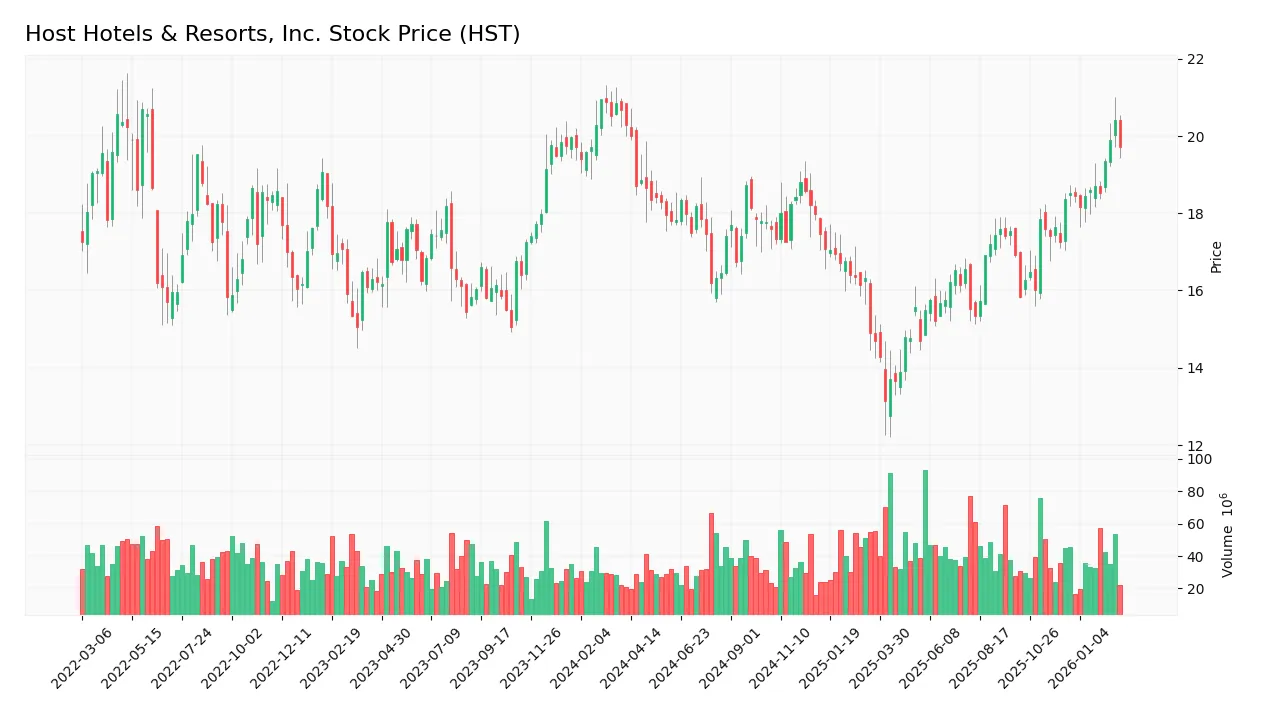
The following weekly chart displays Host Hotels & Resorts, Inc.’s stock price movement over the past 12 months, highlighting key highs and lows:
Trend Analysis
Over the past 12 months, HST’s stock price declined by 2.81%, indicating a bearish trend with acceleration. The price ranged from a high of 20.4 to a low of 13.14. Volatility measured by standard deviation was moderate at 1.48, confirming notable price swings.
Volume Analysis
Trading volume is increasing, with buyers controlling 50.7% overall. In the recent three months ending March 2026, buyer dominance surged to 73.6%, signaling strong buyer-driven activity and growing market participation.
Target Prices
Analysts set a cautious but positive target consensus for Host Hotels & Resorts, Inc. (HST).
| Target Low | Target High | Consensus |
|---|---|---|
| 18 | 22 | 19.83 |
The target range between $18 and $22 reflects moderate upside potential. Consensus suggests steady recovery aligned with sector trends.

Don’t Let Luck Decide Your Entry Point
Optimize your entry points with our advanced ProRealTime indicators. You’ll get efficient buy signals with precise price targets for maximum performance. Start outperforming now!
Analyst & Consumer Opinions
This section reviews analyst ratings and consumer feedback to provide a balanced perspective on Host Hotels & Resorts, Inc.
Stock Grades
Here are the latest verified stock grades from well-known financial institutions for Host Hotels & Resorts, Inc.:
| Grading Company | Action | New Grade | Date |
|---|---|---|---|
| JP Morgan | Maintain | Neutral | 2026-02-20 |
| JP Morgan | Maintain | Neutral | 2026-01-22 |
| Truist Securities | Upgrade | Buy | 2026-01-09 |
| Truist Securities | Maintain | Hold | 2025-12-04 |
| Evercore ISI Group | Downgrade | In Line | 2025-11-11 |
| JP Morgan | Maintain | Neutral | 2025-11-07 |
| Compass Point | Upgrade | Buy | 2025-11-07 |
| UBS | Maintain | Neutral | 2025-09-22 |
| Truist Securities | Maintain | Hold | 2025-09-03 |
| Wells Fargo | Maintain | Overweight | 2025-08-27 |
The overall trend shows a stable to moderately positive outlook with multiple upgrades to Buy and consistent Neutral and Hold ratings from major firms. Notably, Truist and Compass Point have recently upgraded their positions, signaling growing confidence.
Consumer Opinions
Host Hotels & Resorts, Inc. evokes mixed emotions from its customers, reflecting its position as a major player in the hospitality industry.
| Positive Reviews | Negative Reviews |
|---|---|
| “Excellent locations with stunning views.” | “Room service is slow and often inconsistent.” |
| “Friendly staff and clean facilities.” | “Prices have become quite steep recently.” |
| “Loyalty program offers great rewards.” | “Wi-Fi connectivity is unreliable in many hotels.” |
Overall, guests consistently praise Host’s prime locations and attentive staff. However, service delays and rising costs remain notable consumer pain points. These issues could impact repeat business if unaddressed.
Risk Analysis
Below is a detailed table summarizing Host Hotels & Resorts, Inc.’s key risks, their likelihood, and potential impact:
| Category | Description | Probability | Impact |
|---|---|---|---|
| Liquidity Risk | Current and quick ratios at 0 signal serious short-term cash issues. | High | High |
| Market Volatility | Beta of 1.159 indicates above-market price swings. | Moderate | Moderate |
| Leverage Risk | Debt-to-equity near 1 and debt-to-assets at 47.5% imply high debt. | Moderate | Moderate |
| Operational Risk | Unfavorable asset turnover limits efficiency in revenue generation. | Moderate | Moderate |
| Bankruptcy Risk | Altman Z-Score of 2.02 places company in a grey zone for distress. | Moderate | High |
| Dividend Sustainability | Dividend yield over 5% may pressure free cash flow if earnings falter. | Moderate | Moderate |
The most pressing risk is liquidity, with zero current and quick ratios indicating potential cash flow constraints. Coupled with a grey-zone Altman Z-Score, the company faces moderate bankruptcy risk despite stable profitability. Leverage and operational efficiency remain concerns, with debt levels close to equity and weak asset turnover ratios. Investors must monitor these factors closely amid market volatility.
Should You Buy Host Hotels & Resorts, Inc.?
Host Hotels & Resorts, Inc. appears to be improving profitability with growing ROIC despite a slightly unfavorable moat indicating value destruction. Its leverage profile seems substantial, reflected in an unfavorable debt-to-equity score. Overall, the company suggests a favorable A- rating with moderate risk.
Strength & Efficiency Pillars
Host Hotels & Resorts, Inc. shows operational strength with a favorable EBIT margin of 17.22% and a solid net margin of 12.51%. The company maintains a neutral ROIC of 6.45%, slightly below its WACC of 7.17%, indicating it is currently shedding value rather than creating it. However, ROIC has exhibited a strong upward trend, suggesting improving profitability. Return on equity stands at a neutral 11.67%, reflecting moderate efficiency in shareholder capital deployment.
Weaknesses and Drawbacks
The company resides in the Altman Z-Score grey zone with a value of 2.02, signaling moderate financial distress risk. Although not yet critical, this warns of potential solvency concerns if conditions worsen. Valuation metrics remain neutral with a P/E of 16.05 and P/B of 1.87, presenting neither a clear discount nor premium. Liquidity is a red flag: both current and quick ratios are zero, indicating weak short-term asset coverage. Asset turnover and fixed asset turnover rates are unfavorable, hinting at suboptimal asset utilization.
Our Final Verdict about Host Hotels & Resorts, Inc.
Host Hotels & Resorts, Inc. presents a mixed fundamental profile. Despite improving profitability and strong recent buyer dominance at 73.63%, the grey-zone Altman Z-Score of 2.02 advises caution. The profile might appear attractive for investors focused on operational recovery, but solvency risks and weak liquidity metrics suggest a prudent, wait-and-see approach remains warranted.
Disclaimer: This content is for informational purposes only and does not constitute financial, investment, or other professional advice. Investing in financial markets involves a significant risk of loss, and past performance is not indicative of future results.
Additional Resources
- Host Hotels & Resorts: A High-Quality Hotel REIT Still Worth Buying After Strong Results – Seeking Alpha (Feb 25, 2026)
- Decoding Host Hotels & Resorts Inc (HST): A Strategic SWOT Insig – GuruFocus (Feb 26, 2026)
- Host Hotels (NASDAQ: HST) maps 76-hotel portfolio and key risks – Stock Titan (Feb 25, 2026)
- Host Hotels & Resorts sells 2 Four Seasons for combined $1.1B – Hotel Dive (Feb 20, 2026)
- Host Hotels & Resorts sells iconic Four Seasons locations for over $1 billion – MSN (Feb 26, 2026)
For more information about Host Hotels & Resorts, Inc., please visit the official website: hosthotels.com