Home > Analyses > Consumer Defensive > Hormel Foods Corporation
Hormel Foods Corporation puts nourishing millions of households at the heart of its business, transforming daily meals with trusted staples like SPAM, Skippy, and Jennie-O. As a dominant force in the packaged foods industry, Hormel combines innovation with a diverse portfolio spanning fresh meats, snacks, and refrigerated foods, backed by a reputation for quality and reliability. As we delve into its financial health and market position in 2026, the key question remains: does Hormel’s enduring strength still justify its current valuation and growth expectations?
Table of contents
Business Model & Company Overview
Hormel Foods Corporation, founded in 1891 and headquartered in Austin, Minnesota, stands as a dominant player in the packaged foods industry. The company’s ecosystem spans fresh, frozen, refrigerated, and shelf-stable products, ranging from meats and nuts to meal solutions and snacks. This integrated portfolio supports retail, foodservice, deli, and commercial customers, uniting diverse food categories under trusted brand names like SPAM, SKIPPY, and Jennie-O.
Hormel’s revenue engine balances robust sales of perishable items with shelf-stable goods, leveraging branded and unbranded pork, beef, poultry, and nutritional products. Its strategic footprint extends across the Americas, Europe, and Asia, optimizing distribution channels through direct sales and independent brokers. This competitive advantage cements Hormel’s role as a resilient force shaping the future of global food consumption.
Financial Performance & Fundamental Metrics
This section provides a fundamental analysis of Hormel Foods Corporation, covering its income statement, key financial ratios, and dividend payout policy.
Income Statement
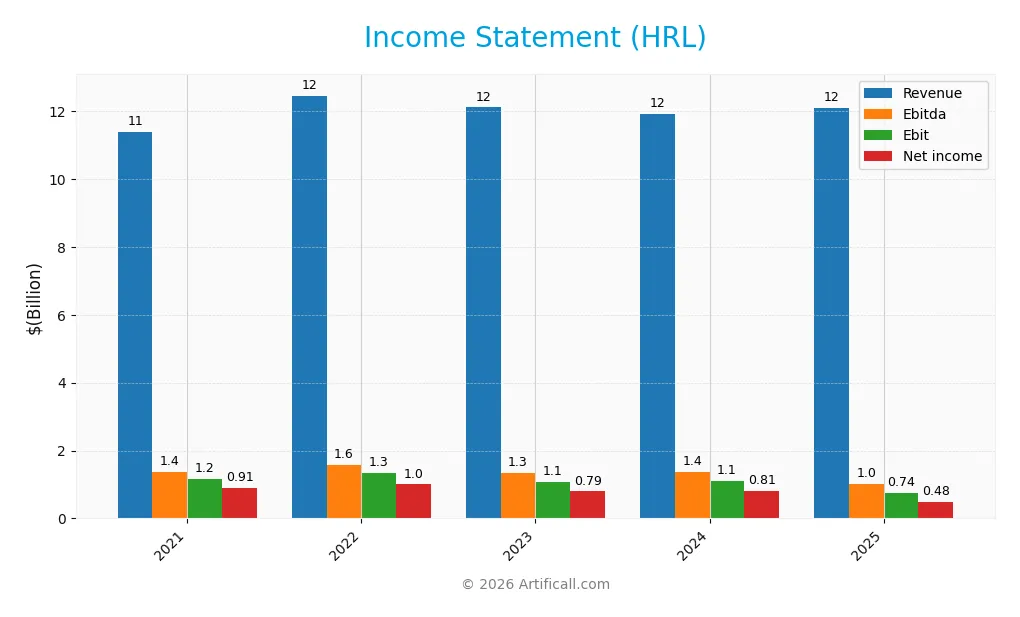
The table below presents Hormel Foods Corporation’s key income statement figures for fiscal years 2021 through 2025, reported in USD.
| 2021 | 2022 | 2023 | 2024 | 2025 | |
|---|---|---|---|---|---|
| Revenue | 11.39B | 12.46B | 12.11B | 11.92B | 12.11B |
| Cost of Revenue | 9.46B | 10.29B | 10.11B | 9.90B | 10.24B |
| Operating Expenses | 805M | 852M | 928M | 954M | 995M |
| Gross Profit | 1.93B | 2.16B | 2.00B | 2.02B | 1.87B |
| EBITDA | 1.38B | 1.58B | 1.34B | 1.37B | 1.01B |
| EBIT | 1.17B | 1.34B | 1.09B | 1.12B | 742M |
| Interest Expense | 43M | 63M | 73M | 81M | 78M |
| Net Income | 909M | 1.00B | 794M | 805M | 478M |
| EPS | 1.68 | 1.84 | 1.45 | 1.47 | 0.87 |
| Filing Date | 2021-12-10 | 2022-12-06 | 2023-12-06 | 2024-12-05 | 2025-12-05 |
Income Statement Evolution
From 2021 to 2025, Hormel Foods Corporation’s revenue showed a modest overall increase of 6.32%, but growth slowed to 1.55% in the last year. Net income declined significantly, dropping 47.38% over the period and 41.51% in the most recent year. Margins reflected this trend, with gross margin and net margin both declining, while EBIT margin remained relatively stable, all classified as neutral.
Is the Income Statement Favorable?
The 2025 income statement reveals a neutral gross margin of 15.45% and EBIT margin of 6.13%, but a lower net margin at 3.95%. Interest expense was favorable at 0.64% of revenue, supporting cost control. However, key performance indicators including revenue growth, gross profit, EBIT, net margin, and EPS all experienced unfavorable declines in the past year. Overall, the fundamentals for 2025 are assessed as unfavorable.
Financial Ratios
The following table presents key financial ratios for Hormel Foods Corporation (HRL) over the fiscal years 2021 to 2025, reflecting profitability, liquidity, leverage, efficiency, and dividend metrics:
| Ratios | 2021 | 2022 | 2023 | 2024 | 2025 |
|---|---|---|---|---|---|
| Net Margin | 7.98% | 8.03% | 6.55% | 6.75% | 3.95% |
| ROE | 13.03% | 13.27% | 10.26% | 10.07% | 6.05% |
| ROIC | 8.03% | 8.67% | 6.94% | 6.89% | 5.24% |
| P/E | 25.57 | 25.31 | 22.41 | 20.80 | 27.31 |
| P/B | 3.33 | 3.36 | 2.30 | 2.09 | 1.65 |
| Current Ratio | 2.08 | 2.47 | 1.43 | 2.32 | 2.47 |
| Quick Ratio | 1.12 | 1.30 | 0.70 | 1.19 | 1.20 |
| D/E | 0.48 | 0.44 | 0.43 | 0.36 | 0.36 |
| Debt-to-Assets | 26.18% | 24.79% | 24.61% | 21.28% | 21.34% |
| Interest Coverage | 25.92 | 21.00 | 14.61 | 13.20 | 11.22 |
| Asset Turnover | 0.90 | 0.94 | 0.90 | 0.89 | 0.90 |
| Fixed Asset Turnover | 5.40 | 5.82 | 5.59 | 5.43 | 5.41 |
| Dividend Yield | 2.25% | 2.20% | 3.33% | 3.67% | 4.85% |
Evolution of Financial Ratios
Hormel Foods Corporation’s Return on Equity (ROE) declined from 13.27% in 2022 to 6.05% in 2025, indicating a slowdown in profitability. The Current Ratio improved slightly, rising from 2.47 in 2022 to 2.47 in 2025, showing stable liquidity. The Debt-to-Equity Ratio decreased from 0.44 in 2022 to 0.36 in 2025, reflecting a reduction in leverage over the period.
Are the Financial Ratios Favorable?
In 2025, profitability ratios like net margin (3.95%) and ROE (6.05%) are considered unfavorable, while return on invested capital is neutral at 5.24%. Liquidity ratios, including the current ratio (2.47) and quick ratio (1.2), are favorable, supporting short-term financial health. Leverage ratios such as debt-to-equity (0.36) and debt-to-assets (21.34%) are favorable, indicating manageable debt levels. Market valuation ratios show mixed signals with a high price-to-earnings ratio (27.31) unfavorable but price-to-book ratio (1.65) neutral. Overall, 57.14% of key ratios are favorable, suggesting a generally positive financial condition.
Shareholder Return Policy
Hormel Foods Corporation consistently pays dividends, with a payout ratio above 100% in 2025, indicating dividends slightly exceed net income. The dividend per share has grown steadily to $1.15 in 2025, yielding about 4.85%. The company also engages in share buybacks, supported by free cash flow coverage around 63%.
While the dividend yield and steady increases suggest shareholder returns are prioritized, the payout ratio above net income could pose sustainability concerns if earnings do not improve. However, free cash flow coverage and ongoing buybacks indicate a balanced approach to returning capital, which may support long-term shareholder value creation.
Score analysis
The following radar chart presents a comprehensive view of Hormel Foods Corporation’s key financial scores:
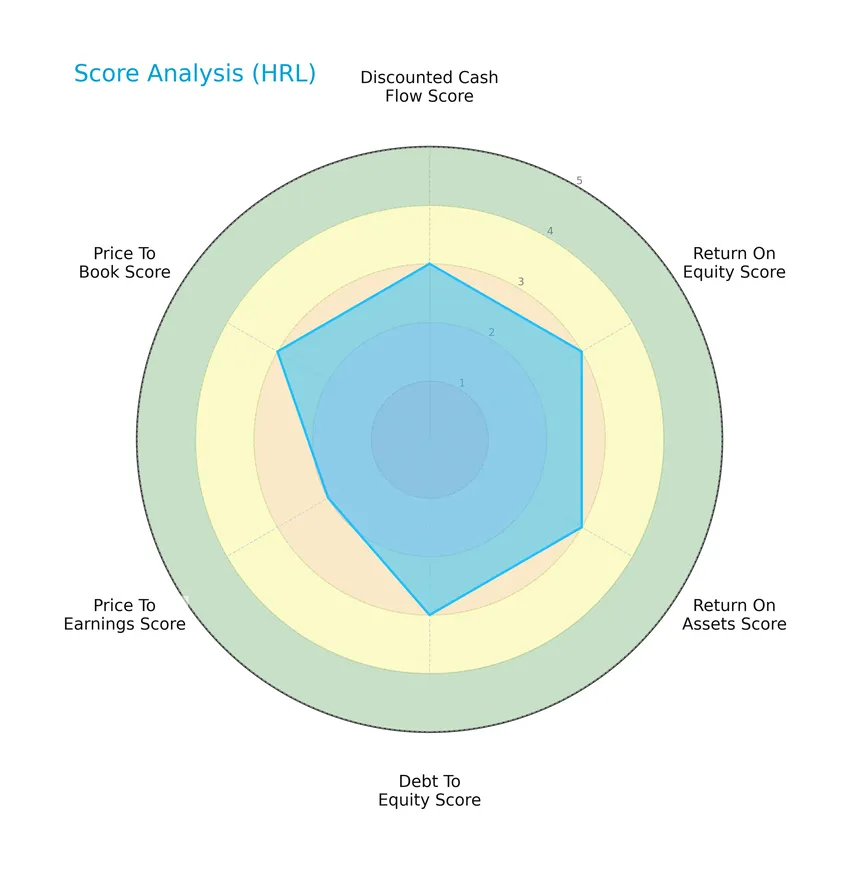
Hormel Foods shows moderate scores across discounted cash flow, return on equity, return on assets, debt to equity, and price to book ratios, with a slightly lower price to earnings score, reflecting balanced financial metrics overall.
Analysis of the company’s bankruptcy risk
The Altman Z-Score places Hormel Foods comfortably in the safe zone, indicating a low risk of bankruptcy and financial distress:

Is the company in good financial health?
This Piotroski diagram highlights Hormel Foods’ financial strength based on fundamental criteria:

With a Piotroski Score of 7, Hormel Foods demonstrates strong financial health, suggesting sound profitability, leverage, liquidity, and operational efficiency.
Competitive Landscape & Sector Positioning
This sector analysis will explore Hormel Foods Corporation’s strategic positioning, revenue breakdown, key products, main competitors, and competitive advantages. I will assess whether Hormel Foods holds a competitive edge within the packaged foods industry.
Strategic Positioning
Hormel Foods Corporation maintains a diversified product portfolio spanning perishable meats, shelf-stable foods, and poultry, with significant revenue from retail (7.5B), foodservice (3.9B), and international segments (0.7B) in 2025. Geographically, it remains heavily concentrated in the US market, generating over 11.4B of its 12.1B total revenue domestically.
Revenue by Segment
This pie chart illustrates Hormel Foods Corporation’s revenue distribution across its main business segments for the fiscal year 2025.
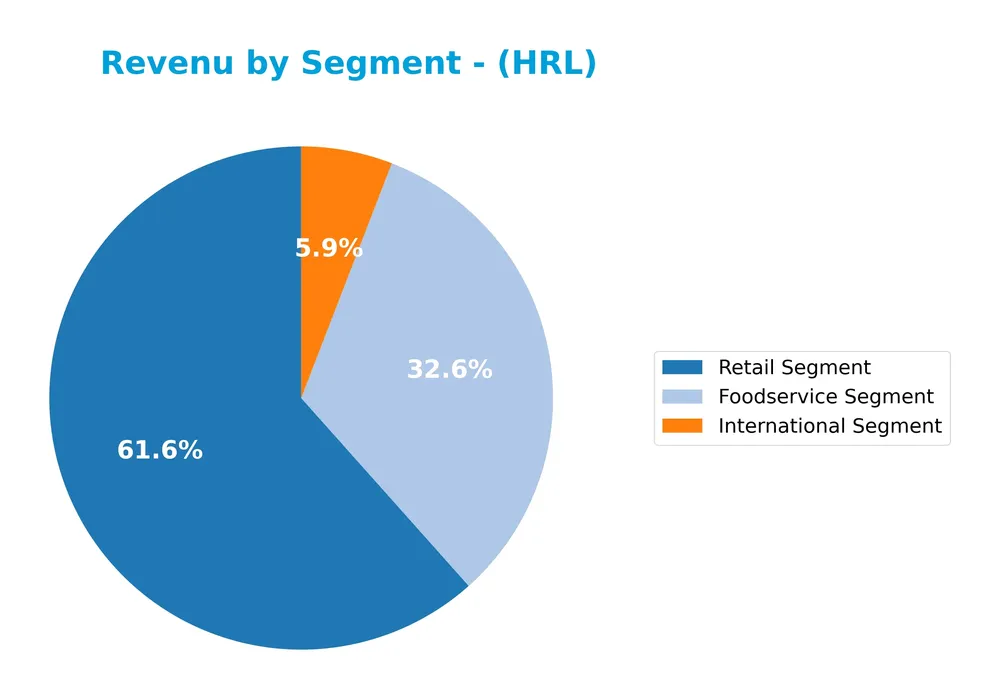
In 2025, the Retail Segment was the largest contributor with $7.5B in revenue, followed by the Foodservice Segment at $3.9B, and the International Segment at $709M. The data shows a stable growth pattern with Retail and Foodservice segments driving the business. The International Segment remains the smallest but steady contributor. The concentration in Retail highlights a potential risk if consumer preferences shift abruptly.
Key Products & Brands
The table below presents Hormel Foods Corporation’s key products and brands with their descriptions:
| Product | Description |
|---|---|
| Perishable Meat | Fresh meats, frozen items, refrigerated meal solutions, sausages, hams, guacamoles, and bacons. |
| Shelf Stable | Canned luncheon meats, nut butters, snack nuts, chilies, microwaveable meals, hashes, stews, tortillas, salsas, chips. |
| Poultry | Branded and unbranded turkey and poultry products, including the Jennie-O Turkey Store segment. |
| Foodservice Segment | Meat and food products supplied primarily to foodservice customers. |
| International Segment | Products marketed and sold outside the United States. |
| Retail Segment | Packaged foods sold to retail customers, including branded products like SKIPPY, SPAM, Applegate, and Planters. |
| Other Products | Nutritional food products, supplements, desserts, drink mixes, and industrial gelatin products. |
Hormel Foods Corporation offers a diverse portfolio spanning perishable meats, shelf-stable goods, poultry, and international and domestic retail and foodservice segments under well-known brand names.
Main Competitors
There are 11 competitors in the Packaged Foods industry, with the table below showing the top 10 leaders by market capitalization:
| Competitor | Market Cap. |
|---|---|
| JBS N.V. | 32B |
| The Kraft Heinz Company | 28.9B |
| General Mills, Inc. | 24.9B |
| McCormick & Company, Incorporated | 18.1B |
| Hormel Foods Corporation | 12.9B |
| The J. M. Smucker Company | 10.3B |
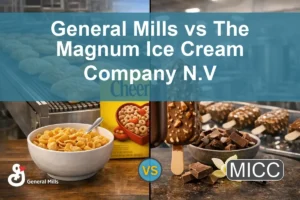
| The Magnum Ice Cream Company N.V. | 9.7B |
| Pilgrim’s Pride Corporation | 9.3B |
| Conagra Brands, Inc. | 8.3B |
| Campbell Soup Company | 8.3B |
Hormel Foods Corporation ranks 5th among its 11 competitors with a market cap representing 42.31% of the leader JBS N.V. It is positioned below the average market cap of the top 10 competitors (16.2B) but above the median market cap in its sector (10.3B). The company is 33.49% smaller than its closest rival above, McCormick & Company, indicating a moderate gap in scale.
Comparisons with competitors
Check out how we compare the company to its competitors:
Does HRL have a competitive advantage?
Hormel Foods Corporation currently shows a slightly unfavorable competitive position as it is shedding value with a declining return on invested capital (ROIC) compared to its weighted average cost of capital (WACC). The company’s profitability is decreasing, indicating challenges in maintaining a strong economic moat.
Looking ahead, Hormel’s extensive product portfolio across various food segments and its presence in both U.S. and international markets may offer opportunities for growth and market expansion. However, recent unfavorable income statement trends suggest that future success will depend on effectively leveraging these opportunities.
SWOT Analysis
This SWOT analysis highlights key internal and external factors affecting Hormel Foods Corporation to assist in strategic investment decisions.
Strengths
- Strong brand portfolio including SKIPPY and SPAM
- Low beta indicating lower volatility
- Favorable debt and liquidity ratios
- Consistent dividend yield near 4.85%
Weaknesses
- Declining net margin and EPS growth
- Decreasing ROIC indicating value erosion
- Unfavorable revenue and profit growth trends
- Moderate PE ratio signaling valuation concerns
Opportunities
- Expansion in international markets with rising Non-US revenue
- Innovation in nutritional and shelf-stable products
- Potential to improve operational efficiencies and margins
Threats
- Increasing competition in packaged foods sector
- Raw material cost volatility impacting margins
- Economic uncertainties affecting consumer spending
Overall, Hormel Foods shows solid financial stability with strong liquidity and brand recognition, but recent profitability declines and growth challenges require strategic focus on innovation and market expansion to sustain long-term value creation.
Stock Price Action Analysis
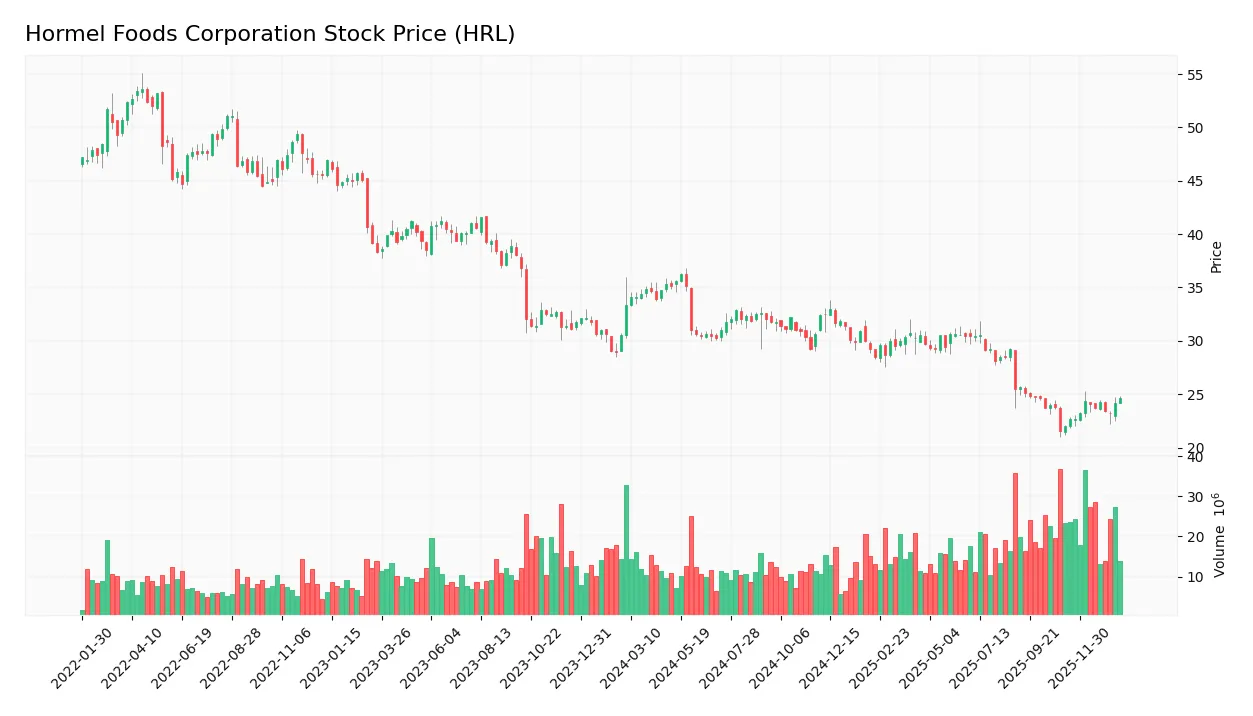
The weekly stock chart for Hormel Foods Corporation (HRL) over the past 12 months illustrates its price fluctuations and trend behavior:
Trend Analysis
Over the past 12 months, HRL’s stock price declined by 26.28%, indicating a bearish trend with accelerating downward momentum. The price ranged between a high of 36.31 and a low of 21.59, with notable volatility as shown by a standard deviation of 3.53. However, since November 2025, a recent 11.67% price increase signals a short-term recovery phase.
Volume Analysis
In the last three months, trading volume has been increasing, with a buyer-dominant profile at 65.66%. Buyer volume of 180M exceeds seller volume of 94M, suggesting improving investor confidence and stronger market participation favoring demand for HRL shares.
Target Prices
The consensus target price for Hormel Foods Corporation indicates moderate upside potential.
| Target High | Target Low | Consensus |
|---|---|---|
| 30 | 26 | 27.75 |
Analysts expect the stock to trade between $26 and $30, with a consensus target near $27.75, reflecting cautious optimism in the near term.

Don’t Let Luck Decide Your Entry Point
Optimize your entry points with our advanced ProRealTime indicators. You’ll get efficient buy signals with precise price targets for maximum performance. Start outperforming now!
Analyst & Consumer Opinions
This section examines recent analyst ratings and consumer feedback regarding Hormel Foods Corporation (HRL).
Stock Grades
The following table presents recent verified stock grades for Hormel Foods Corporation from established financial institutions:
| Grading Company | Action | New Grade | Date |
|---|---|---|---|
| Barclays | Maintain | Overweight | 2025-12-09 |
| JP Morgan | Maintain | Overweight | 2025-12-05 |
| B of A Securities | Maintain | Neutral | 2025-12-05 |
| Piper Sandler | Maintain | Neutral | 2025-12-05 |
| JP Morgan | Maintain | Overweight | 2025-11-21 |
| Piper Sandler | Maintain | Neutral | 2025-11-06 |
| Goldman Sachs | Maintain | Buy | 2025-10-30 |
| Goldman Sachs | Maintain | Buy | 2025-08-29 |
| B of A Securities | Maintain | Neutral | 2025-08-29 |
| Barclays | Maintain | Overweight | 2025-08-29 |
The overall trend shows consistent maintenance of existing ratings, with a mix of Overweight and Neutral grades predominating. Notably, Goldman Sachs has consistently rated the stock as Buy, indicating some confidence among top-tier analysts.
Consumer Opinions
Consumers have expressed a mix of enthusiasm and concern regarding Hormel Foods Corporation, reflecting diverse experiences with its products and services.
| Positive Reviews | Negative Reviews |
|---|---|
| “Hormel offers consistently high-quality meats that my family enjoys.” | “Some products have seen price increases without noticeable quality improvements.” |
| “I appreciate their commitment to sustainable sourcing and innovation.” | “Customer service response times can be slow during peak seasons.” |
| “Their variety of ready-to-eat meals is convenient and tasty for busy days.” | “Packaging could be more eco-friendly and less wasteful.” |
Overall, consumers praise Hormel Foods for product quality and innovation but consistently note concerns about pricing, customer service responsiveness, and environmental packaging practices.
Risk Analysis
Below is a summary table highlighting key risks associated with Hormel Foods Corporation (HRL) to assist investors in understanding potential challenges:
| Category | Description | Probability | Impact |
|---|---|---|---|
| Market Valuation | High P/E ratio (27.3) suggests the stock may be overvalued. | Medium | Medium |
| Profitability | Unfavorable net margin (3.95%) and ROE (6.05%) indicate weak profitability. | High | Medium |
| Competitive Pressure | Intense competition in packaged foods could erode market share. | Medium | High |
| Supply Chain Risks | Disruptions affecting raw material costs and product availability. | Medium | High |
| Economic Sensitivity | Consumer spending shifts may impact demand despite defensive sector. | Low | Medium |
| Financial Health | Favorable Altman Z-Score (3.53) and Piotroski Score (7) reduce bankruptcy risk. | Low | Low |
The most significant risks are the company’s relatively weak profitability metrics and potential supply chain disruptions, which could materially affect earnings. However, HRL’s solid financial health and favorable debt ratios provide a cushion against these challenges.
Should You Buy Hormel Foods Corporation?
Hormel Foods appears to be exhibiting moderate profitability with operational efficiency under pressure, as its competitive moat seems slightly unfavorable due to declining ROIC. Despite a manageable leverage profile and a B rating suggesting a very favorable overall standing, caution is advised in this analytical interpretation.
Strength & Efficiency Pillars
Hormel Foods Corporation demonstrates solid financial health, underscored by an Altman Z-Score of 3.53, placing it comfortably in the safe zone against bankruptcy risk. The Piotroski Score of 7 further confirms strong operational and financial fundamentals. Favorable leverage metrics, including a debt-to-equity ratio of 0.36 and a current ratio of 2.47, reinforce liquidity strength. While the return on invested capital (ROIC) at 5.24% marginally exceeds the weighted average cost of capital (WACC) at 4.95%, the company can be considered a modest value creator, supported also by a reliable interest coverage ratio of 9.51.
Weaknesses and Drawbacks
Despite a favorable financial structure, Hormel’s profitability metrics are under pressure with a net margin of 3.95% and return on equity at 6.05%, both flagged as unfavorable. The price-to-earnings ratio of 27.31 suggests the stock trades at a premium, which could heighten valuation risk amid slowing earnings growth. The company faces multiple unfavorable growth trends, including a 41.51% decline in net margin growth over the last year and a -47.38% drop in net income over the overall period. These headwinds, combined with a bearish long-term stock trend and a 26.28% price decline, highlight potential near-term market challenges.
Our Verdict about Hormel Foods Corporation
Hormel Foods presents a fundamentally moderate profile with favorable liquidity and financial stability but flagged profitability and growth concerns. Despite the overall bearish trend, the recent period shows buyer dominance with a 65.66% buyer volume share, suggesting a nascent technical recovery. Therefore, while the profile might appear attractive for long-term exposure due to financial health, recent market dynamics and valuation pressures could warrant a cautious, wait-and-see approach for a more opportune entry.
Disclaimer: This content is for informational purposes only and does not constitute financial, investment, or other professional advice. Investing in financial markets involves a significant risk of loss, and past performance is not indicative of future results.
Additional Resources
- TrueMark Investments LLC Buys 135,752 Shares of Hormel Foods Corporation $HRL – MarketBeat (Jan 24, 2026)
- Domenic Borrelli’s Retail Promotion Could Be A Game Changer For Hormel Foods (HRL) – simplywall.st (Jan 24, 2026)
- Hormel Foods International Sales: Still a Growth Engine? – Yahoo Finance (Jan 21, 2026)
- What to expect from Hormel Foods’ next quarterly earnings report – MSN (Jan 22, 2026)
- Hormel Foods Corporation Announces 60th Consecutive Increase to the Annual Dividend – Hormel Foods (Nov 24, 2025)
For more information about Hormel Foods Corporation, please visit the official website: hormelfoods.com