Home > Analyses > Industrials > Honeywell International Inc.
Honeywell International Inc. powers critical systems that keep airplanes flying safely and buildings running efficiently worldwide. Its cutting-edge aerospace technology, advanced building controls, and innovative safety solutions set industry standards. Honeywell’s deep expertise across diverse industrial sectors fuels its reputation for quality and market influence. As the company navigates evolving global demands, I ask: do its core strengths still justify its premium valuation and growth outlook?

Table of contents
Business Model & Company Overview
Honeywell International Inc., founded in 1906 and headquartered in Charlotte, NC, stands as a diversified technology and manufacturing powerhouse. It commands a dominant position across aerospace, building technologies, performance materials, and safety solutions, forming a cohesive ecosystem that integrates advanced hardware, software, and services to enhance operational efficiency and safety worldwide.
The company’s revenue engine balances hardware sales with software applications and recurring services, spanning multiple global markets including the Americas, Europe, and Asia. Its broad portfolio ranges from propulsion engines and avionics to building control systems and personal protection equipment. Honeywell’s enduring economic moat lies in its deep technological integration and global scale, shaping the future of industrial innovation.
Financial Performance & Fundamental Metrics
I analyze Honeywell International Inc.’s income statement, key financial ratios, and dividend payout policy to assess its core financial health and shareholder value.
Income Statement
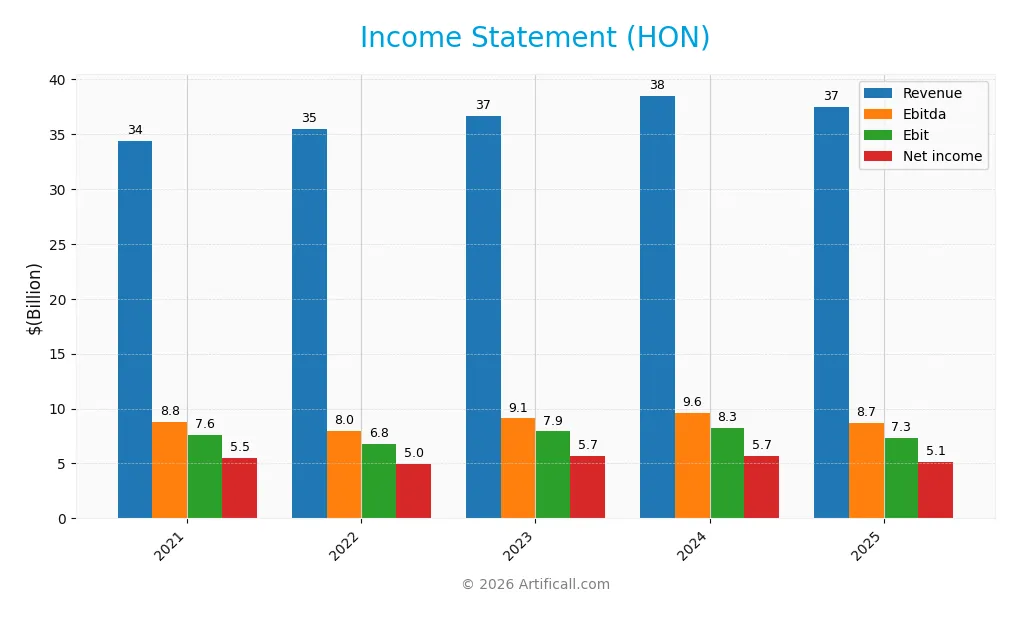
The table below summarizes Honeywell International Inc.’s key income statement figures for fiscal years 2021 through 2025 in USD.
| 2021 | 2022 | 2023 | 2024 | 2025 | |
|---|---|---|---|---|---|
| Revenue | 34.4B | 35.5B | 36.6B | 38.5B | 37.4B |
| Cost of Revenue | 21.6B | 21.8B | 22.4B | 23.7B | 23.6B |
| Operating Expenses | 6.0B | 6.4B | 6.4B | 6.9B | 7.2B |
| Gross Profit | 12.8B | 13.6B | 14.3B | 14.8B | 13.8B |
| EBITDA | 8.8B | 8.0B | 9.1B | 9.6B | 8.7B |
| EBIT | 7.6B | 6.8B | 7.9B | 8.3B | 7.3B |
| Interest Expense | 343M | 414M | 765M | 1.1B | 1.3B |
| Net Income | 5.5B | 5.0B | 5.7B | 5.7B | 5.1B |
| EPS | 8.01 | 7.33 | 8.53 | 8.76 | 8.03 |
| Filing Date | 2022-02-11 | 2023-02-10 | 2024-02-16 | 2025-02-14 | 2026-02-17 |
Income Statement Evolution
Honeywell’s revenue grew 8.9% from 2021 to 2025 but declined 2.7% in the latest year. Net income fell 7.3% overall and 7.4% in 2025, reflecting margin pressure. Gross and EBIT margins remain favorable at 36.9% and 19.5%, though both contracted recently, signaling a tougher operating environment.
Is the Income Statement Favorable?
In 2025, Honeywell reported $37.4B revenue and $5.1B net income with a 13.7% net margin, all favorable compared to sector benchmarks. However, revenue, EBIT, and net margin all declined year-over-year, dragging the overall income statement toward an unfavorable assessment. The modest EPS growth over five years offers some stability amid recent softness.
Financial Ratios
The following table presents key financial ratios for Honeywell International Inc. over the last five fiscal years, illustrating its profitability, liquidity, leverage, and market valuation:
| Ratios | 2021 | 2022 | 2023 | 2024 | 2025 |
|---|---|---|---|---|---|
| Net Margin | 16% | 14% | 15% | 15% | 14% |
| ROE | 30% | 30% | 36% | 31% | 33% |
| ROIC | 10% | 12% | 13% | 10% | 9% |
| P/E | 26.0 | 29.2 | 24.6 | 25.8 | 24.3 |
| P/B | 7.8 | 8.7 | 8.8 | 7.9 | 8.1 |
| Current Ratio | 1.30 | 1.25 | 1.27 | 1.31 | 1.32 |
| Quick Ratio | 1.04 | 0.98 | 0.93 | 1.01 | 1.05 |
| D/E | 1.11 | 1.23 | 1.36 | 1.73 | 2.24 |
| Debt-to-Assets | 32% | 33% | 35% | 43% | 47% |
| Interest Coverage | 20.0 | 17.5 | 10.3 | 7.4 | 4.9 |
| Asset Turnover | 0.53 | 0.57 | 0.60 | 0.51 | 0.51 |
| Fixed Asset Turnover | 6.18 | 6.48 | 6.47 | 6.22 | 8.09 |
| Dividend Yield | 1.8% | 1.9% | 2.1% | 2.0% | 2.4% |
Evolution of Financial Ratios
From 2021 to 2025, Honeywell’s Return on Equity (ROE) showed volatility but remained robust, peaking at 35.68% in 2023 and ending at 33.28% in 2025. The Current Ratio held steady around 1.3, indicating consistent liquidity. Debt-to-Equity Ratio increased notably from 1.11 in 2021 to 2.24 in 2025, signaling rising leverage. Profit margins declined slightly, with net margin dropping from 16.12% in 2021 to 13.73% in 2025.
Are the Financial Ratios Fovorable?
Honeywell’s 2025 ratios present a slightly favorable profile. Profitability metrics like ROE (33.28%) and net margin (13.73%) are favorable, reflecting solid returns above the sector average. Liquidity is neutral to favorable, with a Current Ratio of 1.32 and Quick Ratio at 1.05. Leverage is unfavorable, given a high Debt-to-Equity ratio of 2.24. Valuation multiples show mixed signals, with an unfavorable Price-to-Book ratio at 8.07 but neutral Price-to-Earnings at 24.26.
Shareholder Return Policy
Honeywell International Inc. maintains a dividend payout ratio around 50-58%, with a steadily rising dividend per share reaching $4.66 in 2025 and a yield near 2.4%. The company supports distributions through robust free cash flow and complements dividends with share buybacks.
This balanced approach aligns with sustainable long-term shareholder value creation. The dividend coverage by free cash flow and controlled buybacks suggest prudent capital allocation, minimizing risks of over-distribution despite a moderate leverage profile.
Score analysis
The following radar chart illustrates Honeywell International Inc.’s key financial scores across valuation, profitability, and leverage metrics:
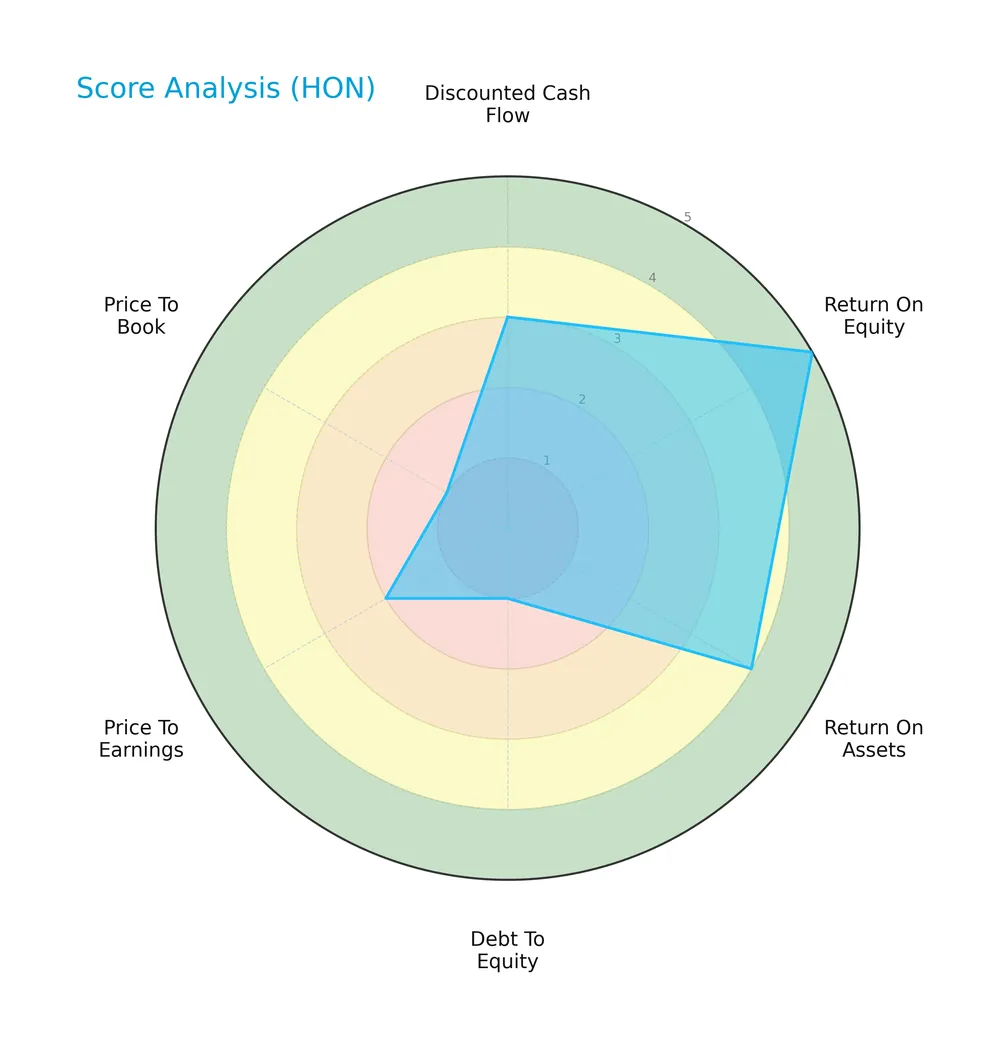
Honeywell scores moderately on discounted cash flow (3) and overall score (3). It excels in return on equity (5) and return on assets (4), but shows significant weakness in debt to equity (1), price to earnings (2), and price to book (1).
Analysis of the company’s bankruptcy risk
The Altman Z-Score places Honeywell in the grey zone, indicating a moderate risk of financial distress and potential bankruptcy:

Is the company in good financial health?
The Piotroski Score diagram offers insights into Honeywell’s financial health based on profitability, leverage, liquidity, and efficiency:

With a Piotroski Score of 6, Honeywell demonstrates average financial strength, suggesting it maintains decent operational and balance sheet health but has room for improvement.
Competitive Landscape & Sector Positioning
This sector analysis explores Honeywell International Inc.’s strategic positioning, revenue segments, and key products. It examines main competitors and identifies competitive advantages. I will assess whether Honeywell holds a sustainable edge over its rivals.
Strategic Positioning
Honeywell International Inc. maintains a diversified product portfolio spanning Aerospace, Building Technologies, Safety, and Energy Solutions. Its revenue is well distributed geographically, with significant exposure to the United States (22B), Europe (8.1B), and Other International markets (7.5B).
Revenue by Segment
The pie chart illustrates Honeywell International Inc.’s revenue distribution by business segment for the fiscal year 2025, highlighting the company’s latest business mix and segment contributions.
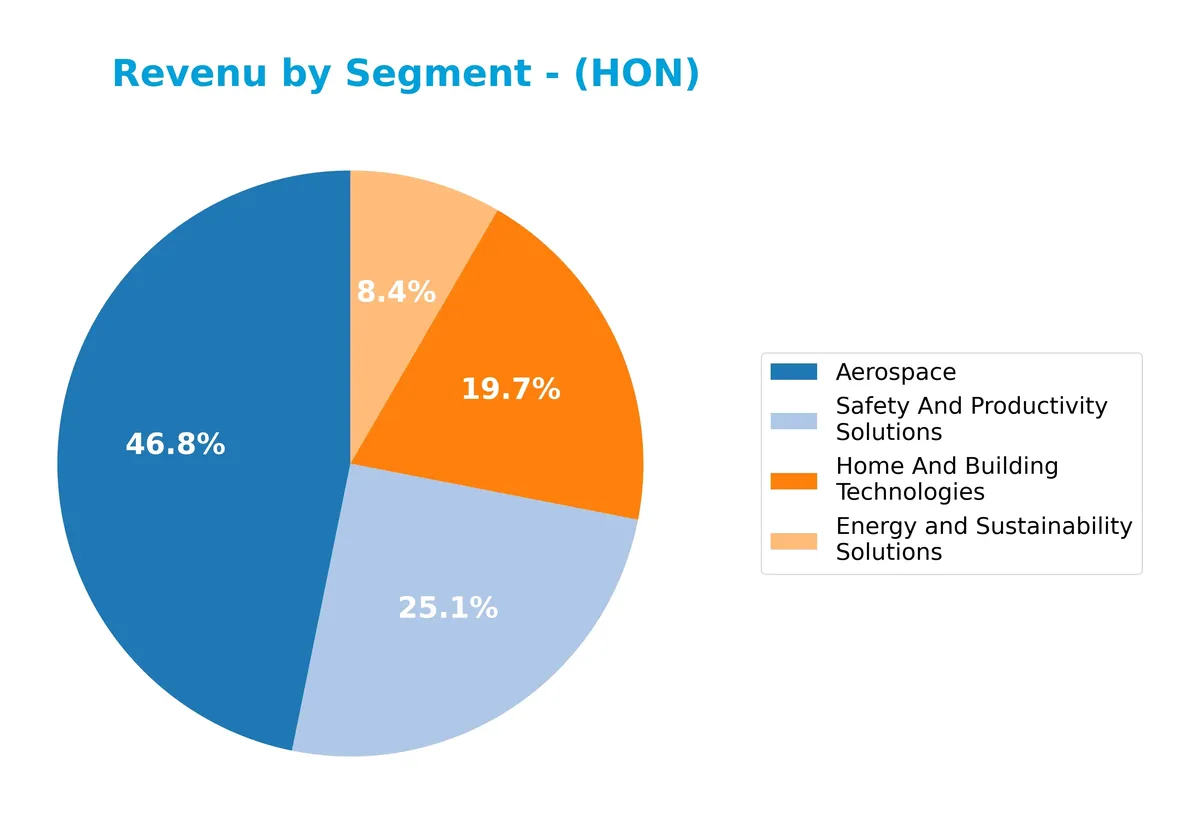
In 2025, Aerospace leads with $17.5B, reflecting its core strength and steady growth. Safety and Productivity Solutions declined to $9.4B from prior levels, signaling some pressure. Home and Building Technologies remains stable at $7.4B. Energy and Sustainability Solutions dropped sharply to $3.1B, indicating a major segmental shift and concentration risk. Overall, Aerospace drives Honeywell’s portfolio, but the recent contraction in other segments warrants cautious monitoring.
Key Products & Brands
The table below outlines Honeywell International Inc.’s main products and brands by business segment:
| Product | Description |
|---|---|
| Aerospace | Auxiliary power units, propulsion engines, avionics, engine controls, flight safety, communications, radar, and more. |
| Home And Building Technologies | Building control software, energy management sensors, access control, video surveillance, fire products, installation services. |
| Safety And Productivity Solutions | Personal protection equipment, gas detection, cloud-based emergency messaging, warehouse automation, productivity software. |
| Performance Materials And Technologies | Automation control, catalysts, materials for bullet-resistant armor, pharmaceuticals, reduced global-warming-potential materials. |
| Energy and Sustainability Solutions | Solutions focused on energy efficiency and sustainability, including related equipment and consulting services. |
Honeywell’s product portfolio spans advanced aerospace systems, building technology, safety gear, high-performance materials, and energy sustainability. This diversified range supports its industrial market leadership.
Main Competitors
There are 2 competitors in the Industrials conglomerates sector; here are the top 10 leaders by market capitalization:
| Competitor | Market Cap. |
|---|---|
| Honeywell International Inc. | 124B |
| 3M Company | 86B |
Honeywell International Inc. ranks 1st among its competitors with a market cap 24% above the top player benchmark. It sits above both the average market cap of the top 10 and the sector median. The company leads by a substantial 79% margin over its nearest competitor, 3M Company.
Comparisons with competitors
Check out how we compare the company to its competitors:
Does Honeywell have a competitive advantage?
Honeywell demonstrates a competitive advantage by creating value with an ROIC 2.2% above its WACC, signaling efficient capital use and excess returns. However, its profitability shows a declining trend, which is a cautionary sign for sustainability.
The company’s diverse technology segments and global presence in aerospace, building technologies, and safety solutions offer multiple opportunities for growth. Future prospects include expanding software applications, energy management systems, and low global-warming-potential materials, supporting potential market and product development.
SWOT Analysis
This analysis highlights Honeywell International Inc.’s key strategic factors to guide investment decisions.
Strengths
- diversified technology portfolio
- strong ROE at 33%
- favorable net margin of 13.7%
Weaknesses
- recent 1-year revenue and profit declines
- elevated debt-to-equity ratio at 2.24
- high price-to-book ratio at 8.07
Opportunities
- expansion in global aerospace and building tech
- innovation in low global-warming materials
- growth potential in emerging markets
Threats
- geopolitical risks impacting international sales
- supply chain disruptions
- increasing raw material costs
Honeywell’s strengths in diversified industrial tech and profitability support resilience. However, recent earnings softness and leverage warrant caution. Strategic focus should target innovation and geographic growth while managing debt and external risks.
Stock Price Action Analysis
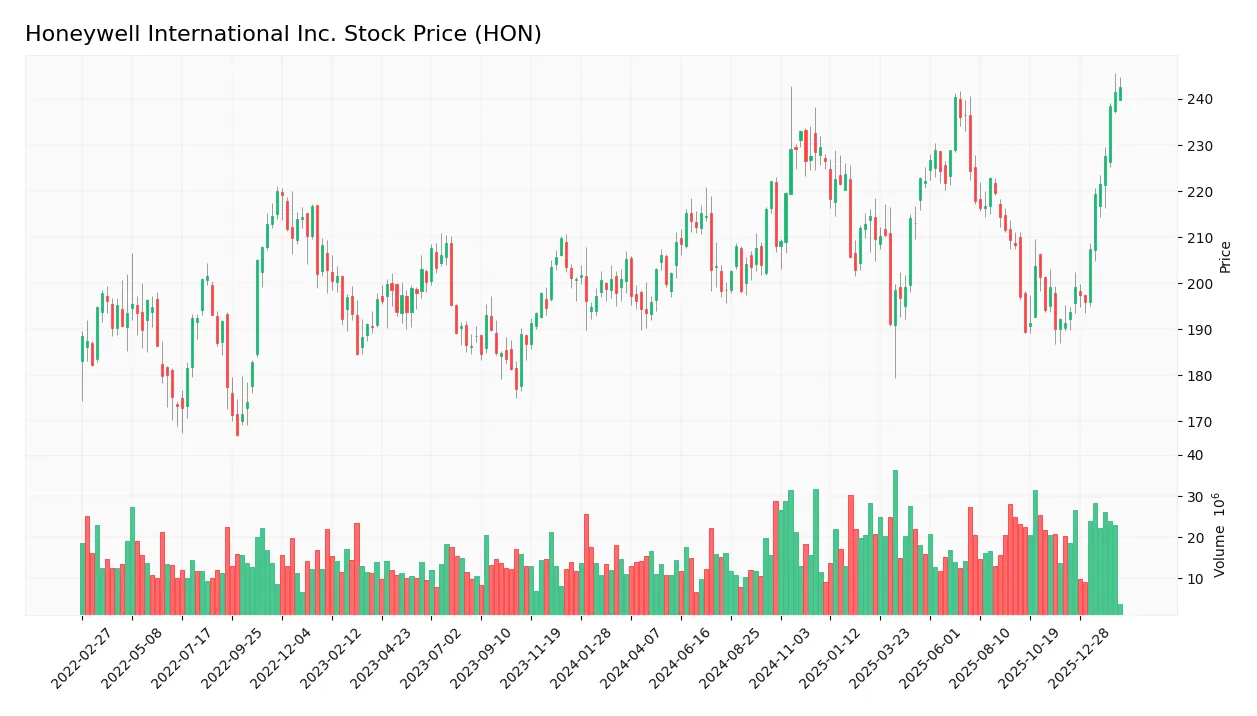
The weekly stock chart below illustrates Honeywell International Inc.’s price movements and volatility trends over the past 12 months:
Trend Analysis
Over the past 12 months, HON’s stock price increased by 18.22%, indicating a bullish trend with clear acceleration. The price ranged between 189.29 and 242.65, showing notable highs. Volatility was elevated, with a standard deviation of 13.26, confirming active price fluctuations throughout the period.
Volume Analysis
Trading volumes have been increasing, with buyers dominating 56.41% of total activity over the full year. In the recent period, buyer volume surged to 83.37%, signaling strong buyer dominance. This suggests heightened investor confidence and robust market participation, reinforcing the bullish price momentum.
Target Prices
Analysts set a clear target consensus for Honeywell International Inc., reflecting confident upside potential.
| Target Low | Target High | Consensus |
|---|---|---|
| 195 | 268 | 241.92 |
The target range indicates a bullish outlook, with an average expectation near $242, suggesting solid growth prospects ahead.

Don’t Let Luck Decide Your Entry Point
Optimize your entry points with our advanced ProRealTime indicators. You’ll get efficient buy signals with precise price targets for maximum performance. Start outperforming now!
Analyst & Consumer Opinions
This section examines Honeywell International Inc.’s analyst ratings and consumer feedback to assess overall market sentiment.
Stock Grades
Here is a clear overview of the latest Honeywell International Inc. grades from leading financial institutions:
| Grading Company | Action | New Grade | Date |
|---|---|---|---|
| Barclays | Maintain | Overweight | 2026-01-30 |
| JP Morgan | Maintain | Overweight | 2026-01-30 |
| Wells Fargo | Maintain | Equal Weight | 2026-01-30 |
| RBC Capital | Maintain | Outperform | 2026-01-30 |
| Citigroup | Maintain | Buy | 2026-01-30 |
| JP Morgan | Upgrade | Overweight | 2026-01-16 |
| Citigroup | Maintain | Buy | 2026-01-12 |
| Wells Fargo | Maintain | Equal Weight | 2026-01-07 |
| Mizuho | Maintain | Outperform | 2026-01-05 |
| Barclays | Maintain | Overweight | 2025-12-24 |
The overall trend shows strong confidence in Honeywell, with multiple firms maintaining overweight or outperform ratings. JP Morgan notably upgraded its stance recently, signaling growing optimism.
Consumer Opinions
Consumer sentiment around Honeywell International Inc. reflects a mix of admiration for product reliability and frustration with customer service responsiveness.
| Positive Reviews | Negative Reviews |
|---|---|
| Products consistently deliver high performance. | Customer support can be slow and unhelpful. |
| Innovative solutions meet complex industrial needs. | Pricing feels steep compared to competitors. |
| Durable and long-lasting equipment praised. | Occasional delays in product delivery. |
Overall, consumers praise Honeywell’s durable, innovative products, reinforcing its strong market position. However, service delays and pricing concerns temper satisfaction and warrant attention.
Risk Analysis
Below is a summary table outlining Honeywell International Inc.’s key risk categories, their descriptions, probabilities, and potential impacts:
| Category | Description | Probability | Impact |
|---|---|---|---|
| Leverage Risk | Elevated debt-to-equity ratio at 2.24 signals higher financial leverage, increasing default risk | Medium | High |
| Valuation Risk | Unfavorable price-to-book (8.07) and price-to-earnings (24.26) ratios may limit upside | Medium | Medium |
| Liquidity Risk | Current ratio at 1.32 is adequate but not robust, potentially constraining short-term flexibility | Low | Medium |
| Profitability Risk | ROIC at 9.33% barely exceeds WACC at 7.13%, limiting value creation expansion | Medium | Medium |
| Market Volatility | Beta at 0.93 indicates moderate sensitivity to market swings | Medium | Medium |
| Bankruptcy Risk | Altman Z-score of 2.58 places the company in the grey zone, implying moderate distress risk | Low | High |
The most pressing risks are Honeywell’s relatively high leverage and borderline Altman Z-score, which signal vulnerability during economic downturns. Despite solid profitability and favorable return on equity, the company’s debt load and valuation multiples pose caution. I observed that in cyclical sectors like industrials, elevated debt can exacerbate downturn impacts. Investors should monitor debt trends closely.
Should You Buy Honeywell International Inc.?
Honeywell International Inc. appears to be generating robust value creation with a slightly favorable moat despite a declining ROIC trend. Its leverage profile seems substantial, reflected in weak debt metrics. Overall, the company suggests a profile rated B, indicating moderate strengths balanced by financial risks.
Strength & Efficiency Pillars
Honeywell International Inc. demonstrates solid operational strength with a net margin of 13.73% and a robust return on equity of 33.28%. Its ROIC stands at 9.33%, comfortably above the WACC of 7.13%, confirming the company as a value creator. I note the company maintains a favorable EBIT margin of 19.47%, reflecting efficient cost management. Although ROIC shows a slight decline, Honeywell’s ability to generate returns exceeding its capital cost remains a key competitive advantage.
Weaknesses and Drawbacks
The Altman Z-Score of 2.59 places Honeywell in the grey zone, signaling moderate bankruptcy risk that warrants caution. The company’s elevated debt-to-equity ratio of 2.24 raises leverage concerns, increasing financial vulnerability during downturns. Valuation metrics also raise red flags: a high price-to-book ratio of 8.07 suggests the stock is expensive relative to its net assets. While the current ratio at 1.32 is neutral, it provides limited liquidity buffer against short-term liabilities.
Our Final Verdict about Honeywell International Inc.
Honeywell presents a fundamentally sound profile with clear value creation and operational efficiency. Despite a bullish stock trend and strong recent buyer dominance, the moderate solvency risk implied by the Altman Z-Score suggests prudence. Investors might consider a wait-and-see stance to better assess risk exposure before committing capital. Overall, the profile may appear attractive for those with a higher risk tolerance but remains cautiously speculative.
Disclaimer: This content is for informational purposes only and does not constitute financial, investment, or other professional advice. Investing in financial markets involves a significant risk of loss, and past performance is not indicative of future results.
Additional Resources
- Honeywell revises FY 2025 financials after additional impairment charges (HON:NASDAQ) – Seeking Alpha (Feb 17, 2026)
- Decoding Honeywell International Inc (HON): A Strategic SWOT Ins – GuruFocus (Feb 18, 2026)
- Honeywell International Inc. (NASDAQ:HON) Receives Average Recommendation of “Moderate Buy” from Brokerages – MarketBeat (Feb 18, 2026)
- Jefferies sees steady performance at Honeywell International Inc. (HON), raises PT to $240 – MSN (Feb 17, 2026)
- CenterBook Partners LP Boosts Stock Position in Honeywell International Inc. $HON – MarketBeat (Feb 18, 2026)
For more information about Honeywell International Inc., please visit the official website: honeywell.com