Home > Analyses > Healthcare > Hologic, Inc.
Hologic, Inc. transforms women’s healthcare by pioneering advanced diagnostic and surgical technologies that empower early detection and effective treatment. Renowned for its leadership in medical instruments and supplies, Hologic’s flagship offerings include cutting-edge molecular diagnostics, breast imaging systems, and minimally invasive surgical tools. With a strong reputation for innovation and quality, the company shapes critical healthcare outcomes worldwide. As investors, the key question remains: do Hologic’s robust fundamentals and growth prospects still support its current market valuation?

Table of contents
Business Model & Company Overview
Hologic, Inc., founded in 1985 and headquartered in Marlborough, Massachusetts, stands as a key player in the Medical – Instruments & Supplies sector. The company delivers a comprehensive ecosystem centered on women’s health, integrating diagnostics, medical imaging, and surgical products. Its portfolio spans molecular diagnostic assays, breast health technologies, and minimally invasive surgical systems, forming a cohesive mission to advance early detection and treatment globally.
The company’s revenue engine is driven by a balanced mix of hardware platforms like digital mammography systems and surgical devices, combined with recurring revenue from diagnostic assays and software-enabled analytics. Hologic maintains a strong presence across the Americas, Europe, and Asia-Pacific, leveraging direct sales and distributor networks. Its robust product integration and global footprint create a durable economic moat, positioning it as an influential force shaping the future of women’s healthcare.
Financial Performance & Fundamental Metrics
In this section, I analyze Hologic, Inc.’s income statement, key financial ratios, and dividend payout policy to assess its fundamental strength.
Income Statement
The table below summarizes Hologic, Inc.’s annual income statement figures over the last five fiscal years, providing a clear view of its financial performance.

| 2021 | 2022 | 2023 | 2024 | 2025 | |
|---|---|---|---|---|---|
| Revenue | 5.63B | 4.86B | 4.03B | 4.03B | 4.10B |
| Cost of Revenue | 1.84B | 1.87B | 1.96B | 1.80B | 1.60B |
| Operating Expenses | 1.32B | 1.36B | 1.40B | 1.35B | 1.79B |
| Gross Profit | 3.80B | 3.00B | 2.07B | 2.23B | 2.50B |
| EBITDA | 2.86B | 2.11B | 1.11B | 1.30B | 1.02B |
| EBIT | 2.45B | 1.68B | 0.79B | 0.99B | 0.72B |
| Interest Expense | 94M | 95M | 111M | 122M | 43M |
| Net Income | 1.87B | 1.30B | 456M | 790M | 566M |
| EPS | 7.28 | 5.18 | 1.85 | 3.35 | 2.50 |
| Filing Date | 2021-11-16 | 2022-11-15 | 2023-11-21 | 2024-11-27 | 2025-10-21 |
Income Statement Evolution
From 2021 to 2025, Hologic, Inc. experienced a significant decline in both revenue and net income, with revenue dropping from $5.63B to $4.10B and net income falling sharply from $1.87B to $566M. Margins showed mixed trends: gross margin remained favorable at 61.0%, but net margin contracted by 58.48% over the period, reflecting pressure on profitability despite a stable gross profit growth in the most recent year.
Is the Income Statement Favorable?
In 2025, Hologic reported $4.10B in revenue, a 1.74% increase from 2024, but net income decreased by 29.57% to $566M, with EPS declining 25% to $2.50. EBIT margin stayed favorable at 17.65%, and interest expense was well controlled at 1.04% of revenue. Overall, despite some strong margin metrics, the income statement fundamentals are assessed as unfavorable due to declining profitability and earnings growth.
Financial Ratios
The following table presents key financial ratios for Hologic, Inc. (HOLX) over the fiscal years 2021 to 2025, providing insight into profitability, valuation, liquidity, leverage, and efficiency:
| Ratios | 2021 | 2022 | 2023 | 2024 | 2025 |
|---|---|---|---|---|---|
| Net Margin | 33% | 27% | 11% | 20% | 14% |
| ROE | 44% | 27% | 9% | 15% | 11% |
| ROIC | 25% | 16% | 5% | 10% | 7% |
| P/E | 10.1 | 12.5 | 37.6 | 24.3 | 27.0 |
| P/B | 4.50 | 3.33 | 3.41 | 3.74 | 3.02 |
| Current Ratio | 2.39 | 4.12 | 3.47 | 3.69 | 3.75 |
| Quick Ratio | 2.01 | 3.45 | 2.95 | 3.03 | 3.06 |
| D/E | 0.75 | 0.60 | 0.58 | 0.52 | 0.52 |
| Debt-to-Assets | 35% | 32% | 32% | 29% | 29% |
| Interest Coverage | 26.5 | 17.2 | 6.0 | 7.2 | 16.7 |
| Asset Turnover | 0.63 | 0.54 | 0.44 | 0.44 | 0.45 |
| Fixed Asset Turnover | 8.69 | 8.83 | 6.95 | 6.40 | 6.27 |
| Dividend Yield | 0% | 0% | 0% | 0% | 0% |
Evolution of Financial Ratios
From 2021 to 2025, Hologic, Inc.’s Return on Equity (ROE) declined steadily from 44.36% to 11.21%, indicating a slowdown in profitability. The Current Ratio improved from 2.39 in 2021 to 3.75 in 2025, reflecting stronger liquidity. The Debt-to-Equity Ratio decreased from 0.75 to 0.52, showing moderate deleveraging and greater financial stability over the period.
Are the Financial Ratios Favorable?
In 2025, Hologic’s profitability ratios show a neutral to favorable stance, with a net margin of 13.8% rated favorable and ROE at 11.21% neutral. Liquidity ratios are mixed: the quick ratio is favorable at 3.06, while the current ratio is unfavorable at 3.75. Leverage remains neutral with a debt-to-equity of 0.52, supported by a favorable debt-to-assets ratio of 29.14%. Market valuation ratios such as P/E (27.0) and P/B (3.02) are unfavorable, reflecting high relative valuations. Overall, the ratios suggest a slightly favorable financial condition.
Shareholder Return Policy
Hologic, Inc. does not pay dividends, with a dividend payout ratio and yield consistently at zero. This aligns with a reinvestment strategy focused on growth and operational stability, supported by strong free cash flow and solid operating margins. The company does not report share buyback programs.
The absence of dividends and buybacks suggests a prioritization of capital allocation toward internal investments rather than immediate shareholder distributions. This approach may support sustainable long-term value creation if reinvestments continue to generate positive returns, although shareholders receive no direct income from the stock.
Score analysis
The following radar chart displays Hologic, Inc.’s key financial scores, highlighting its valuation and profitability metrics:
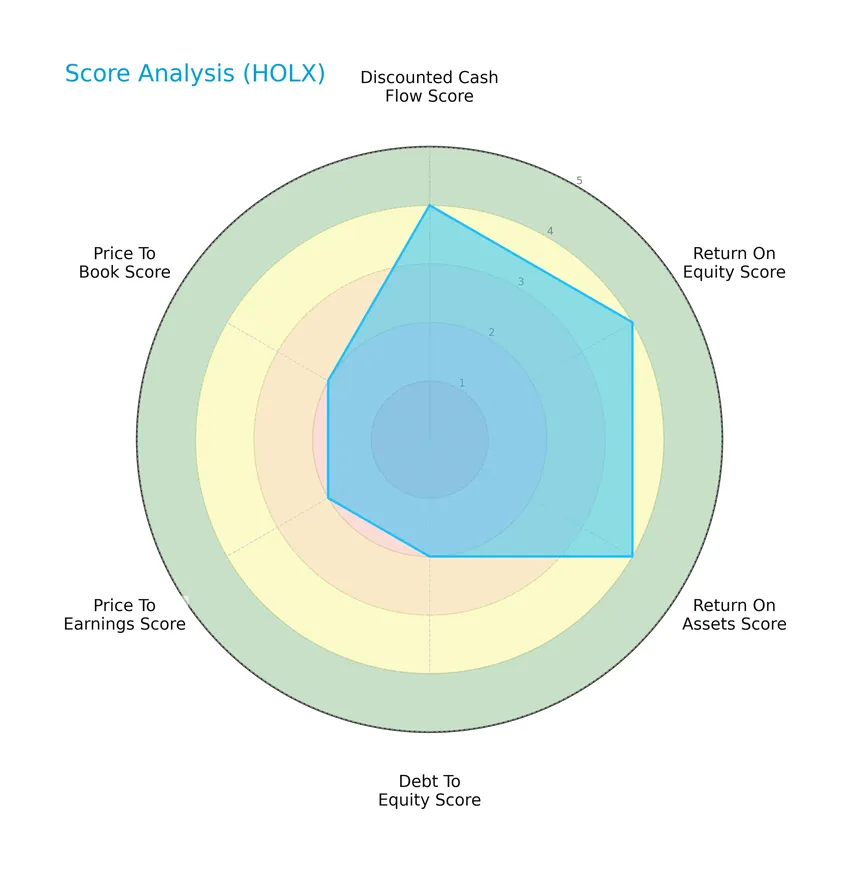
Hologic, Inc. shows favorable scores in discounted cash flow, return on equity, and return on assets, each rated 4, reflecting solid profitability and cash generation. Moderate scores of 2 in debt-to-equity, price-to-earnings, and price-to-book suggest cautious valuation and leverage metrics.
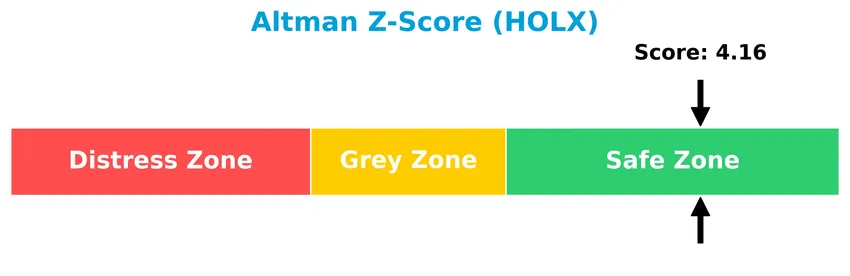
Analysis of the company’s bankruptcy risk
The Altman Z-Score indicates that Hologic, Inc. is in the safe zone, signaling a low risk of bankruptcy and financial stability:
Is the company in good financial health?
The Piotroski Score chart provides insight into Hologic, Inc.’s financial strength based on profitability, leverage, liquidity, and operational efficiency:
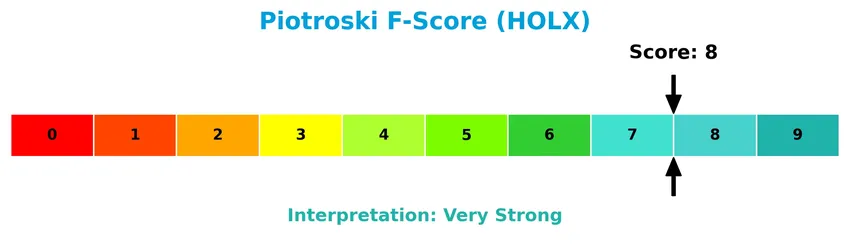
With a Piotroski Score of 8, Hologic, Inc. demonstrates very strong financial health, suggesting robust fundamentals and effective management of its financial resources.
Competitive Landscape & Sector Positioning
This sector analysis will examine Hologic, Inc.’s strategic positioning, revenue by segment, key products, main competitors, competitive advantages, and SWOT analysis. I will assess whether Hologic holds a competitive advantage over its peers in the medical instruments and supplies industry.
Strategic Positioning
Hologic, Inc. maintains a diversified product portfolio across Diagnostics, Breast Health, GYN Surgical, and Skeletal Health segments, with Diagnostics and Breast Health generating the largest revenues in 2024. Geographically, the company is primarily exposed to the U.S. market, contributing over 3B USD, with smaller but consistent sales in Europe, Asia-Pacific, and other regions.
Revenue by Segment
This pie chart illustrates Hologic, Inc.’s revenue distribution by product segment for fiscal year 2024, highlighting the business’s key income sources and their relative sizes.
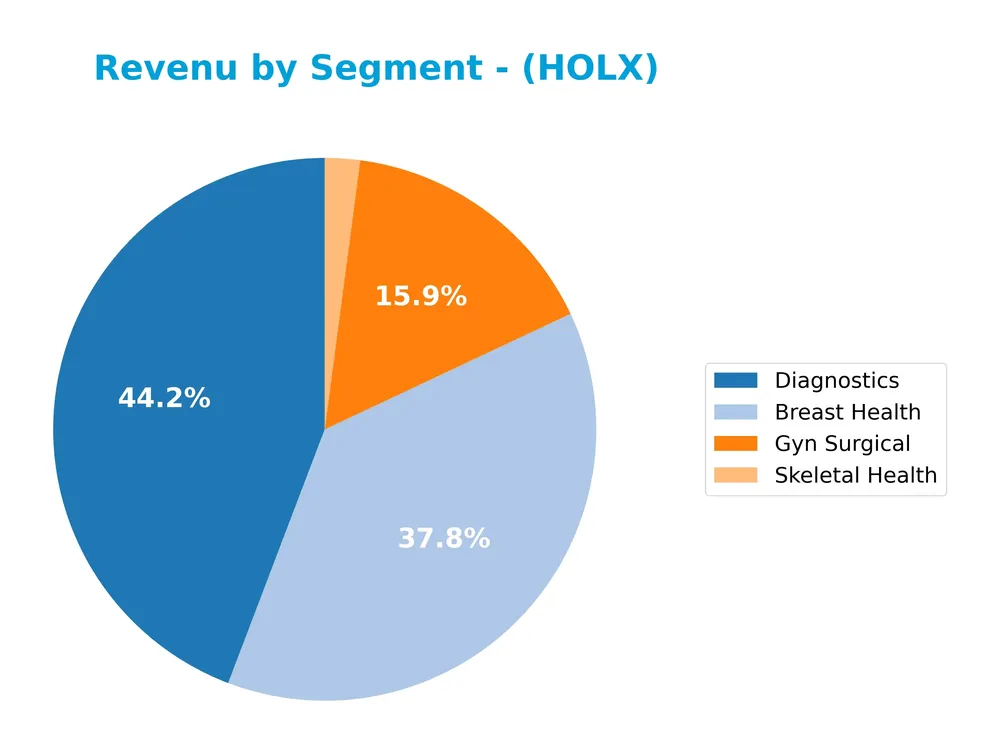
In 2024, Diagnostics and Breast Health remain the primary revenue drivers with $1.78B and $1.52B respectively, showing a shift from prior years when Diagnostics was above $3B. Gyn Surgical and Skeletal Health contribute smaller shares at $641M and $84M. The dip in Diagnostics from previous peaks suggests a recent slowdown or reclassification, emphasizing a more balanced revenue mix but also potential concentration risks in Breast Health.
Key Products & Brands
The following table outlines Hologic, Inc.’s key products and brands with their descriptions:
| Product | Description |
|---|---|
| Aptima Molecular Diagnostic Assays | Tests to detect infectious microorganisms including HIV, Hepatitis B and C, and SARS-CoV-2. |
| ThinPrep System | System used in cytology applications for early detection and diagnosis. |
| Rapid Fetal Fibronectin Test | Test assisting in assessing pre-term birth risk. |
| Breast Imaging and Analytics | Includes 2D and 3D digital mammography systems, biopsy guidance, site markers, specimen radiology, and ultrasound. |
| Breast Conserving Surgery Products | Products used for breast conserving surgical procedures. |
| NovaSure Endometrial Ablation System | Device for treating abnormal uterine bleeding. |
| MyoSure Hysteroscopic Tissue Removal System | System for removing fibroids, polyps, and uterine pathology. |
| Fluent Fluid Management System | Provides liquid distention during diagnostic and operative hysteroscopic procedures. |
| Horizon DXA | Dual energy X-ray system for skeletal health assessment. |
| Fluoroscan Insight FD Mini C-arm | Imaging device for minimally invasive orthopedic surgical procedures. |
Hologic’s product portfolio spans diagnostics, breast health, gynecologic surgical, and skeletal health segments, focusing on women’s health through early detection, treatment, and minimally invasive procedures.
Main Competitors
There are 8 competitors in total in the Medical – Instruments & Supplies industry; the table lists the top 8 leaders by market capitalization:
| Competitor | Market Cap. |
|---|---|
| Intuitive Surgical, Inc. | 201B |
| Becton, Dickinson and Company | 56B |
| ResMed Inc. | 36B |
| West Pharmaceutical Services, Inc. | 20B |
| Hologic, Inc. | 16.6B |
| The Cooper Companies, Inc. | 16.1B |
| Baxter International Inc. | 10B |
| AptarGroup, Inc. | 8.1B |
Hologic, Inc. ranks 5th among its 8 competitors, with a market cap approximately 8.34% that of the leader, Intuitive Surgical, Inc. The company’s market capitalization is below both the average market cap of the top 10 competitors (45.4B) and the median market cap in the sector (18.3B). It is positioned 18.78% below the next competitor above it, West Pharmaceutical Services, indicating a moderate gap in scale.
Comparisons with competitors
Check out how we compare the company to its competitors:
Does HOLX have a competitive advantage?
Hologic, Inc. currently does not present a clear competitive advantage as its return on invested capital (ROIC) is below its weighted average cost of capital (WACC), indicating value is being shed. Additionally, the company’s ROIC trend is declining, reflecting decreasing profitability over the 2021-2025 period.
Looking ahead, Hologic operates across multiple segments including diagnostics, breast health, GYN surgical, and skeletal health, with established markets in the US, Europe, and Asia-Pacific. Its product portfolio targeting women’s health and infectious disease detection positions it to explore new growth opportunities through innovation and geographic expansion.
SWOT Analysis
This SWOT analysis identifies the key internal and external factors affecting Hologic, Inc., aiming to guide investors in understanding its strategic position.
Strengths
- Strong diagnostic and imaging product portfolio
- Favorable gross and net margins (61%, 13.8%)
- Solid financial health with Altman Z-Score in safe zone
- Diverse geographic revenue base, with strong US market presence
Weaknesses
- Declining revenue and net income growth over 5 years
- Negative EPS and EBIT growth trends
- High P/E and P/B ratios indicating possible overvaluation
- Lack of dividend yield may deter income-focused investors
Opportunities
- Expansion in emerging markets beyond US and Europe
- Growth potential in molecular diagnostics and women’s health sectors
- Innovation in minimally invasive surgical technologies
Threats
- Intense competition in medical instruments and diagnostics
- Regulatory risks impacting product approvals
- Economic uncertainties affecting healthcare budgets and spending
Hologic’s strengths in product diversity and financial stability are offset by concerning long-term revenue declines and valuation risks. The company’s strategy should focus on innovation and international expansion while managing competitive and regulatory challenges carefully.
Stock Price Action Analysis
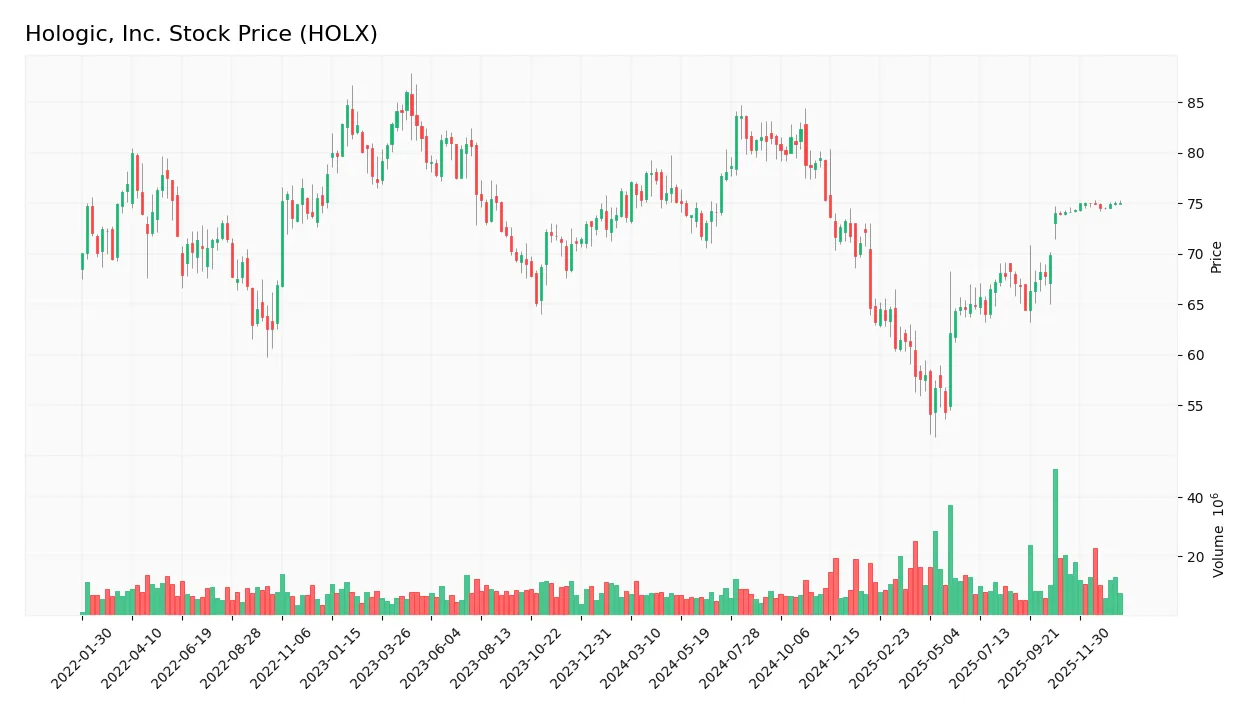
The weekly stock chart of Hologic, Inc. (HOLX) illustrates price movements and trading activity over the analyzed period:
Trend Analysis
Over the past 12 months, HOLX’s stock price increased by 1.9%, indicating a bullish trend with acceleration. The price range fluctuated between a low of 54.16 and a high of 83.64, with a volatility measure (standard deviation) of 7.2. Recent weeks show a milder 1.28% rise, maintaining upward momentum with low volatility.
Volume Analysis
In the last three months, trading volume for HOLX has been increasing and strongly buyer-driven, with buyers accounting for 77.79% of volume. This dominance suggests robust investor interest and positive market participation, reinforcing bullish sentiment in the recent period.
Target Prices
The consensus target prices for Hologic, Inc. reflect moderate upside potential supported by recent analyst evaluations.
| Target High | Target Low | Consensus |
|---|---|---|
| 79 | 76 | 77.8 |
Analysts expect Hologic’s stock price to trade around the high $70s, indicating a stable outlook with limited volatility.

Don’t Let Luck Decide Your Entry Point
Optimize your entry points with our advanced ProRealTime indicators. You’ll get efficient buy signals with precise price targets for maximum performance. Start outperforming now!
Analyst & Consumer Opinions
This section reviews recent analyst ratings and consumer feedback regarding Hologic, Inc. (HOLX) to inform investors.
Stock Grades
The following table presents recent verified grading updates for Hologic, Inc. from recognized financial firms:
| Grading Company | Action | New Grade | Date |
|---|---|---|---|
| Argus Research | Downgrade | Hold | 2026-01-12 |
| Evercore ISI Group | Downgrade | In Line | 2026-01-05 |
| Morgan Stanley | Maintain | Equal Weight | 2025-11-11 |
| Mizuho | Downgrade | Neutral | 2025-10-23 |
| JP Morgan | Downgrade | Neutral | 2025-10-22 |
| Raymond James | Downgrade | Market Perform | 2025-10-22 |
| Stephens & Co. | Downgrade | Equal Weight | 2025-10-22 |
| Leerink Partners | Maintain | Market Perform | 2025-10-21 |
| Needham | Maintain | Hold | 2025-10-21 |
| BTIG | Maintain | Neutral | 2025-10-21 |
Overall, the trend shows several downgrades from outperforming or overweight ratings to more neutral or hold positions, reflecting a cautious stance among analysts with a consensus grade of Hold.
Consumer Opinions
Consumer sentiment around Hologic, Inc. (HOLX) reflects a generally positive outlook with some areas of concern voiced by users.
| Positive Reviews | Negative Reviews |
|---|---|
| “Reliable and innovative diagnostic products.” | “Customer service response times could improve.” |
| “User-friendly medical imaging technology.” | “Pricing is a bit high for smaller clinics.” |
| “Consistent product quality and performance.” | “Software updates occasionally disrupt workflow.” |
Overall, consumers appreciate Hologic’s innovation and product quality but frequently mention customer support delays and pricing as areas needing attention. These insights are crucial for balancing investment risk and potential.
Risk Analysis
Below is a concise table summarizing the key risks associated with investing in Hologic, Inc., focusing on likelihood and potential impact:
| Category | Description | Probability | Impact |
|---|---|---|---|
| Market Valuation | Elevated P/E ratio (26.99) and P/B ratio (3.02) may indicate overvaluation risk | Medium | High |
| Competitive Pressure | Intense competition in medical instruments and diagnostics could pressure margins | Medium | Medium |
| Regulatory Risk | Healthcare product approvals and compliance issues can delay product launches or lead to fines | Low | High |
| Innovation Risk | Dependence on continuous product innovation to maintain market share | Medium | Medium |
| Liquidity Concern | Current ratio at 3.75 flagged as unfavorable, possibly indicating short-term liquidity issues | Low | Medium |
The most critical risks for Hologic are the elevated valuation metrics and regulatory challenges, which could materially affect stock performance. However, the company’s strong Altman Z-Score (4.16) and Piotroski Score (8) suggest solid financial health, mitigating bankruptcy risk despite these concerns.
Should You Buy Hologic, Inc.?
Hologic, Inc. appears to be a company with improving operational efficiency but a slightly unfavorable moat due to declining profitability and value erosion. Despite moderate leverage, its debt profile might be manageable, supported by a very favorable B+ rating suggesting solid financial health overall.
Strength & Efficiency Pillars
Hologic, Inc. presents a robust financial foundation with a net margin of 13.8% and a strong Piotroski score of 8, signaling very strong financial health. The Altman Z-score of 4.16 places the company securely in the safe zone, indicating low bankruptcy risk. While its ROE stands at a moderate 11.21%, the firm maintains an efficient capital structure with a debt-to-assets ratio of 29.14% and a favorable interest coverage of 16.95. Despite a slightly higher WACC of 6.59%, the ROIC at 7.35% suggests Hologic is marginally creating value, though this is under pressure from a declining ROIC trend.
Weaknesses and Drawbacks
Valuation metrics raise caution: Hologic trades at a premium with a P/E of 26.99 and a P/B of 3.02, which may limit upside potential. The current ratio of 3.75, while indicating liquidity, is flagged as unfavorable, possibly reflecting inefficient asset utilization given the low asset turnover of 0.45. Additionally, the company’s revenue and net income have contracted significantly over the 2021-2025 period, with net income declining by 69.77%, pointing to operational challenges. The absence of dividend yield further detracts from income-oriented investor appeal.
Our Verdict about Hologic, Inc.
Hologic’s long-term fundamental profile is moderately favorable, underpinned by solid financial health and adequate profitability metrics. The bullish overall trend, combined with strongly buyer-dominant recent behavior (77.79% buyer volume), suggests positive market sentiment. This profile may appear attractive for long-term exposure, though investors should remain cautious given the premium valuation and recent earnings declines, which could warrant a watchful, selective approach.
Disclaimer: This content is for informational purposes only and does not constitute financial, investment, or other professional advice. Investing in financial markets involves a significant risk of loss, and past performance is not indicative of future results.
Additional Resources
- Hologic, Inc. (HOLX): A Bear Case Theory – Yahoo Finance (Jan 19, 2026)
- Will Hologic (HOLX) Beat Estimates Again in Its Next Earnings Report? – Finviz (Jan 21, 2026)
- Here’s Why Hologic (HOLX) is a Strong Momentum Stock – Nasdaq (Jan 21, 2026)
- Hologic Investor Alert: Kahn Swick & Foti, LLC Investigates Adequacy of Price and Process in Proposed Sale of Hologic, Inc. – HOLX – PR Newswire (Jan 07, 2026)
- The Truth About Hologic Inc: Why This ‘Boring’ Stock Could Be a Silent Game-Changer – AD HOC NEWS (Jan 23, 2026)
For more information about Hologic, Inc., please visit the official website: hologic.com