Home > Analyses > Consumer Cyclical > Hilton Worldwide Holdings Inc.
Hilton Worldwide transforms travel with iconic hotels that shape millions of guest experiences globally. Its portfolio spans luxury to midscale, including Waldorf Astoria and Hampton by Hilton, blending innovation with consistent quality. As a dominant player in the lodging sector, Hilton’s brand power and geographic reach set it apart. Yet, in an evolving travel landscape, I ask: do Hilton’s current fundamentals support its premium valuation and growth ambitions?

Table of contents
Business Model & Company Overview
Hilton Worldwide Holdings Inc., founded in 1919 and headquartered in McLean, Virginia, stands as a global leader in the travel lodging industry. The company operates a vast ecosystem of approximately 6,800 properties with 1M rooms across 122 countries. Its diverse portfolio includes iconic brands like Waldorf Astoria, Conrad, and Hampton by Hilton, creating a cohesive hospitality experience that spans luxury to midscale markets.
Hilton’s revenue engine balances management and franchise fees with ownership income. It leverages a broad global footprint across the Americas, EMEA, and Asia Pacific to capture demand in various regions. The firm’s competitive advantage lies in its strong brand equity and extensive distribution network, which together fortify its economic moat and influence the future of global hospitality.
Financial Performance & Fundamental Metrics
I analyze Hilton Worldwide Holdings Inc.’s income statement, key financial ratios, and dividend payout policy to assess its intrinsic value and capital efficiency.
Income Statement
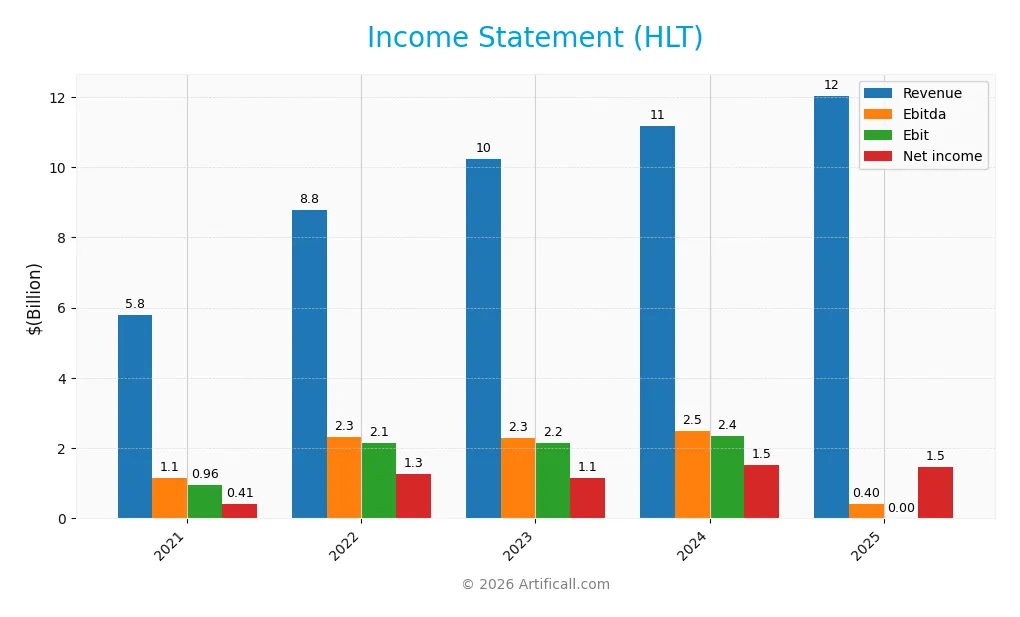
The table below summarizes Hilton Worldwide Holdings Inc.’s key income statement figures for fiscal years 2021 through 2025, reflecting revenue, expenses, profits, and earnings per share.
| 2021 | 2022 | 2023 | 2024 | 2025 | |
|---|---|---|---|---|---|
| Revenue | 5.79B | 8.77B | 10.24B | 11.17B | 12.04B |
| Cost of Revenue | 4.13B | 6.08B | 7.31B | 8.11B | 7.09B |
| Operating Expenses | 645M | 604M | 705M | 693M | 393M |
| Gross Profit | 1.65B | 2.70B | 2.93B | 3.06B | 4.95B |
| EBITDA | 1.15B | 2.31B | 2.30B | 2.50B | 403M |
| EBIT | 957M | 2.15B | 2.16B | 2.35B | 0 |
| Interest Expense | 397M | 415M | 464M | 569M | 620M |
| Net Income | 410M | 1.26B | 1.14B | 1.54B | 1.46B |
| EPS | 1.47 | 4.56 | 4.35 | 6.20 | 6.18 |
| Filing Date | 2022-02-16 | 2023-02-09 | 2024-02-07 | 2025-02-06 | 2026-02-11 |
Income Statement Evolution
Hilton’s revenue grew steadily from 5.8B in 2021 to 12.0B in 2025, doubling over five years. Net income surged 255%, rising from 410M to 1.46B. Gross margin improved significantly, reaching a favorable 41.15%, while net margin also expanded to 12.1%. However, EBIT margin collapsed to zero in 2025, marking a notable margin deterioration.
Is the Income Statement Favorable?
In 2025, Hilton posted 12.0B revenue with a 7.7% annual increase, yet net income declined 11.9% from the prior year. The company faced a sharp EBIT margin drop to zero, signaling operational pressure despite stable gross margin. Interest expense remains well-controlled at -5.15% of revenue. Overall, fundamentals appear favorable, but margin erosion and income declines warrant cautious monitoring.
Financial Ratios
Below is a summary of key financial ratios for Hilton Worldwide Holdings Inc. from 2021 to 2025, highlighting profitability, valuation, liquidity, leverage, efficiency, and dividend metrics:
| Ratios | 2021 | 2022 | 2023 | 2024 | 2025 |
|---|---|---|---|---|---|
| Net Margin | 7.1% | 14.3% | 11.1% | 13.7% | 12.1% |
| ROE | -49.9% | -113.9% | -48.3% | -41.2% | 0% |
| ROIC | 5.8% | 12.4% | 12.8% | 16.4% | 7.1% |
| P/E | 106.1 | 27.7 | 41.8 | 39.9 | 46.5 |
| P/B | -53.0 | -31.5 | -20.2 | -16.4 | 0 |
| Current Ratio | 0.95 | 0.85 | 0.70 | 0.70 | 0 |
| Quick Ratio | 0.95 | 0.85 | 0.70 | 0.70 | 0 |
| D/E | -11.9 | -8.8 | -4.3 | -3.2 | 0 |
| Debt-to-Assets | 63.3% | 62.5% | 65.7% | 72.6% | 0% |
| Interest Coverage | 2.5 | 5.0 | 4.8 | 4.2 | -4.3 |
| Asset Turnover | 0.37 | 0.57 | 0.66 | 0.68 | 31.6 |
| Fixed Asset Turnover | 5.8 | 9.3 | 10.2 | 11.4 | 42.5 |
| Dividend Yield | 0% | 0.35% | 0.33% | 0.25% | 0.21% |
Evolution of Financial Ratios
Hilton’s Return on Equity (ROE) remained at 0% in 2025, indicating no improvement in shareholder returns. The Current Ratio dropped to 0, signaling liquidity stress compared to prior years around 0.7–0.95. Meanwhile, the Debt-to-Equity ratio stood at 0 in 2025, reflecting a notable shift from earlier negative values, suggesting changes in capital structure and leverage.
Are the Financial Ratios Favorable?
Profitability shows mixed signals: net margin at 12.1% is favorable, yet ROE is unfavorable at 0%. Liquidity ratios, including current and quick ratios at zero, raise red flags. Efficiency metrics like asset and fixed asset turnover are strongly favorable. Leverage ratios indicate low debt risk, but interest coverage is weak. Overall, the financial ratios are slightly favorable, balancing strengths in profitability and efficiency against liquidity and valuation concerns.
Shareholder Return Policy
Hilton Worldwide Holdings Inc. maintains a low dividend payout ratio near 10%, with a stable dividend per share around $0.60 and a modest annual yield below 0.4%. The company supports dividends through robust free cash flow coverage and engages in share buybacks, balancing cash returns to shareholders.
This distribution approach appears sustainable given Hilton’s consistent profitability and free cash flow generation. The combination of dividends and buybacks aligns with maintaining long-term shareholder value, though low yields suggest a focus on disciplined capital allocation over high immediate income.
Score analysis
The following radar chart shows a detailed breakdown of Hilton Worldwide Holdings Inc.’s key financial scores:
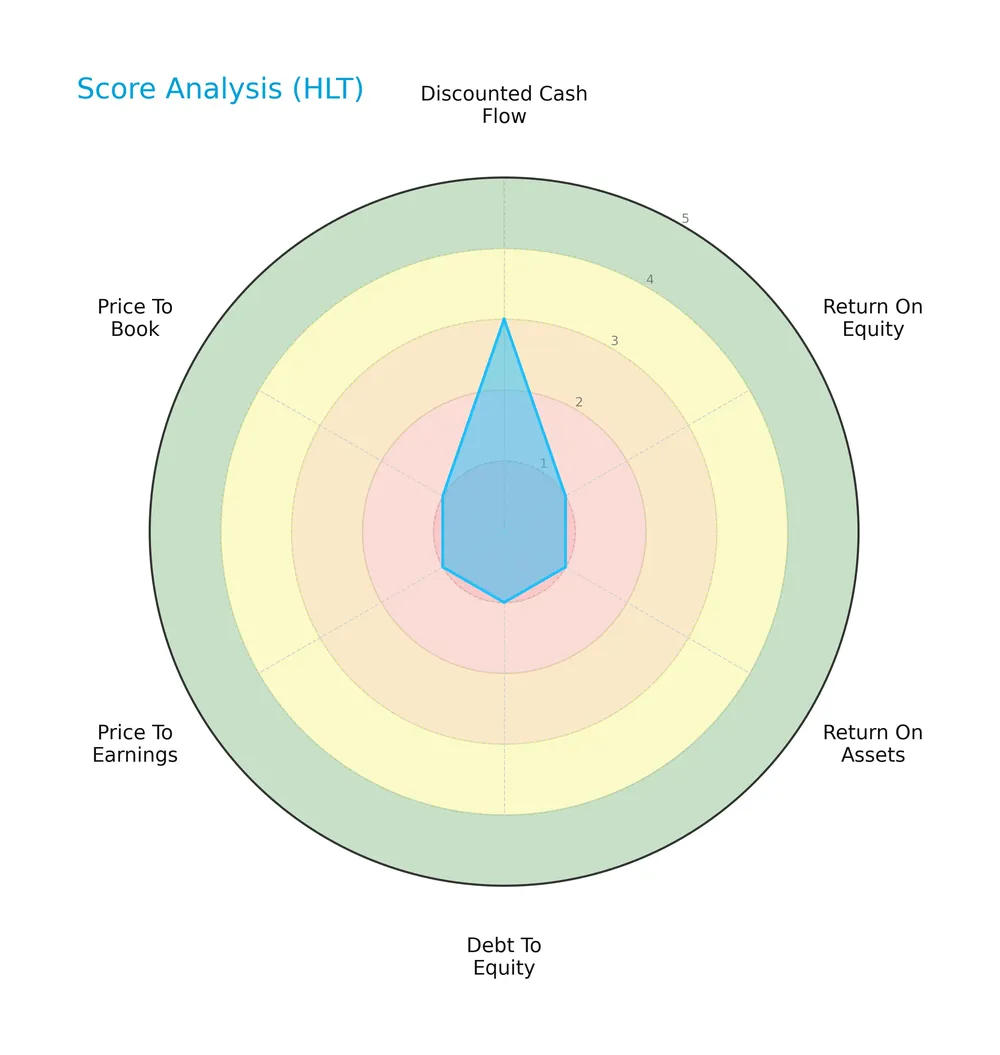
Hilton scores moderately on discounted cash flow but scores very unfavorably on return on equity, return on assets, debt to equity, price to earnings, and price to book. This mix indicates structural challenges in profitability and valuation metrics.
Is the company in good financial health?
Here is the Piotroski Score diagram reflecting Hilton’s financial strength:

Hilton’s Piotroski Score of 6 places it in the average category. This suggests moderate financial health, with some strengths balanced by areas requiring attention.
Competitive Landscape & Sector Positioning
This sector analysis will explore Hilton Worldwide Holdings Inc.’s strategic positioning, revenue segments, key products, main competitors, and competitive advantages. I will assess whether Hilton holds a sustainable edge over its industry peers.
Strategic Positioning
Hilton Worldwide Holdings Inc. maintains a diversified portfolio with 6,800 properties under multiple brands across 122 countries. Its revenue streams span management, franchise, owned hotels, and reimbursements. The company generates approximately 79% of revenue from the U.S. and 21% internationally, reflecting concentrated geographical exposure with global brand reach.
Revenue by Segment
The pie chart illustrates Hilton Worldwide Holdings Inc.’s revenue breakdown by segment for the fiscal year 2025, highlighting the business’s core income sources.
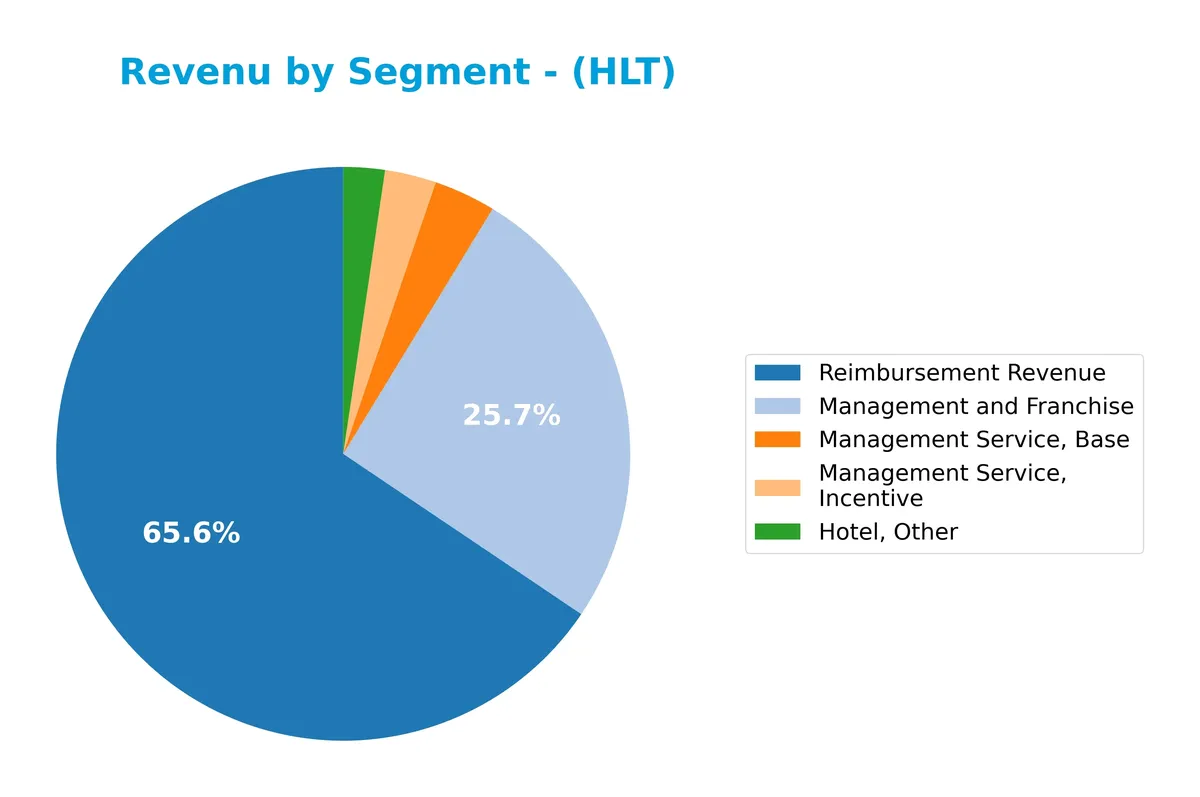
Reimbursement Revenue dominates at 7.1B, reflecting Hilton’s reliance on this segment. Management and Franchise follows with 2.78B, showing steady growth over recent years. Smaller segments like Management Service Base and Incentive contribute modestly, while Hotel, Other remains under 300M. The 2025 data confirm a concentration risk in Reimbursement Revenue, although this segment’s growth signals operational scale and market demand resilience.
Key Products & Brands
Hilton generates revenue from diverse hotel management, franchise, owned properties, and reimbursement services:
| Product | Description |
|---|---|
| Management and Franchise | Revenue from managing and franchising Hilton’s global hotel brands. |
| Reimbursement Revenue | Income covering costs reimbursed by hotel owners for services provided. |
| Hotel, Owned | Revenue from Hilton-operated owned hotel properties. |
| Management Service, Base | Fixed fees earned from managing hotels under contract. |
| Management Service, Incentive | Performance-based fees tied to hotel profitability. |
| Hotel, Other | Miscellaneous hotel-related revenue streams. |
Hilton’s product mix reflects a balanced combination of fee-based management, franchising, and owned operations. This diversified revenue base supports resilience across market cycles.
Main Competitors
There are 2 competitors in the Travel Lodging industry, with the table listing the top 10 leaders by market capitalization:
| Competitor | Market Cap. |
|---|---|
| Marriott International, Inc. | 84B |
| Hilton Worldwide Holdings Inc. | 68B |
Hilton Worldwide ranks 2nd among its competitors, holding about 90% of Marriott International’s market cap. It stands below both the average market cap of the top 10 and the sector median at 76B. Hilton trails Marriott by approximately 11%, illustrating a notable but not insurmountable gap.
Comparisons with competitors
Check out how we compare the company to its competitors:
Does Hilton have a competitive advantage?
Hilton Worldwide Holdings Inc. demonstrates a strong competitive advantage, supported by a very favorable moat with ROIC far exceeding WACC and a growing ROIC trend. This indicates efficient capital use and sustained value creation.
Looking ahead, Hilton’s extensive global footprint with 6,800 properties in 122 countries offers growth opportunities in emerging markets and new hospitality segments. Its diversified brand portfolio positions it well to capture evolving consumer preferences.
SWOT Analysis
This analysis highlights Hilton Worldwide Holdings Inc.’s key internal and external factors shaping its competitive positioning and growth prospects.
Strengths
- Strong global brand portfolio
- Robust revenue growth over 5 years
- Sustainable competitive advantage with high ROIC
Weaknesses
- Unfavorable EBIT margin in recent year
- Weak liquidity ratios
- High P/E ratio signaling expensive valuation
Opportunities
- Expanding international markets
- Increasing demand for upscale lodging
- Digital innovation in customer experience
Threats
- Economic downturns impacting travel
- Rising interest expenses
- Intense competition in hospitality sector
Hilton’s strong brand and value creation position it well for long-term growth. However, liquidity concerns and valuation risks require cautious capital allocation. Strategic focus on expanding global footprints and innovation will be critical to mitigate macroeconomic and competitive threats.
Stock Price Action Analysis
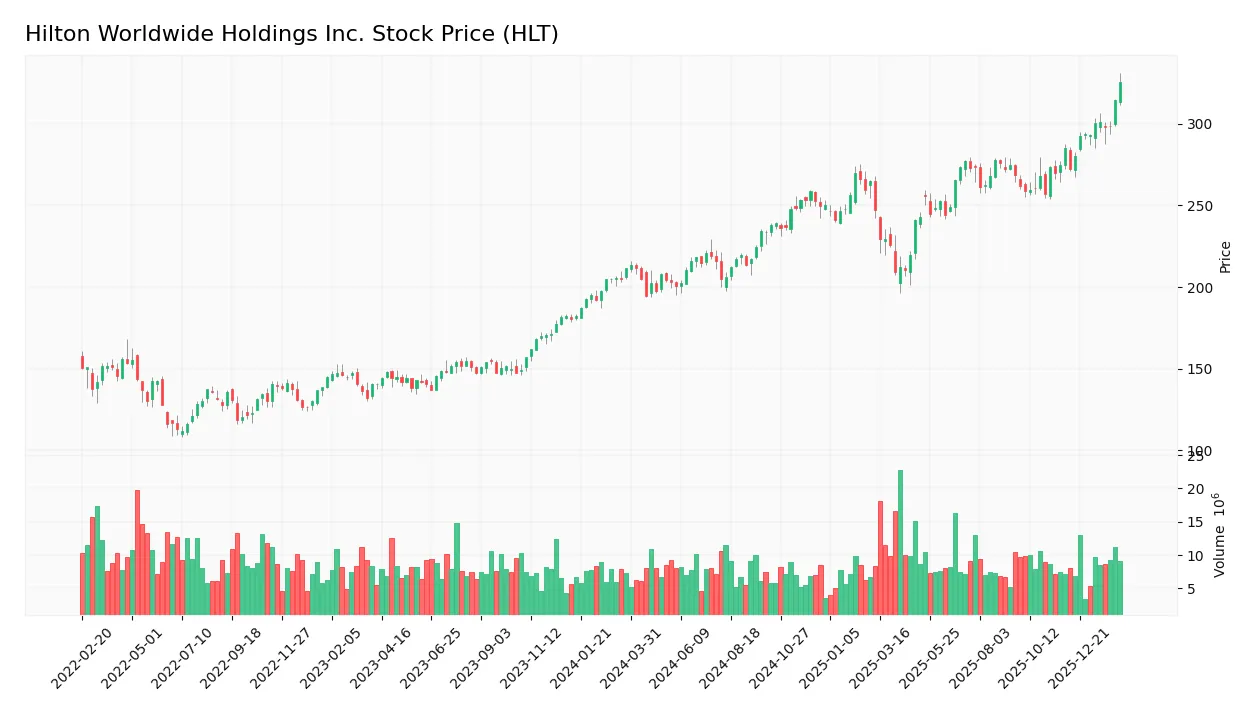
The weekly stock chart for Hilton Worldwide Holdings Inc. (HLT) reveals significant price movement and volume trends over the past year:
Trend Analysis
Over the past 12 months, HLT’s stock price rose by 53.87%, signaling a strong bullish trend. The trend shows acceleration, supported by a high standard deviation of 29.68. The stock hit a low of 194.47 and a high of 325.13, demonstrating notable volatility and upward momentum.
Volume Analysis
Trading volume over the last three months is strongly buyer-driven, with buyers accounting for 77.97% of activity. Volume has been increasing, reflecting growing investor interest and positive market participation in this period. This buyer dominance suggests confidence in the stock’s near-term prospects.
Target Prices
Analysts set a clear target price consensus for Hilton Worldwide Holdings Inc. (HLT).
| Target Low | Target High | Consensus |
|---|---|---|
| 253 | 339 | 297 |
The target range from 253 to 339 suggests moderate upside potential. The consensus of 297 reflects cautious optimism among analysts.

Don’t Let Luck Decide Your Entry Point
Optimize your entry points with our advanced ProRealTime indicators. You’ll get efficient buy signals with precise price targets for maximum performance. Start outperforming now!
Analyst & Consumer Opinions
This section reviews Hilton Worldwide Holdings Inc. (HLT) through analyst grades and consumer feedback data.
Stock Grades
The latest grades from top-tier analysts on Hilton Worldwide Holdings Inc. reveal consistent sentiment and stable outlooks:
| Grading Company | Action | New Grade | Date |
|---|---|---|---|
| JP Morgan | Maintain | Overweight | 2026-02-03 |
| Evercore ISI Group | Maintain | In Line | 2026-01-22 |
| Morgan Stanley | Maintain | Overweight | 2026-01-16 |
| Barclays | Maintain | Overweight | 2026-01-16 |
| Bernstein | Maintain | Market Perform | 2026-01-06 |
| Goldman Sachs | Upgrade | Buy | 2025-12-15 |
| Susquehanna | Maintain | Neutral | 2025-10-23 |
| Goldman Sachs | Maintain | Neutral | 2025-10-23 |
| Barclays | Maintain | Overweight | 2025-10-23 |
| Truist Securities | Maintain | Hold | 2025-10-23 |
Most analysts maintain positive or neutral ratings, with a notable upgrade by Goldman Sachs to Buy in late 2025. The consensus remains Buy, reflecting confidence but also caution among some firms.
Consumer Opinions
Consumer sentiment around Hilton Worldwide Holdings Inc. reflects a strong appreciation for its hospitality experience, tempered by occasional service inconsistencies.
| Positive Reviews | Negative Reviews |
|---|---|
| Rooms are consistently clean and modern. | Front desk service can be slow. |
| Loyalty program offers great rewards. | Some locations struggle with noise. |
| Convenient locations near key airports. | Pricing spikes during peak seasons. |
Overall, guests praise Hilton’s clean rooms and rewarding loyalty program. However, slow check-ins and price volatility remain common pain points.
Risk Analysis
Below is a summary of Hilton Worldwide Holdings Inc.’s key risks, categorized by type, with their likelihood and potential impact:
| Category | Description | Probability | Impact |
|---|---|---|---|
| Financial | Weak liquidity ratios (current and quick ratios at 0) | High | High |
| Valuation | Elevated P/E ratio (46.53) signals potential overvaluation | Medium | Medium |
| Profitability | Zero return on equity despite favorable ROIC | Medium | Medium |
| Interest Coverage | Negative interest coverage ratio indicating risk to debt | Medium | High |
| Market Volatility | Beta of 1.11 suggests stock moves slightly above market | Medium | Medium |
The most pressing risks involve Hilton’s liquidity and interest coverage. Historically in hospitality, weak liquidity can exacerbate downturns from travel shocks. The high P/E compared to the S&P 500 average (~20) raises valuation concerns amid uncertain market cycles. I observe that Hilton’s strong ROIC signals operational efficiency, but the zero ROE and negative interest coverage highlight capital structure stress. Investors must weigh these factors carefully.
Should You Buy Hilton Worldwide Holdings Inc.?
Hilton Worldwide appears to be creating value with a durable competitive moat and growing operational efficiency, supported by a manageable leverage profile. Despite this, its overall rating remains cautious at C-, suggesting mixed financial health and moderate risk.
Strength & Efficiency Pillars
Hilton Worldwide Holdings Inc. delivers a robust net margin of 12.1%, signaling effective cost management and profitability. Impressively, its ROIC stands at 706.82%, vastly exceeding the WACC of 8.99%, confirming the company as a clear value creator. Asset turnover ratios reinforce operational efficiency, with figures at 31.6 and fixed asset turnover at 42.54, reflecting strong asset utilization. Despite a neutral WACC assessment, Hilton’s growing ROIC trend underscores a sustainable competitive advantage.
Weaknesses and Drawbacks
Hilton’s valuation metrics raise concerns, notably a high P/E ratio of 46.53, suggesting the stock trades at a premium that may limit upside. Liquidity ratios such as the current and quick ratios are unavailable, flagging potential short-term solvency risks. Additionally, the company’s negative interest coverage ratio underscores vulnerability to interest expenses. While debt-to-equity and debt-to-assets appear favorable, the absence of critical liquidity data and the elevated valuation temper enthusiasm.
Our Final Verdict about Hilton Worldwide Holdings Inc.
The company presents a strong long-term fundamental profile, driven by exceptional value creation and operational efficiency. The bullish overall trend, supported by a 62.93% buyer dominance and accelerating price gains, suggests momentum. Given the strong buyer dominance in recent months, the profile may appear attractive for long-term exposure. However, valuation premiums and liquidity opacity advise cautious monitoring for potential entry points.
Disclaimer: This content is for informational purposes only and does not constitute financial, investment, or other professional advice. Investing in financial markets involves a significant risk of loss, and past performance is not indicative of future results.
Additional Resources
- Hilton Reports Fourth Quarter and Full Year Results – Stories From Hilton (Feb 11, 2026)
- Hilton Worldwide Holdings: Growth Justifies Its Expensive Valuation (NYSE:HLT) – Seeking Alpha (Feb 11, 2026)
- Price Over Earnings Overview: Hilton Worldwide Holdings – Benzinga (Feb 11, 2026)
- Hilton Worldwide Q4 Earnings Call Highlights – Yahoo Finance (Feb 11, 2026)
- What’s Going On With Hilton Worldwide Stock Today? – Benzinga (Feb 11, 2026)
For more information about Hilton Worldwide Holdings Inc., please visit the official website: hilton.com