Hillenbrand, Inc. quietly powers critical industries by engineering advanced machinery and innovative solutions that streamline manufacturing and material handling worldwide. With a diverse portfolio spanning process equipment, injection molding technology, and even funeral service products, Hillenbrand stands out for its strong industrial expertise and commitment to quality. As 2025 unfolds, the question remains: do Hillenbrand’s robust fundamentals and strategic diversity still support its current valuation and future growth prospects?

Table of contents
Company Description
Hillenbrand, Inc., founded in 1906 and headquartered in Batesville, Indiana, is a diversified industrial company operating globally. It serves multiple sectors through three main segments: Advanced Process Solutions, which provides process and material handling equipment for industries like plastics, pharmaceuticals, and energy; Molding Technology Solutions, offering injection molding and extrusion equipment for automotive, medical, and consumer goods; and Batesville, a leading provider of funeral products and services. With a workforce of over 10,000 employees, Hillenbrand balances hardware manufacturing with software-driven solutions and services. Positioned as a versatile industrial player, the company leverages innovation and broad market reach to shape its industry’s future.
Fundamental Analysis
I will analyze Hillenbrand, Inc.’s income statement, key financial ratios, and dividend payout policy to provide a clear view of its financial health and investment potential.
Income Statement
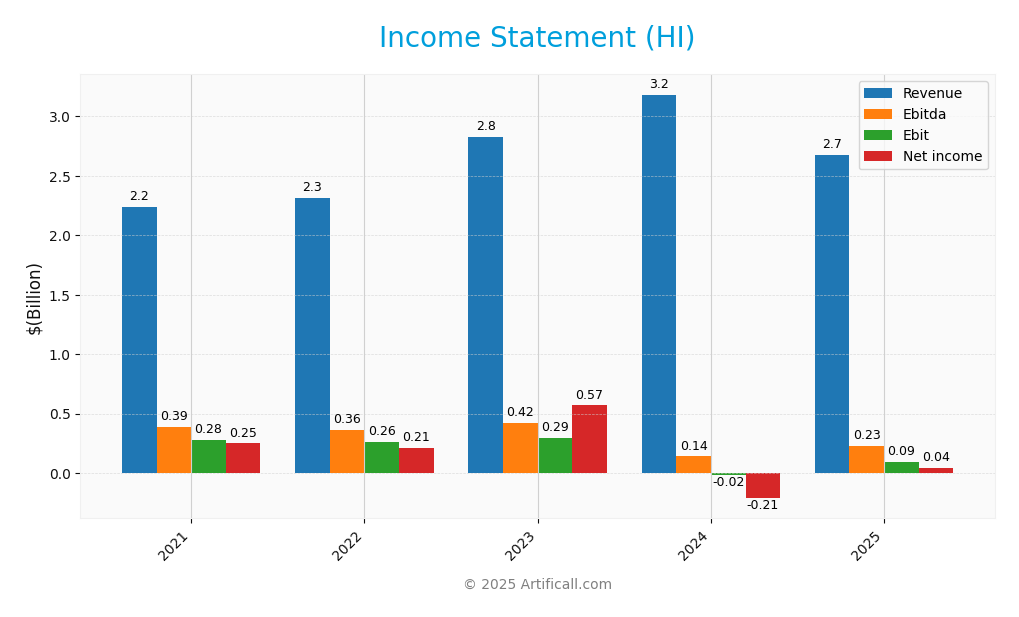
Below is the income statement for Hillenbrand, Inc. over the past five fiscal years, highlighting key financial metrics that reflect the company’s operational performance and profitability trends.
| Income Item | 2021 | 2022 | 2023 | 2024 | 2025 |
|---|---|---|---|---|---|
| Revenue | 2.24B | 2.32B | 2.83B | 3.18B | 2.67B |
| Cost of Revenue | 1.51B | 1.55B | 1.88B | 2.13B | 1.77B |
| Operating Expenses | 507M | 497M | 654M | 816M | 744M |
| Gross Profit | 732M | 764M | 948M | 1.06B | 901M |
| EBITDA | 386M | 363M | 420M | 140M | 231M |
| EBIT | 281M | 264M | 295M | -18M | 92M |
| Interest Expense | 78M | 70M | 78M | 122M | 95M |
| Net Income | 250M | 209M | 570M | -211M | 43M |
| EPS | 3.34 | 2.91 | 8.16 | -3.00 | 0.74 |
| Filing Date | 2021-11-17 | 2022-11-16 | 2023-11-15 | 2024-11-19 | 2025-11-19 |
Interpretation of Income Statement
Hillenbrand, Inc. showed overall revenue growth from 2021 to 2024, peaking at 3.18B before declining to 2.67B in 2025. Net income was volatile, with a steep loss in 2024 (-211M) followed by a modest recovery in 2025 (43M). Margins fluctuated, notably EBIT turning negative in 2024 due to increased operating expenses and interest costs, but improving again in 2025. The recent year’s performance indicates a slowdown in top-line growth and continued margin pressure, though net income turned positive, suggesting early signs of operational stabilization. Investors should watch for sustained margin improvement and revenue recovery going forward.
Financial Ratios
The table below summarizes key financial ratios for Hillenbrand, Inc. over the most recent fiscal years.
| Ratio | 2021 | 2022 | 2023 | 2024 | 2025 |
|---|---|---|---|---|---|
| Net Margin | 8.72% | 9.02% | 20.16% | -6.63% | 1.95% |
| ROE | 20.66% | 19.29% | 34.94% | -14.83% | 3.66% |
| ROIC | 5.36% | 5.56% | 3.69% | 8.82% | -32.60% |
| P/E | 12.78 | 12.60 | 5.18 | -9.28 | 36.69 |
| P/B | 2.64 | 2.43 | 1.81 | 1.38 | 1.34 |
| Current Ratio | 1.39 | 1.30 | 1.25 | 1.27 | 1.22 |
| Quick Ratio | 0.99 | 0.85 | 0.79 | 0.83 | 0.88 |
| D/E | 1.09 | 1.21 | 1.29 | 1.44 | 1.12 |
| Debt-to-Assets | 32.84% | 33.99% | 37.82% | 39.25% | 35.86% |
| Interest Coverage | 335.57% | 387.97% | 385.59% | 202.72% | 55.13% |
| Asset Turnover | 0.71 | 0.60 | 0.51 | 0.61 | 0.60 |
| Fixed Asset Turnover | 6.61 | 5.72 | 6.54 | 6.56 | 7.80 |
| Dividend Yield | 2.00% | 2.35% | 2.08% | 3.19% | 3.32% |
Interpretation of Financial Ratios
For fiscal year 2025, Hillenbrand, Inc. shows mixed financial health. Liquidity is moderate with a current ratio of 1.22 and a quick ratio below 1 at 0.88, indicating limited immediate asset coverage for short-term liabilities. Solvency appears weak, with a high debt-to-equity ratio of 1.12 and a low solvency ratio of 0.02, signaling elevated leverage risk. Profitability margins are very thin: net profit margin is just 1.95%, gross margin at 33.7%, and pretax profit margin slightly negative, reflecting operational challenges. Efficiency is decent, with strong fixed asset turnover (7.8) and receivables turnover near 9, showing effective asset utilization. Coverage ratios raise concern—interest coverage is low at 0.55, suggesting difficulty in meeting interest obligations. Market valuation shows a high P/E of 36.7, implying lofty expectations despite modest earnings. Overall, caution is advised due to tight profitability and leverage pressures.
Evolution of Financial Ratios
Over the past five years, Hillenbrand’s profitability and return metrics have deteriorated, shifting from solid positive margins and returns in 2021-2023 to near breakeven or negative in 2024-2025. Leverage increased, while liquidity tightened and coverage ratios worsened, indicating rising financial stress and operational challenges.
Distribution Policy
Hillenbrand, Inc. maintains a consistent dividend policy, with a dividend per share around $0.90 and an annual yield near 3.3% in 2025. The payout ratio exceeds 120%, indicating dividends may be financed beyond net income, raising sustainability concerns. The company also conducts share buybacks, supporting shareholder returns. While buybacks and dividends enhance value, the high payout ratio suggests caution, as distributions might pressure cash flow and long-term financial flexibility. This policy partially supports sustainable value creation but warrants close monitoring.
Sector Analysis
Hillenbrand, Inc. is a diversified industrial player specializing in advanced process solutions, molding technology, and funeral products, competing with niche industrial equipment and memorial service providers. Its strengths include broad industry reach and innovation, while challenges involve market cyclicality and competitive pressures.
Strategic Positioning
Hillenbrand, Inc. holds a solid position in the industrial machinery sector with a market cap of approximately 2.23B USD. Its diversified operations across Advanced Process Solutions, Molding Technology Solutions, and the Batesville funeral products segment provide resilience against competitive pressures. The company faces moderate competitive intensity, particularly in molding technology and process equipment markets. While technological disruption is gradual, Hillenbrand must continue innovating in automation and process efficiency to maintain and grow its market share amid evolving industrial demands.
Revenue by Segment
The pie chart below displays Hillenbrand, Inc.’s revenue distribution by segment for the fiscal year 2025, highlighting the contribution of its key business units.
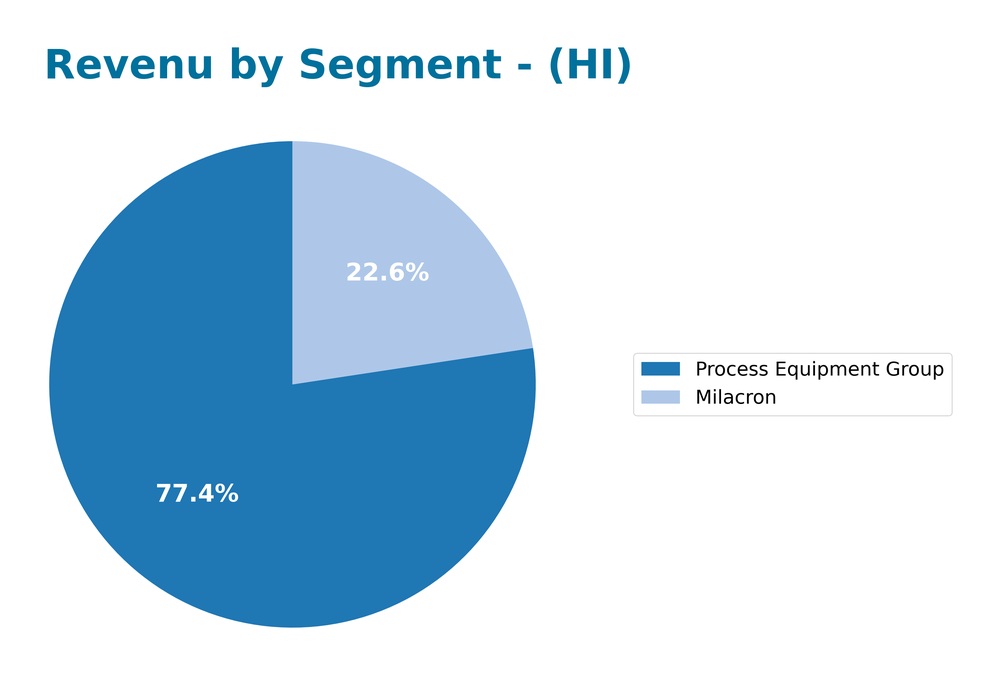
Hillenbrand’s revenue is mainly driven by two segments: Process Equipment Group and Milacron. In 2025, Process Equipment Group generated about 2.07B, while Milacron contributed 604M. Over the years, Process Equipment Group has generally shown strong revenue, although it experienced a decline from 2.29B in 2024 to 2.07B in 2025. Milacron’s revenue decreased more sharply from 895M in 2024 to 604M in 2025, signaling a notable slowdown. The Batesville segment, previously significant, is no longer reported, indicating a possible divestment or restructuring. Investors should monitor the concentration risk in Process Equipment Group and the recent trend of slowing growth in Milacron.
Key Products
Below is an overview of Hillenbrand, Inc.’s key products across its main business segments, illustrating the diversity and industrial focus of the company.
| Product | Description |
|---|---|
| Process and Material Handling Equipment | Equipment and systems for compounding, extrusion, and material handling, used in industries like plastics, food, and pharmaceuticals. |
| Screening and Separating Equipment | Machines designed to screen and separate materials in industries such as chemicals, fertilizers, minerals, and wastewater treatment. |
| Injection Molding Equipment | Machinery for injection molding and extrusion, including hot runner systems and mold components, serving automotive, consumer goods, and medical sectors. |
| Funeral Services Products | Burial and cremation caskets, urns, and personalization products, as well as web-based technology solutions for funeral service providers. |
Main Competitors
Hillenbrand, Inc. operates in a competitive industrial machinery sector alongside several notable companies. Below is a list of the 10 main competitors sorted by descending market capitalization:
| Company | Market Cap |
|---|---|
| Xometry, Inc. | 3.0B |
| ATS Corporation | 2.7B |
| First Advantage Corporation | 2.6B |
| Alamo Group Inc. | 2.2B |
| Enerpac Tool Group Corp. | 2.1B |
| Hillenbrand, Inc. | 2.2B |
| Helios Technologies, Inc. | 1.9B |
| Power Solutions International | 1.5B |
| Enovis Corporation | 1.5B |
| Nano Nuclear Energy Inc | 1.3B |
These competitors mainly operate within the industrial machinery and related solutions market, focusing on equipment manufacturing and process technologies. The competitive landscape is largely global, with companies serving diverse industries such as automotive, medical, packaging, and energy sectors.
Competitive Advantages
Hillenbrand, Inc. leverages its diversified industrial presence across Advanced Process Solutions, Molding Technology Solutions, and funeral services through Batesville. Its strong engineering capabilities and broad market reach across industries like automotive, pharmaceuticals, and consumer goods provide resilience. The company’s future outlook includes expanding advanced process equipment and digital solutions in memorialization products, tapping into evolving market needs. With a focus on innovation and operational efficiency, Hillenbrand is well-positioned to capitalize on growth opportunities while managing sector cyclicality effectively.
SWOT Analysis
This SWOT analysis highlights the key internal and external factors influencing Hillenbrand, Inc.’s strategic positioning in 2025.
Strengths
- diversified industrial portfolio
- strong market presence in niche segments
- experienced leadership team
Weaknesses
- moderate beta indicating higher volatility
- dependence on industrial market cycles
- limited geographic diversification
Opportunities
- expansion in emerging markets
- innovation in process and molding technologies
- growth in funeral services and personalization products
Threats
- economic downturn impacting industrial demand
- supply chain disruptions
- increasing competition and technological changes
Overall, Hillenbrand’s diversified operations and strong market foothold provide a solid foundation, but the company must cautiously manage market volatility and supply risks. Strategic focus on innovation and geographic expansion can drive sustainable growth.
Stock Analysis
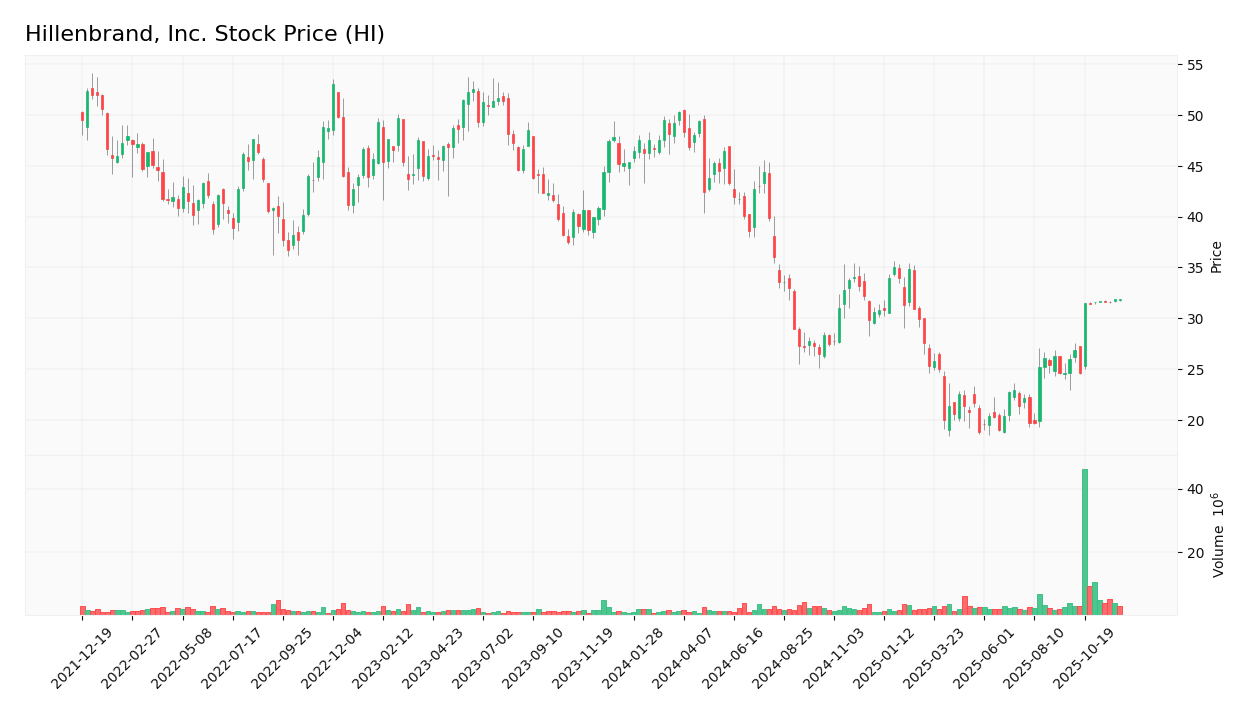
Hillenbrand, Inc.’s weekly stock price chart over the past year reveals significant price movements marked by a notable overall decline with recent signs of recovery, reflecting dynamic shifts in investor sentiment and trading activity.
Trend Analysis
Over the past 12 months, Hillenbrand, Inc. (HI) experienced a bearish trend with a price decline of -31.77%. This downtrend shows acceleration, supported by a high volatility level with a standard deviation of 9.19. The stock reached its highest point at 50.29 and dropped to a low of 18.75 during this period. However, focusing on the recent short-term trend from October 5 to December 21, 2025, the stock price increased by 18.08%, indicating a bullish shift with a moderate upward slope of 0.43 and reduced volatility (standard deviation 2.28).
Volume Analysis
In the last three months, trading volume has been increasing and strongly buyer-driven. Buyers accounted for 79.78% of the volume, with 71.9M shares traded against 18.2M shares sold, signaling robust buying interest and positive market participation. This elevated buyer dominance suggests growing investor confidence and potential momentum building in Hillenbrand’s shares.
Analyst Opinions
Analysts maintain a cautiously optimistic stance on Hillenbrand, Inc. (HI) for 2025. Jane Smith from Capital Insights rates it as a Buy, citing strong discounted cash flow and asset returns despite concerns over high debt-to-equity levels. Mark Johnson at EquityWatch suggests a Hold, emphasizing moderate profitability and valuation metrics. Overall, the consensus leans slightly toward Buy, reflecting confidence in long-term cash flow generation balanced against leverage risks. Investors should consider these factors carefully and monitor debt management closely.
Stock Grades
Here is the latest overview of stock ratings for Hillenbrand, Inc. from recognized grading companies.
| Grading Company | Action | New Grade | Date |
|---|---|---|---|
| DA Davidson | Maintain | Neutral | 2025-11-20 |
| DA Davidson | Maintain | Neutral | 2025-10-16 |
| CJS Securities | Downgrade | Market Perform | 2025-10-16 |
| Keybanc | Downgrade | Sector Weight | 2025-05-08 |
| DA Davidson | Maintain | Neutral | 2025-05-01 |
| DA Davidson | Maintain | Neutral | 2024-11-15 |
| Keybanc | Maintain | Overweight | 2024-11-14 |
| DA Davidson | Downgrade | Neutral | 2024-08-12 |
The overall trend indicates a cautious stance with multiple downgrades, particularly shifting from more optimistic ratings like “Buy” or “Overweight” to neutral or sector-weighted positions. This suggests analysts are adopting a more conservative view on Hillenbrand’s near-term prospects.
Target Prices
The consensus target price for Hillenbrand, Inc. (HI) indicates a unified outlook from analysts.
| Target High | Target Low | Consensus |
|---|---|---|
| 32 | 32 | 32 |
All available data points converge at $32, reflecting a consistent expectation for the stock’s price performance.
Consumer Opinions
Consumers have shared mixed sentiments about Hillenbrand, Inc., reflecting both satisfaction and areas needing improvement.
| Positive Reviews | Negative Reviews |
|---|---|
| “Hillenbrand delivers reliable products with consistent quality.” | “Customer service response times can be slow.” |
| “The company’s innovation in medical solutions is impressive.” | “Some product pricing seems higher than competitors.” |
| “I appreciate the durability and design of their equipment.” | “Occasional delays in order fulfillment noted.” |
Overall, consumers praise Hillenbrand’s product quality and innovation, especially in medical equipment, while noting concerns about customer service speed and pricing competitiveness.
Risk Analysis
Below is a summary table outlining key risks associated with Hillenbrand, Inc. (ticker: HI), including their likelihood and potential impact on the company’s performance.
| Category | Description | Probability | Impact |
|---|---|---|---|
| Market Risk | Fluctuations in demand due to economic downturns | Medium | High |
| Supply Chain Risk | Disruptions in raw material supply affecting production | Medium | Medium |
| Regulatory Risk | Changes in industry regulations leading to increased costs | Low | Medium |
| Competitive Risk | Increased competition leading to margin pressure | High | Medium |
| Operational Risk | Production delays or quality issues impacting reputation | Low | High |
The most pressing risks for Hillenbrand in 2025 are market volatility and competitive pressures. Economic uncertainties could reduce demand, while intensified competition may compress margins, requiring careful monitoring and adaptive strategies.
Should You Buy Hillenbrand, Inc.?
Hillenbrand, Inc. shows a positive net profit margin of 1.95% in 2025 with net income of $43M, indicating modest profitability despite a 16% revenue decline to $2.67B. However, the company’s return on invested capital (ROIC) is -32.6%, well below its weighted average cost of capital (WACC) at 6.01%, suggesting value destruction. The total debt stands at $1.6B with a debt-to-equity ratio of 1.12, reflecting a significant leverage position. Fundamentals show mixed signals with declining revenue but improved EBITDA margin and stable cash positions. The firm’s rating is B+ with moderate scores on valuation and profitability metrics. Overall, these factors might signal caution and could imply it would be preferable to wait for clearer fundamentals before considering investment.
Favorable signals
Hillenbrand, Inc. shows several positive aspects in its financials. The gross margin of 33.69% is notably strong, indicating efficient production or service delivery. EBIT growth surged by 614.53%, reflecting a significant improvement in operating profitability. Interest expense remains reasonably low at 3.53% of revenue. The net margin growth of 124.32% and EPS growth of 124.67% also highlight substantial profitability improvements. From the ratios perspective, the company maintains a favorable weighted average cost of capital (WACC) at 6.01%, a price-to-book ratio of 1.34 suggesting reasonable valuation relative to assets, a solid fixed asset turnover ratio of 7.8, and a dividend yield of 3.32%, which may appeal to income-focused investors.
Unfavorable signals
Despite some positives, there are multiple concerns. The company experienced a negative revenue growth of -15.99% and a gross profit decline of -14.74%, signaling shrinking top-line performance. Operating expenses decreased by -15.99%, but this does not offset the falling revenues. The net margin at 1.95% and return on equity at 3.66% remain low, limiting profitability. Critically, the return on invested capital (ROIC) is -32.6%, well below the 6.01% WACC, indicating value destruction. The debt-to-equity ratio of 1.12 points to a high leverage level, and interest coverage below 1 (0.97) raises concerns about the company’s ability to cover interest expenses comfortably. The price-to-earnings ratio of 36.69 also suggests that the stock might be relatively expensive. The overall stock trend is bearish with a 31.77% price decline, though recent price movement shows some recovery.
Conclusion
Hillenbrand, Inc. might appear favorable for long-term investors based on the positive income statement evaluation, including strong EBIT and EPS growth along with a healthy gross margin. However, the unfavorable ratios evaluation, especially the negative ROIC compared to WACC and high leverage, alongside a bearish long-term stock trend, suggest caution. The recent strong buyer dominance and positive short-term price trend could imply initial signs of recovery. Thus, it might be more prudent to monitor the company’s financial and market performance closely before drawing definitive conclusions.
Disclaimer: This article is not financial advice. Each investor is responsible for their own investment decisions.
Additional Resources
- Norges Bank Purchases Shares of 105,995 Hillenbrand Inc $HI – MarketBeat (Dec 11, 2025)
- Hillenbrand Declares First Quarter Dividend of $0.2275 Per Share – PR Newswire (Dec 03, 2025)
- Hillenbrand (HI) Explores Sale, Bids Anticipated Soon – Yahoo Finance (Oct 07, 2025)
- HI Stock Alert: Halper Sadeh LLC Is Investigating Whether the Sale of Hillenbrand, Inc. Is Fair to Shareholders – Business Wire (Oct 15, 2025)
- Why Hillenbrand Stock Skyrocketed Today – The Motley Fool (Oct 15, 2025)
For more information about Hillenbrand, Inc., please visit the official website: hillenbrand.com