Home > Analyses > Technology > Hewlett Packard Enterprise Company
Hewlett Packard Enterprise Company drives the backbone of modern data infrastructure, enabling businesses worldwide to harness and act on complex information with unmatched agility. As a leader in communication equipment and intelligent edge solutions, HPE’s flagship products—from ProLiant servers to Aruba networking systems—set industry standards for innovation and reliability. With a vast global footprint and a commitment to evolving technology consumption models, the question remains: does HPE’s current valuation fully reflect its growth potential in an increasingly data-driven world?

Table of contents
Business Model & Company Overview
Hewlett Packard Enterprise Company, founded in 1939 and headquartered in Spring, Texas, stands as a leading force in the communication equipment sector. Its ecosystem spans from general-purpose and workload-optimized servers to advanced storage, networking hardware, and intelligent edge solutions, creating a cohesive platform that enables seamless data capture, analysis, and action for enterprise clients worldwide.
The company’s revenue engine balances sales of high-performance hardware like HPE ProLiant servers and Aruba networking products with recurring software and cloud-based services, including network management and analytics. Operating across the Americas, Europe, Asia, and beyond, HPE leverages a strong global footprint and diverse offerings, underpinned by strategic partnerships and flexible acquisition models, to maintain its competitive advantage in shaping the future of enterprise IT infrastructure.
Financial Performance & Fundamental Metrics
This section provides an overview of Hewlett Packard Enterprise Company’s income statement, key financial ratios, and dividend payout policy for informed investment decisions.
Income Statement
The table below presents Hewlett Packard Enterprise Company’s key income statement figures for fiscal years 2021 through 2025, in USD.

| 2021 | 2022 | 2023 | 2024 | 2025 | |
|---|---|---|---|---|---|
| Revenue | 27.9B | 28.1B | 29.1B | 30.1B | 34.3B |
| Cost of Revenue | 18.8B | 19.3B | 19.2B | 20.5B | 24.4B |
| Operating Expenses | 6.9B | 7.0B | 7.5B | 7.1B | 8.2B |
| Gross Profit | 9.1B | 8.8B | 9.9B | 9.6B | 9.9B |
| EBITDA | 6.3B | 4.4B | 4.8B | 5.6B | 2.6B |
| EBIT | 3.7B | 1.9B | 2.2B | 3.0B | -0.1B |
| Interest Expense | 0.1B | 1.0B | 0.0B | 0.1B | 0.2B |
| Net Income | 3.4B | 0.9B | 2.0B | 2.6B | 0.06B |
| EPS | 2.62 | 0.67 | 1.56 | 1.95 | -0.04 |
| Filing Date | 2021-12-10 | 2022-12-08 | 2023-12-22 | 2024-12-19 | 2025-12-18 |
Income Statement Evolution
Between 2021 and 2025, Hewlett Packard Enterprise Company’s revenue grew 23.08%, reaching $34.3B in 2025, with a favorable 14.06% increase from 2024 to 2025. Gross profit showed more modest growth, up 3.29% in the last year, maintaining a stable gross margin of 28.77%. However, net income declined sharply over the period, dropping 98.34%, with margins deteriorating significantly, notably the EBIT margin turning negative in 2025.
Is the Income Statement Favorable?
In 2025, fundamentals appear mixed to unfavorable. While revenue growth and gross margin remain positive, operating income fell to $1.64B with an EBIT margin of -0.32%, reflecting operational challenges. Net income was marginal at $57M, translating to a net margin of just 0.17%, classified as neutral. Interest expense remains manageable at 0.51% of revenue, but negative earnings per share (-$0.0446) and declining profitability metrics suggest pressure on the company’s income statement health.
Financial Ratios
The following table presents key financial ratios for Hewlett Packard Enterprise Company (HPE) over recent fiscal years to aid in financial analysis:
| Ratios | 2021 | 2022 | 2023 | 2024 | 2025 |
|---|---|---|---|---|---|
| Net Margin | 12.30% | 3.09% | 6.96% | 8.58% | 0.17% |
| ROE | 17.16% | 4.37% | 9.56% | 10.39% | 0.23% |
| ROIC | 5.15% | 4.71% | 5.43% | 4.23% | -0.59% |
| P/E | 5.71 | 21.42 | 9.87 | 9.89 | 567.23 |
| P/B | 0.98 | 0.94 | 0.94 | 1.03 | 1.31 |
| Current Ratio | 0.91 | 0.88 | 0.87 | 1.29 | 1.01 |
| Quick Ratio | 0.69 | 0.66 | 0.66 | 0.99 | 0.76 |
| D/E | 0.73 | 0.68 | 0.64 | 0.80 | 0.91 |
| Debt-to-Assets | 25.27% | 23.61% | 23.65% | 27.81% | 29.46% |
| Interest Coverage | 15.91 | 1.76 | 0.00 | 20.81 | 9.39 |
| Asset Turnover | 0.48 | 0.49 | 0.51 | 0.42 | 0.45 |
| Fixed Asset Turnover | 4.29 | 4.23 | 4.18 | 4.25 | 5.71 |
| Dividend Yield | 3.19% | 3.34% | 3.10% | 2.65% | 2.46% |
Evolution of Financial Ratios
Over the period, Hewlett Packard Enterprise’s Return on Equity (ROE) declined significantly, reaching 0.23% in 2025, indicating weakened profitability. The Current Ratio remained relatively stable around 1.0, suggesting consistent short-term liquidity. Meanwhile, the Debt-to-Equity Ratio increased modestly to 0.91, reflecting a steady but cautious rise in leverage. Profitability margins deteriorated notably in the latest year.
Are the Financial Ratios Favorable?
In 2025, profitability ratios such as net margin (0.17%) and ROE (0.23%) were unfavorable, while the return on invested capital was negative at -0.59%. Liquidity was neutral with a current ratio near 1.0, but quick ratio underperformed. Leverage ratios showed a neutral debt-to-equity and favorable debt-to-assets at 29.46%. Fixed asset turnover and dividend yield were favorable, but high price-to-earnings and low interest coverage were unfavorable. Overall, ratios trend slightly unfavorable.
Shareholder Return Policy
Hewlett Packard Enterprise Company (HPE) maintains a dividend policy with a payout ratio fluctuating around 14% in 2025, supported by a dividend yield near 2.46%. Dividends per share have shown a slight increase, while coverage by free cash flow appears modest but positive. The company also engages in share buybacks, complementing its dividend distributions.
Despite operating with thin net margins in 2025, HPE’s combined approach of dividends and buybacks suggests an effort to balance shareholder returns and reinvestment. This policy, given current profitability and cash flow metrics, indicates a cautious but consistent distribution framework aligned with sustainable long-term shareholder value creation.
Score analysis
The following radar chart presents an overview of key financial scores for Hewlett Packard Enterprise Company:
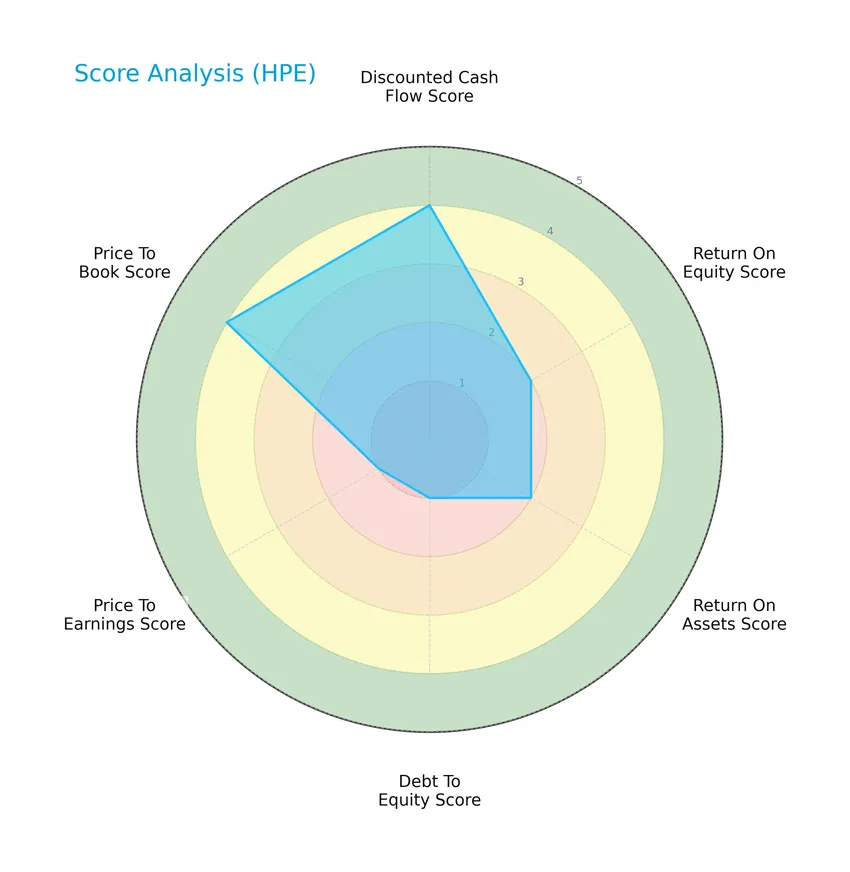
The company shows a favorable discounted cash flow and price-to-book ratio, while return on equity and return on assets scores are moderate. Debt-to-equity and price-to-earnings scores are very unfavorable, indicating some financial challenges.
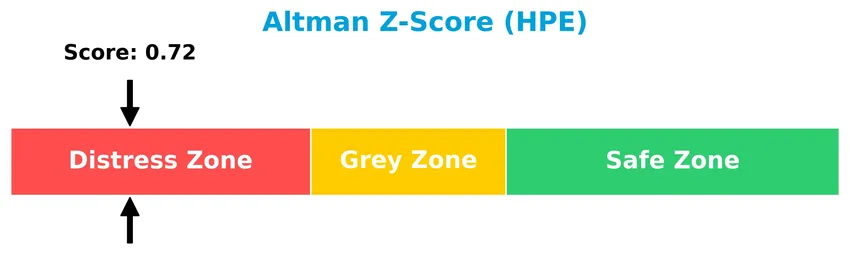
Analysis of the company’s bankruptcy risk
Hewlett Packard Enterprise Company’s Altman Z-Score indicates a position in the distress zone, suggesting a higher risk of financial distress and potential bankruptcy:
Is the company in good financial health?
This Piotroski diagram illustrates the company’s financial health based on its Piotroski Score:

With a Piotroski Score of 5, the company is considered to have average financial strength, reflecting a mix of positive and negative financial indicators.
Competitive Landscape & Sector Positioning
This sector analysis will explore Hewlett Packard Enterprise Company’s strategic positioning, revenue breakdown, key products, main competitors, and competitive advantages. I will assess whether the company holds a competitive edge over its industry peers based on these factors.
Strategic Positioning
Hewlett Packard Enterprise Company maintains a diversified product portfolio across servers, hybrid cloud, networking, financial services, and intelligent edge solutions, with FY2025 revenues led by servers at $17.7B. Geographically, it operates globally, generating $15.8B in the Americas, $11.5B in EMEA, and $6.9B in Asia Pacific and Japan, reflecting broad international exposure.
Revenue by Segment
This pie chart illustrates Hewlett Packard Enterprise Company’s revenue distribution by segment for the fiscal year 2025, highlighting key areas of business focus.
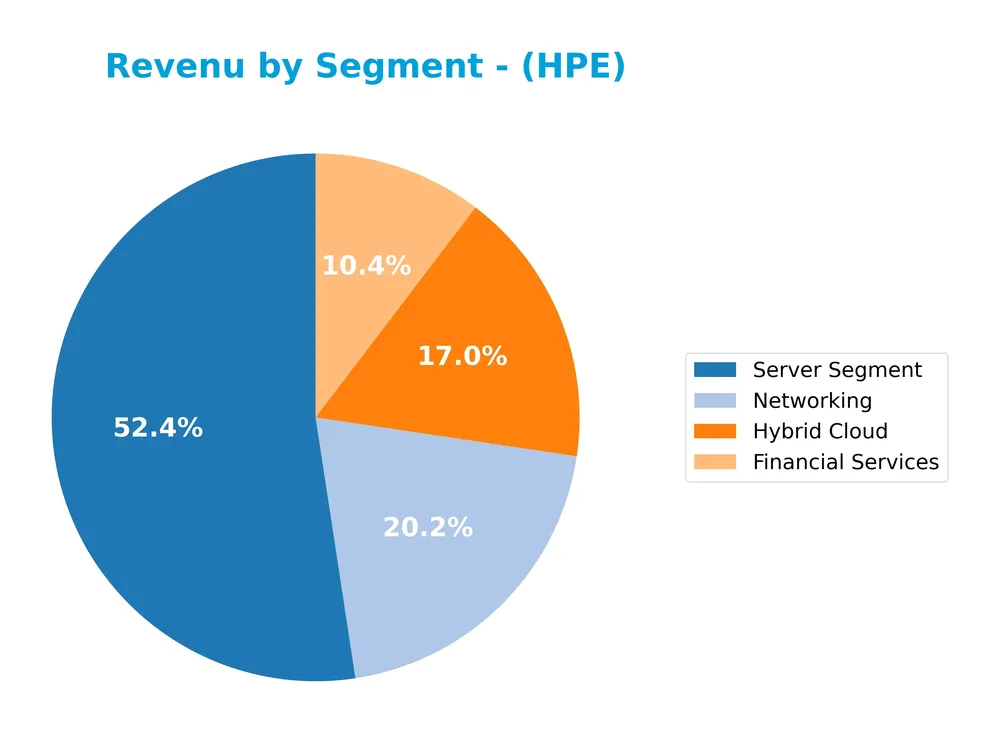
In 2025, the Server Segment remains the dominant revenue driver with 17.7B, showing steady growth from 16.2B in 2024. Networking and Hybrid Cloud segments follow with 6.9B and 5.8B respectively, reflecting the company’s strong emphasis on infrastructure and cloud solutions. Financial Services holds a stable position around 3.5B. The shift toward cloud and networking highlights ongoing strategic adaptation, while the Server Segment’s acceleration underscores its critical role in HPE’s portfolio.
Key Products & Brands
The following table outlines Hewlett Packard Enterprise’s principal products and brand portfolios as of fiscal year 2025:
| Product | Description |
|---|---|
| Server Segment | General purpose and workload-optimized servers including HPE ProLiant rack and tower servers, BladeSystem, Synergy, Apollo, Cray, Superdome Flex, Nonstop, Integrity, and Edgeline products. |
| Networking | HPE Aruba product portfolio comprising wired and wireless LAN hardware (Wi-Fi access points, switches, routers, sensors), software and services for cloud-based and network management, analytics, and professional support. |
| Hybrid Cloud | Solutions enabling seamless data capture, analysis, and action across cloud environments. |
| Financial Services | Leasing, financing, IT consumption, utility programs, and asset management services supporting technology deployment and acquisition. |
Hewlett Packard Enterprise’s key offerings span server technologies, networking infrastructure, hybrid cloud solutions, and financial services, supporting diverse commercial and large enterprise customers worldwide.
Main Competitors
There are 7 main competitors in the Communication Equipment industry, with the table below listing the top 7 leaders by market capitalization:
| Competitor | Market Cap. |
|---|---|
| Cisco Systems, Inc. | 300B |
| Motorola Solutions, Inc. | 63B |
| Nokia Oyj | 35B |
| Hewlett Packard Enterprise Company | 32B |
| Credo Technology Group Holding Ltd | 25B |
| Zebra Technologies Corporation | 13B |
| AudioCodes Ltd. | 255M |
Hewlett Packard Enterprise Company ranks 4th among its competitors with a market cap approximately 9.35% the size of Cisco Systems, the sector leader. It is positioned below both the average market cap of the top 10 competitors (67B) and the median market cap in the sector (32B). The company maintains a 24.39% market cap gap above its closest competitor, indicating a moderate lead in the mid-tier segment.
Comparisons with competitors
Check out how we compare the company to its competitors:
Does HPE have a competitive advantage?
Hewlett Packard Enterprise Company currently does not present a competitive advantage, as it is showing a declining ROIC trend and a significant gap below its WACC, indicating value destruction and decreasing profitability. Its financials reveal unfavorable EBIT margin and negative net margin growth over the recent period.
Looking ahead, HPE has opportunities in expanding its intelligent edge product portfolio, including new cloud-based management and network services, alongside partnerships for real-time analytics solutions. These developments may support future growth across Americas, EMEA, and Asia Pacific markets.
SWOT Analysis
This SWOT analysis highlights Hewlett Packard Enterprise Company’s key internal and external factors to guide investor decision-making.
Strengths
- strong global presence
- diversified product portfolio
- favorable gross margin
Weaknesses
- negative EBIT margin
- declining ROIC
- high P/E ratio
Opportunities
- growth in cloud and edge computing
- expanding services and as-a-service models
- increasing demand in emerging markets
Threats
- intense industry competition
- technology disruption risks
- macroeconomic uncertainties
Overall, HPE shows robust market reach and product diversity but faces profitability challenges and value destruction. Strategic focus on innovation and operational efficiency is critical to leverage growth opportunities and mitigate competitive threats.
Stock Price Action Analysis
The weekly stock chart of Hewlett Packard Enterprise Company (HPE) over the past 12 months reveals key price movements and trend shifts:
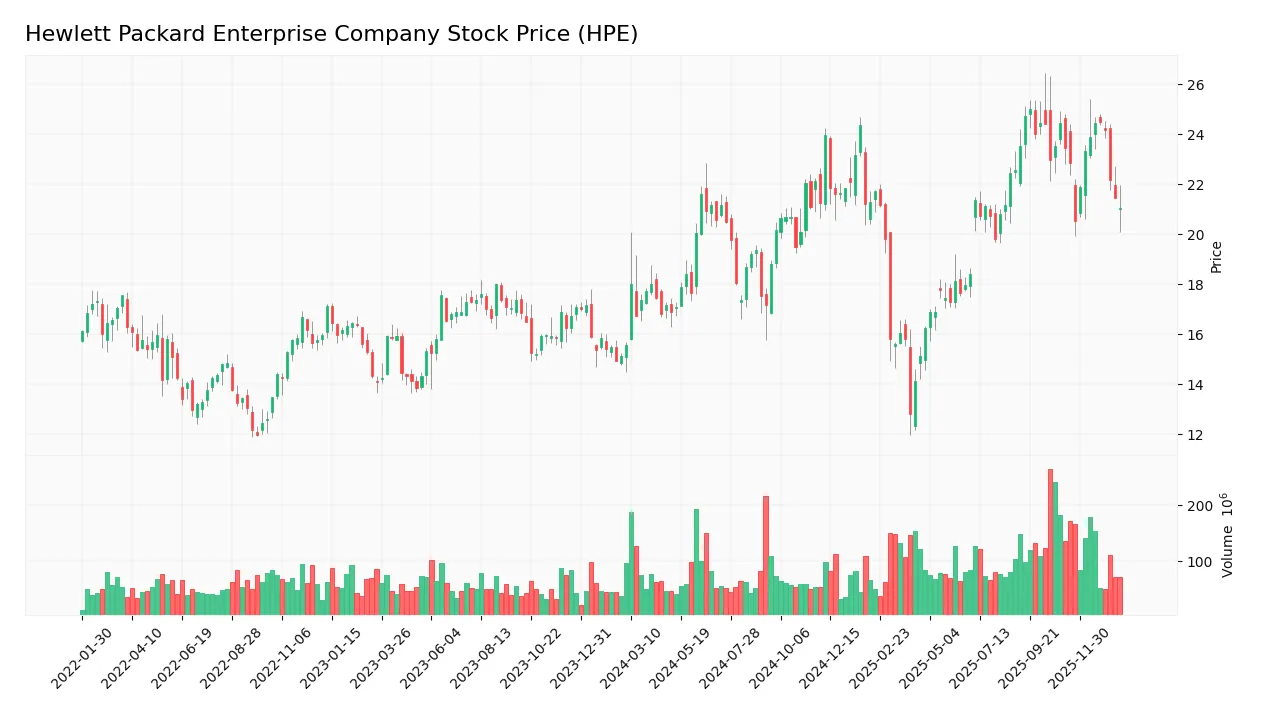
Trend Analysis
Over the past 12 months, HPE’s stock price increased by 35.28%, indicating a bullish trend. The price ranged between a low of 12.79 and a high of 24.99, with volatility reflected by a standard deviation of 2.76. The trend shows deceleration despite the overall upward movement.
Volume Analysis
In the last three months, trading volume has been increasing with a total buyer volume of 611M and seller volume of 777M, showing slight seller dominance at 44.06%. This suggests cautious investor sentiment and a modest increase in market participation skewed toward selling pressure.
Target Prices
The consensus target price for Hewlett Packard Enterprise Company reflects moderate upside potential.
| Target High | Target Low | Consensus |
|---|---|---|
| 31 | 21 | 27.25 |
Analysts expect HPE’s stock to trade between $21 and $31, with an average target near $27.25, indicating cautious optimism about its near-term performance.

Don’t Let Luck Decide Your Entry Point
Optimize your entry points with our advanced ProRealTime indicators. You’ll get efficient buy signals with precise price targets for maximum performance. Start outperforming now!
Analyst & Consumer Opinions
This section reviews recent analyst ratings and consumer feedback regarding Hewlett Packard Enterprise Company (HPE) performance and outlook.
Stock Grades
The following table presents recent verified analyst grades for Hewlett Packard Enterprise Company, reflecting varied perspectives from top financial institutions:
| Grading Company | Action | New Grade | Date |
|---|---|---|---|
| Argus Research | Maintain | Buy | 2025-12-10 |
| BWG Global | Upgrade | Positive | 2025-11-24 |
| Morgan Stanley | Downgrade | Equal Weight | 2025-11-17 |
| Barclays | Maintain | Overweight | 2025-10-16 |
| UBS | Maintain | Neutral | 2025-10-16 |
| Goldman Sachs | Maintain | Neutral | 2025-10-16 |
| Citigroup | Maintain | Buy | 2025-10-06 |
| Goldman Sachs | Maintain | Neutral | 2025-10-02 |
| Citigroup | Maintain | Buy | 2025-09-04 |
| Raymond James | Maintain | Strong Buy | 2025-09-04 |
Overall, the grades reveal a balanced outlook with a slight tilt toward holding positions, supported by multiple neutral and hold recommendations alongside some buy and strong buy endorsements. The downgrade from Morgan Stanley contrasts with BWG Global’s upgrade, indicating mixed analyst sentiment.
Consumer Opinions
Consumer sentiment about Hewlett Packard Enterprise Company (HPE) reflects a mix of appreciation for innovation and concerns about customer service.
| Positive Reviews | Negative Reviews |
|---|---|
| “HPE offers reliable and cutting-edge enterprise solutions that enhance our IT infrastructure.” | “Customer support response times are often slow and unhelpful.” |
| “Their hybrid cloud services have significantly improved our operational efficiency.” | “Pricing can be high for small and mid-sized businesses.” |
| “Strong product portfolio with consistent performance in data management.” | “Software updates sometimes introduce new bugs affecting stability.” |
| “HPE’s commitment to sustainability is impressive and aligns with our corporate values.” | “Complexity in product integration requires specialized knowledge and training.” |
Overall, consumers praise HPE’s innovative technology and robust product offerings but frequently cite challenges in customer support and product complexity as areas needing improvement.
Risk Analysis
Below is a table summarizing the key risks associated with Hewlett Packard Enterprise Company (HPE), focusing on their likelihood and potential impact:
| Category | Description | Probability | Impact |
|---|---|---|---|
| Financial Health | Low Altman Z-Score (0.72) signals high bankruptcy risk; weak profitability and negative ROIC. | High | High |
| Market Valuation | Extremely high P/E ratio (567.23) suggests overvaluation and vulnerability to market corrections. | High | Medium |
| Liquidity | Low quick ratio (0.76) and negative interest coverage indicate short-term liquidity concerns. | Medium | Medium |
| Debt Management | Moderate debt-to-equity (0.91) with unfavorable debt servicing capacity increases financial risk. | Medium | Medium |
| Operational Efficiency | Low net margin (0.17%) and asset turnover (0.45) show weak operational performance. | High | Medium |
| Dividend Stability | Dividend yield is favorable at 2.46%, but overall financial weakness may threaten payouts. | Low | Low |
The most critical risks for HPE stem from its distressed financial health and overvaluation, as indicated by the Altman Z-Score and P/E ratio. These factors expose investors to significant downside if earnings fail to improve or market sentiment shifts.
Should You Buy Hewlett Packard Enterprise Company?
Hewlett Packard Enterprise appears to be experiencing deteriorating profitability and an eroding competitive moat, suggesting value destruction and declining operational efficiency. Despite a manageable leverage profile, its overall rating of B- and distress-zone Altman Z-score indicate moderate financial risk and cautious value creation potential.
Strength & Efficiency Pillars
Hewlett Packard Enterprise Company exhibits mixed efficiency metrics with a gross margin of 28.77% signaling decent core profitability. The company’s weighted average cost of capital (WACC) stands at a favorable 6.9%, but its return on invested capital (ROIC) is negative at -0.59%, indicating value destruction rather than creation. Financial health is under pressure, with an Altman Z-Score of 0.72 placing HPE in the distress zone, while a Piotroski score of 5 suggests average financial strength. The favorable price-to-book ratio of 1.31 adds some value appeal despite broader challenges.
Weaknesses and Drawbacks
HPE faces significant headwinds, notably an exorbitant price-to-earnings ratio of 567.23, reflecting an extreme premium valuation that may not be justified by fundamentals. Leverage metrics are mixed: a debt-to-equity ratio of 0.91 is neutral, but interest coverage is negative at -0.63, signaling difficulty in servicing debt. Liquidity ratios also raise concerns, with a quick ratio at 0.76 below the comfortable threshold. Market dynamics show a recent slight seller dominance with buyers at 44.06%, suggesting short-term pressure and potential volatility.
Our Verdict about Hewlett Packard Enterprise Company
The company’s long-term fundamental profile appears unfavorable due to persistent value destruction, high valuation multiples, and financial distress signals. Despite a bullish overall stock trend with a 35.28% price increase over the medium term, recent market behavior is slightly seller dominant, indicating caution. Therefore, despite some value-supportive metrics, HPE’s profile might suggest a wait-and-see approach for a more attractive entry point, especially given ongoing profitability and leverage concerns.
Disclaimer: This content is for informational purposes only and does not constitute financial, investment, or other professional advice. Investing in financial markets involves a significant risk of loss, and past performance is not indicative of future results.
Additional Resources
- Rakuten Investment Management Inc. Buys Shares of 82,018 Hewlett Packard Enterprise Company $HPE – MarketBeat (Jan 24, 2026)
- Why Hewlett Packard Enterprise (HPE) Stock Is Up Today – The Globe and Mail (Jan 23, 2026)
- A Look At Hewlett Packard Enterprise (HPE) Valuation As Geopolitics And AI Infrastructure Keep Interest Elevated – Sahm (Jan 22, 2026)
- How The Evolving Story For Hewlett Packard Enterprise (HPE) Is Reflected In New Price Targets – Yahoo Finance (Jan 21, 2026)
- A Look At Hewlett Packard Enterprise (HPE) Valuation As Geopolitics And AI Infrastructure Keep Interest Elevated – simplywall.st (Jan 23, 2026)
For more information about Hewlett Packard Enterprise Company, please visit the official website: hpe.com