Home > Analyses > Healthcare > Henry Schein, Inc.
Henry Schein, Inc. powers the backbone of global healthcare by supplying essential products to dental and medical providers. Its industry leadership stems from a broad portfolio, ranging from infection-control supplies to cutting-edge practice management software. Known for innovation and quality, Henry Schein streamlines clinical operations and improves patient care worldwide. As the healthcare landscape evolves, I ask: does Henry Schein’s robust foundation still justify its valuation and growth ambitions in 2026?

Table of contents
Business Model & Company Overview
Henry Schein, Inc., founded in 1932 and headquartered in Melville, NY, commands a leading position in the healthcare distribution industry. The company crafts a comprehensive ecosystem serving dental and medical practitioners with products spanning infection control to digital restoration equipment. Its core mission unites physical healthcare supplies with cutting-edge technology solutions, fostering seamless clinical workflows across global markets.
The company’s revenue engine balances robust health care distribution of pharmaceuticals, medical devices, and dental products with Software and Value-Added Services like practice management systems and financial solutions. This dual-segment approach fuels growth across the Americas, Europe, and Asia. Henry Schein’s enduring competitive advantage lies in its integrated offerings, solidifying its moat and shaping the future of healthcare delivery worldwide.
Financial Performance & Fundamental Metrics
I will analyze Henry Schein, Inc.’s income statement, key financial ratios, and dividend payout policy to assess its financial health and shareholder value.
Income Statement
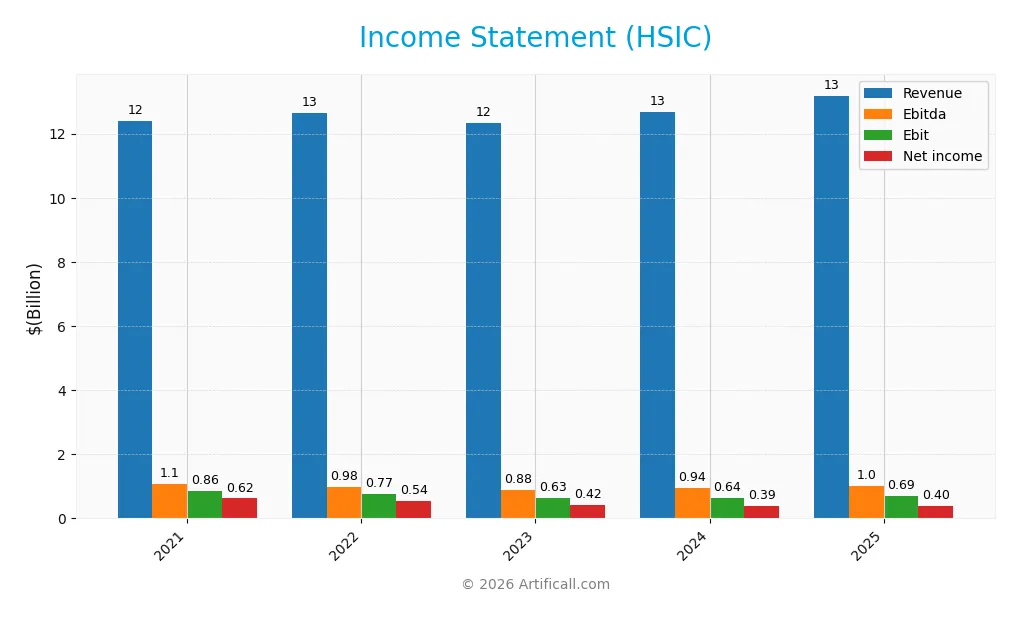
The table below summarizes Henry Schein, Inc.’s annual income statement figures for the past five fiscal years, highlighting key profitability metrics and earnings per share.
| 2021 | 2022 | 2023 | 2024 | 2025 | |
|---|---|---|---|---|---|
| Revenue | 12.4B | 12.6B | 12.3B | 12.7B | 13.2B |
| Cost of Revenue | 8.7B | 9.0B | 8.7B | 8.9B | 9.3B |
| Operating Expenses | 2.8B | 2.7B | 2.9B | 3.0B | 3.1B |
| Gross Profit | 3.7B | 3.6B | 3.7B | 3.8B | 3.8B |
| EBITDA | 1.1B | 977M | 877M | 941M | 1.0B |
| EBIT | 858M | 765M | 629M | 644M | 695M |
| Interest Expense | 28M | 44M | 87M | 131M | 150M |
| Net Income | 624M | 538M | 416M | 390M | 398M |
| EPS | 4.51 | 3.95 | 3.18 | 3.07 | 3.29 |
| Filing Date | 2022-02-15 | 2023-02-21 | 2024-02-28 | 2025-02-25 | 2026-02-24 |
Income Statement Evolution
Henry Schein’s revenue grew moderately by 4.03% in 2025, continuing a neutral growth trend over the 2021-2025 period. Gross profit also increased slightly by 2.05%, maintaining a stable gross margin near 29%. EBIT growth of 7.92% outpaced revenue, signaling operational leverage, though net margin declined by 1.9%, reflecting some pressure on profitability.
Is the Income Statement Favorable?
In 2025, Henry Schein generated $13.18B revenue with a 29.14% gross margin, favorable within its sector. EBIT margin at 5.27% and net margin at 3.02% remain neutral, indicating stable but limited profitability. Interest expense is well controlled at 1.14% of revenue. EPS grew 7.21%, supporting a favorable overall income statement view despite a slight contraction in net margin.
Financial Ratios
The table below summarizes key financial ratios for Henry Schein, Inc. over the past five fiscal years:
| Ratios | 2021 | 2022 | 2023 | 2024 | 2025 |
|---|---|---|---|---|---|
| Net Margin | 5.0% | 4.3% | 3.4% | 3.1% | 3.0% |
| ROE | 18.2% | 15.6% | 11.4% | 11.5% | 12.3% |
| ROIC | 10.4% | 11.0% | 6.7% | 6.7% | 6.6% |
| P/E | 17.4 | 20.2 | 23.8 | 22.9 | 23.1 |
| P/B | 3.17 | 3.15 | 2.71 | 2.63 | 2.83 |
| Current Ratio | 1.67 | 1.79 | 1.67 | 1.42 | 1.38 |
| Quick Ratio | 0.86 | 0.91 | 1.00 | 0.78 | 0.76 |
| D/E | 0.36 | 0.43 | 0.75 | 0.85 | 1.14 |
| Debt-to-Assets | 14.3% | 17.4% | 25.9% | 28.1% | 32.9% |
| Interest Coverage | 31.0 | 21.3 | 8.2 | 5.6 | 5.1 |
| Asset Turnover | 1.46 | 1.47 | 1.17 | 1.24 | 1.18 |
| Fixed Asset Turnover | 17.9 | 19.0 | 15.0 | 15.4 | 14.3 |
| Dividend Yield | 0% | 0% | 0% | 0% | 0% |
Evolution of Financial Ratios
From 2021 to 2025, Henry Schein’s Return on Equity (ROE) declined steadily from 18.2% to 12.3%, signaling moderated profitability. The Current Ratio decreased from 1.67 to 1.38, indicating a slight reduction in liquidity. Meanwhile, the Debt-to-Equity Ratio rose from 0.36 to 1.14, reflecting increased leverage over the period.
Are the Financial Ratios Favorable?
In 2025, profitability metrics like net margin at 3.0% and ROE at 12.3% appear neutral to unfavorable compared to sector benchmarks. Liquidity ratios show mixed signals: the Current Ratio is neutral at 1.38, but the Quick Ratio is unfavorable at 0.76. Leverage is elevated with a Debt-to-Equity of 1.14, flagged as unfavorable. Efficiency ratios such as asset turnover (1.18) and fixed asset turnover (14.3) are favorable. Overall, the ratio profile is slightly unfavorable, with 29% unfavorable and 21% favorable ratios.
Shareholder Return Policy
Henry Schein, Inc. does not pay dividends, reflecting a strategic focus on reinvestment and growth rather than direct shareholder distributions. The company also does not engage in share buybacks, emphasizing capital allocation toward operational and growth initiatives.
This approach aligns with sustainable long-term value creation by prioritizing cash flow reinvestment over immediate returns. While shareholders receive no direct income, management’s capital deployment aims to support ongoing profitability and enterprise value growth.
Score analysis
The radar chart below illustrates Henry Schein, Inc.’s key financial scores across valuation, profitability, and leverage metrics:
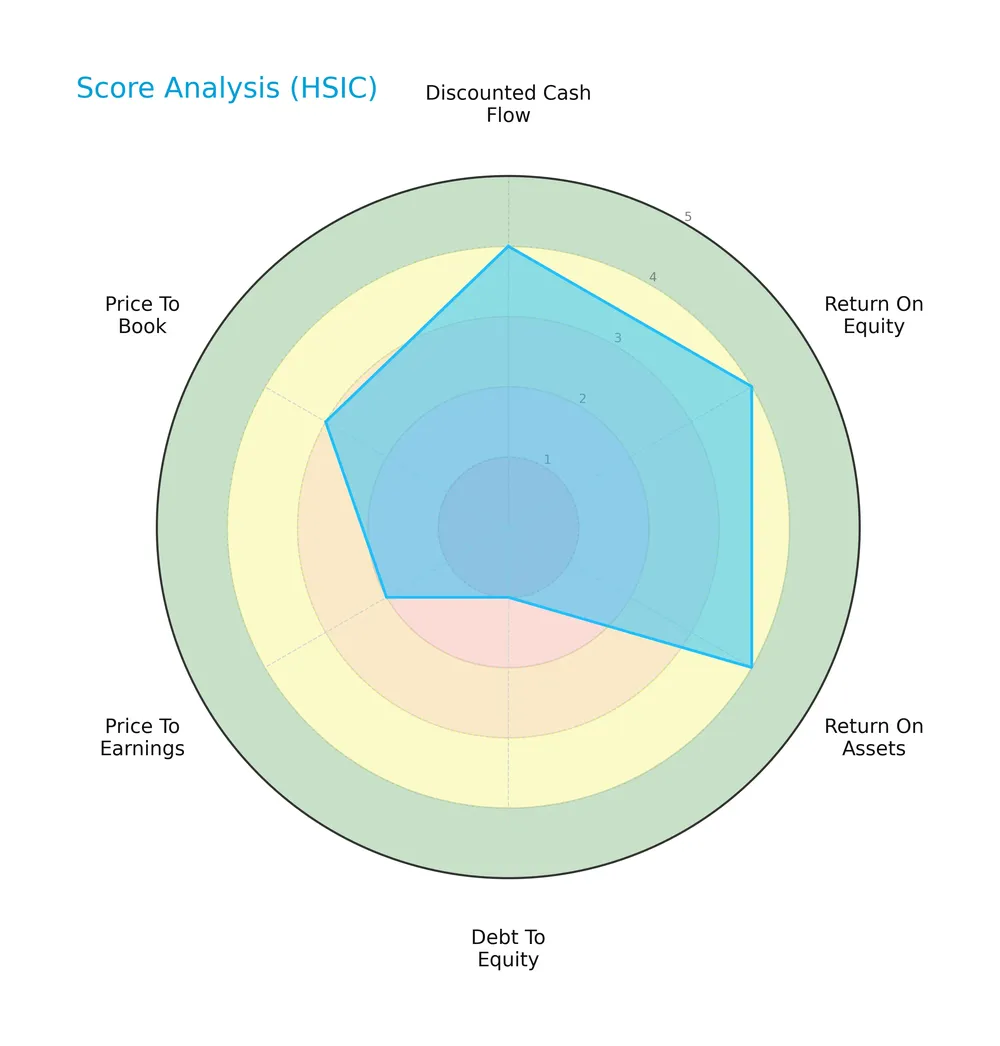
The company scores favorably on discounted cash flow, return on equity, and return on assets with top marks of 4. However, debt-to-equity stands out as very unfavorable at 1. Valuation metrics show moderate to unfavorable scores, reflecting some market price concerns.
Analysis of the company’s bankruptcy risk
Henry Schein’s Altman Z-Score places it in the grey zone, indicating a moderate risk of bankruptcy and financial caution warranted:

Is the company in good financial health?
The Piotroski Score diagram below reflects Henry Schein’s average financial health based on nine key financial criteria:

With a score of 5, the company shows moderate financial strength. This suggests neither strong nor weak fundamentals, warranting balanced scrutiny from investors.
Competitive Landscape & Sector Positioning
This analysis explores Henry Schein, Inc.’s strategic positioning within the healthcare distribution sector. We will examine its revenue segments, key products, and main competitors in detail. I aim to assess whether Henry Schein maintains a competitive advantage over its industry peers.
Strategic Positioning
Henry Schein concentrates primarily on healthcare distribution, with $12.7B revenue in 2018 and a smaller technology segment at $509M. Geographically, it maintains a strong U.S. focus, generating $9.1B in 2025, while sustaining international exposure around $4.8B in 2018.
Revenue by Segment
The pie chart displays Henry Schein, Inc.’s revenue distribution by segment for the fiscal year 2018, highlighting the relative contributions of Healthcare Distribution and Technology.
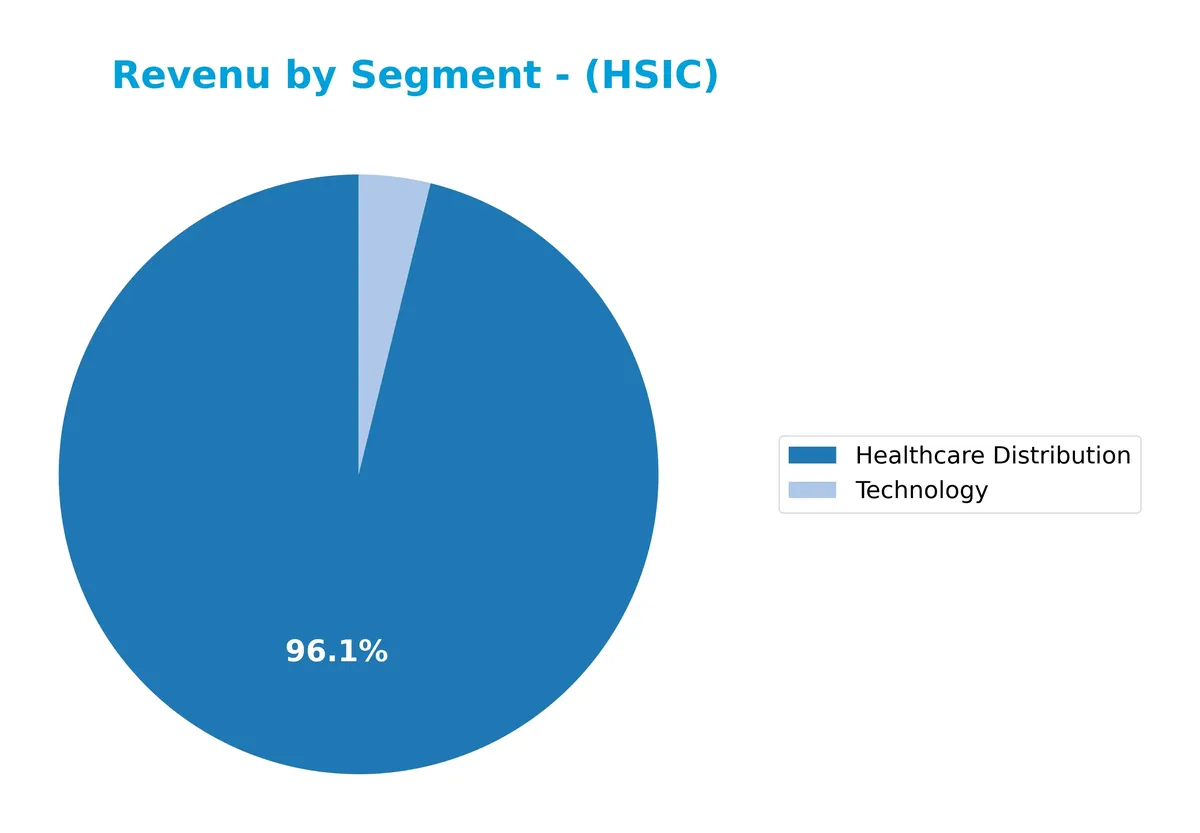
Healthcare Distribution dominates Henry Schein’s revenue, reaching $12.7B in 2018, up from $8.3B in 2011, showing steady growth over the years. Technology remains a much smaller segment at $509M in 2018 but has nearly doubled since 2011. The business remains highly concentrated in Healthcare Distribution, reflecting a strong moat but also concentration risk if that segment faces disruption.
Key Products & Brands
The table below summarizes Henry Schein, Inc.’s main products and service categories:
| Product | Description |
|---|---|
| Dental Products | Infection-control items, handpieces, impression materials, composites, anesthetics, implants, chairs, lights, X-ray equipment |
| Medical Products | Branded and generic pharmaceuticals, vaccines, surgical products, diagnostic tests, infection-control items, vitamins |
| Equipment Repair Services | Maintenance and repair of dental and medical equipment |
| Technology Solutions | Practice management software systems for dental and medical practitioners |
| Value-Added Services | Financial services, e-services, network and hardware services, continuing education, consulting |
Henry Schein’s portfolio spans broad healthcare distribution and technology services. Dental products dominate, supported by medical supplies and growing technology offerings, reflecting a diversified approach within healthcare distribution.
Main Competitors
There are 4 competitors in the Healthcare sector; below is the list of the top 4 leaders by market capitalization:
| Competitor | Market Cap. |
|---|---|
| McKesson Corporation | 103B |
| Cencora, Inc. | 65.7B |
| Cardinal Health, Inc. | 48.9B |
| Henry Schein, Inc. | 9.4B |
Henry Schein ranks 4th among its competitors, holding roughly 9.65% of the market cap of the leader, McKesson. The company sits below both the average market cap of the top 10 competitors (57B) and the sector median (57.3B). It has a substantial 392% gap separating it from the next competitor above, showing a significant scale difference within the peer group.
Comparisons with competitors
Check out how we compare the company to its competitors:
Does HSIC have a competitive advantage?
Henry Schein, Inc. currently shows a slightly unfavorable competitive advantage, with a declining ROIC that is below its WACC, indicating value erosion. Its profitability trend signals challenges in sustaining economic profits over the 2021-2025 period.
Looking ahead, HSIC’s diverse healthcare distribution and technology segments offer opportunities to expand practice management software and value-added services. Growth potential exists primarily through innovation and international market penetration.
SWOT Analysis
This SWOT analysis highlights Henry Schein, Inc.’s core strategic factors to guide investment decisions.
Strengths
- Strong market position in healthcare distribution
- Diverse product portfolio across dental and medical sectors
- Favorable gross margin and asset turnover
Weaknesses
- Declining ROIC indicates value erosion
- Weak quick ratio and high debt-to-equity ratio
- No dividend yield limits income appeal
Opportunities
- Expansion in technology and value-added services
- Growing healthcare demand in the U.S. market
- Potential for operational efficiency improvements
Threats
- Intense competition in medical distribution
- Regulatory risks in healthcare products
- Margin pressure from rising costs and price sensitivity
Henry Schein’s strengths in distribution and product diversity provide a solid foundation. However, weakening profitability and leverage pose risks. Strategic focus should target operational efficiencies and innovation to counter competitive and regulatory challenges.
Stock Price Action Analysis
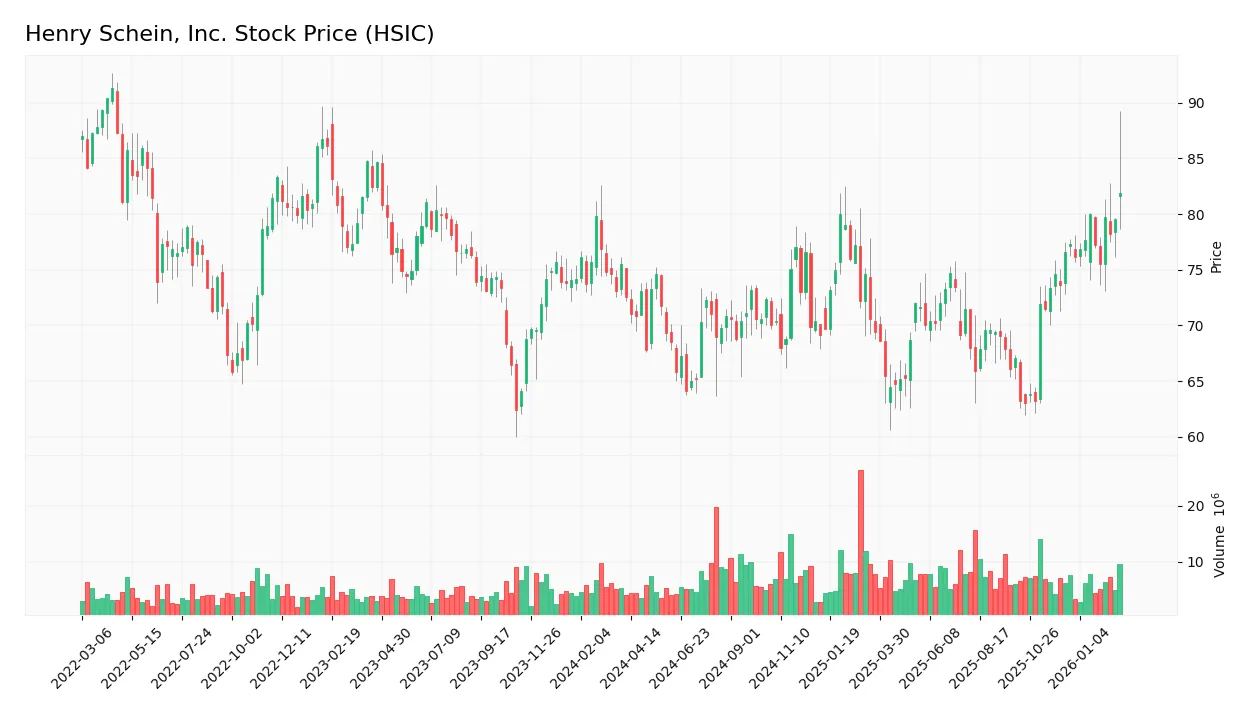
The weekly stock chart of Henry Schein, Inc. (HSIC) illustrates price movements and trading patterns over the past 12 months:
Trend Analysis
Over the past 12 months, HSIC’s stock price rose 12.95%, indicating a bullish trend with accelerating momentum. The price fluctuated between a low of 62.98 and a high of 81.91, with volatility measured by a 4.25 standard deviation. Recent three-month gains of 7.0% show a continued, steady uptrend.
Volume Analysis
Trading volume has increased overall, with total volume near 859M shares. Recent three-month activity is strongly buyer-driven, with buyers accounting for 72.02% of volume. This rise in buying pressure suggests growing investor confidence and heightened market participation.
Target Prices
Analysts set a clear target price consensus for Henry Schein, Inc. (HSIC), reflecting moderate upside potential.
| Target Low | Target High | Consensus |
|---|---|---|
| 81 | 100 | 90.17 |
The target range from 81 to 100 signals cautious optimism. The consensus near 90 suggests analysts expect steady growth but not aggressive expansion.

Don’t Let Luck Decide Your Entry Point
Optimize your entry points with our advanced ProRealTime indicators. You’ll get efficient buy signals with precise price targets for maximum performance. Start outperforming now!
Analyst & Consumer Opinions
This section examines analyst ratings and consumer feedback to provide a balanced view of Henry Schein, Inc.’s market perception.
Stock Grades
The following table summarizes recent stock grades from established financial institutions for Henry Schein, Inc.:
| Grading Company | Action | New Grade | Date |
|---|---|---|---|
| JP Morgan | Maintain | Overweight | 2026-02-25 |
| UBS | Maintain | Neutral | 2026-02-25 |
| Wells Fargo | Maintain | Equal Weight | 2026-02-25 |
| Evercore ISI Group | Maintain | Outperform | 2026-02-25 |
| Morgan Stanley | Maintain | Underweight | 2026-02-25 |
| Barrington Research | Maintain | Outperform | 2026-02-25 |
| Mizuho | Maintain | Neutral | 2026-02-25 |
| Leerink Partners | Maintain | Market Perform | 2026-02-24 |
| Baird | Upgrade | Outperform | 2026-02-23 |
| Mizuho | Maintain | Neutral | 2026-01-20 |
Most analysts maintain their previous views, with a cluster of neutral and outperform ratings. Notably, Baird upgraded the stock to Outperform, suggesting a modest positive shift within a broadly cautious consensus.
Consumer Opinions
Consumers widely recognize Henry Schein, Inc. for its reliable service and extensive product range, though some express concerns about pricing and order fulfillment delays.
| Positive Reviews | Negative Reviews |
|---|---|
| Fast and accurate order processing | Occasional delays in shipping |
| Comprehensive selection of medical supplies | Higher prices compared to competitors |
| Responsive and knowledgeable customer service | Limited availability of certain niche products |
| User-friendly online ordering platform | Inconsistent communication on order status |
Overall, customers appreciate Henry Schein’s vast inventory and dependable support. However, pricing and logistics challenges remain common pain points, suggesting room for operational improvements.
Risk Analysis
Below is a summary table of key risks facing Henry Schein, Inc., including their likelihood and potential impact:
| Category | Description | Probability | Impact |
|---|---|---|---|
| Financial Leverage | High debt-to-equity ratio (1.14) may strain cash flow and increase risk. | Medium | High |
| Liquidity | Quick ratio at 0.76 signals limited short-term liquidity relative to current liabilities. | Medium | Medium |
| Profitability | Low net margin (3.02%) weighs on earnings resilience amid competitive markets. | High | Medium |
| Market Volatility | Beta of 0.893 indicates sensitivity to market swings but less volatile than S&P 500. | Medium | Medium |
| Dividend Policy | No dividend yield reduces income appeal and may affect investor sentiment. | High | Low |
| Bankruptcy Risk | Altman Z-score of 2.87 places company in grey zone, signaling moderate distress risk. | Medium | High |
The most pressing risks are financial leverage and moderate bankruptcy risk. Henry Schein’s debt load is elevated relative to equity, raising caution about interest obligations in a rising rate environment. The Altman Z-score in the grey zone confirms this vulnerability. Despite favorable asset turnover, profitability remains thin, limiting buffers against economic downturns. Investors should watch liquidity closely, as the quick ratio below 1 raises red flags on immediate solvency.
Should You Buy Henry Schein, Inc.?
Henry Schein, Inc. appears to be a moderately profitable company with declining operational efficiency and a slightly unfavorable moat, suggesting erosion in value creation. Despite a manageable leverage profile, its overall financial rating could be seen as favorable but warrants caution given mixed credit and valuation signals.
Strength & Efficiency Pillars
Henry Schein, Inc. shows moderate profitability with a net margin of 3.02% and a return on equity of 12.27%. Its return on invested capital (6.58%) slightly exceeds the weighted average cost of capital (6.52%), indicating marginal value creation. The company maintains favorable operational efficiency, evidenced by asset turnover of 1.18 and fixed asset turnover of 14.3. Interest expense remains low at 1.14%, supporting operational stability despite neutral EBIT margins (5.27%).
Weaknesses and Drawbacks
Henry Schein sits in the Altman Z-Score grey zone at 2.87, suggesting moderate bankruptcy risk and warranting caution. The company’s debt-to-equity ratio of 1.14 is unfavorable, raising leverage concerns. Liquidity is strained with a quick ratio of 0.76, below the safe threshold. Valuation metrics are neutral to unfavorable: P/E stands at 23.11 and P/B at 2.83. The lack of dividend yield and moderate Piotroski score (5) further temper the profile.
Our Final Verdict about Henry Schein, Inc.
Henry Schein’s fundamentals reflect a mixed profile with moderate profitability and marginal value creation. The Altman Z-Score in the grey zone signals solvency risks, advising prudence. Despite a bullish long-term trend and strong recent buyer dominance (72.02%), investors might consider a wait-and-see approach to mitigate financial risks before committing capital.
Disclaimer: This content is for informational purposes only and does not constitute financial, investment, or other professional advice. Investing in financial markets involves a significant risk of loss, and past performance is not indicative of future results.
Additional Resources
- Henry Schein (HSIC): UBS Maintains “Neutral” Rating, Price Targe – GuruFocus (Feb 25, 2026)
- Henry Schein (HSIC) Stock Trades Up, Here Is Why – Yahoo Finance (Feb 24, 2026)
- Henry Schein Inc. Q4 Profit Advances – Nasdaq (Feb 24, 2026)
- These Analysts Increase Their Forecasts On Henry Schein After Upbeat Q4 Results – Benzinga (Feb 25, 2026)
- Henry Schein, Inc. (NASDAQ:HSIC) Q4 2025 Earnings Call Transcript – Insider Monkey (Feb 25, 2026)
For more information about Henry Schein, Inc., please visit the official website: henryschein.com