Home > Analyses > Consumer Defensive > Helen of Troy Limited
Helen of Troy Limited transforms everyday routines with its broad portfolio of trusted consumer products, spanning household essentials, health devices, and beauty innovations. Renowned for brands like OXO, Hydro Flask, and Braun, the company leads in delivering quality and convenience across global markets. As it navigates evolving consumer trends and competitive pressures, the key question remains: does Helen of Troy’s current financial health and market position support sustained growth and justify its valuation in 2026?

Table of contents
Business Model & Company Overview
Helen of Troy Limited, founded in 1968 and headquartered in El Paso, Texas, stands as a leading player in the Household & Personal Products industry. The company’s ecosystem integrates diverse consumer brands like OXO, Hydro Flask, and Braun, delivering an extensive range of home, health, and beauty products. This multi-segment approach unites everyday essentials with innovative solutions, serving markets in the Americas, Europe, Asia, and beyond.
Helen of Troy’s revenue engine balances durable goods and consumables across three key segments: Home & Outdoor, Health & Wellness, and Beauty. Its widespread distribution network spans mass merchandisers, specialty stores, and e-commerce platforms globally. This strategic footprint, coupled with recognizable brands and a broad product portfolio, underpins a durable economic moat, positioning Helen of Troy as a key influencer shaping consumer lifestyle trends worldwide.
Financial Performance & Fundamental Metrics
I will analyze Helen of Troy Limited’s income statement, key financial ratios, and dividend payout policy to provide a clear picture of its fundamental health.
Income Statement
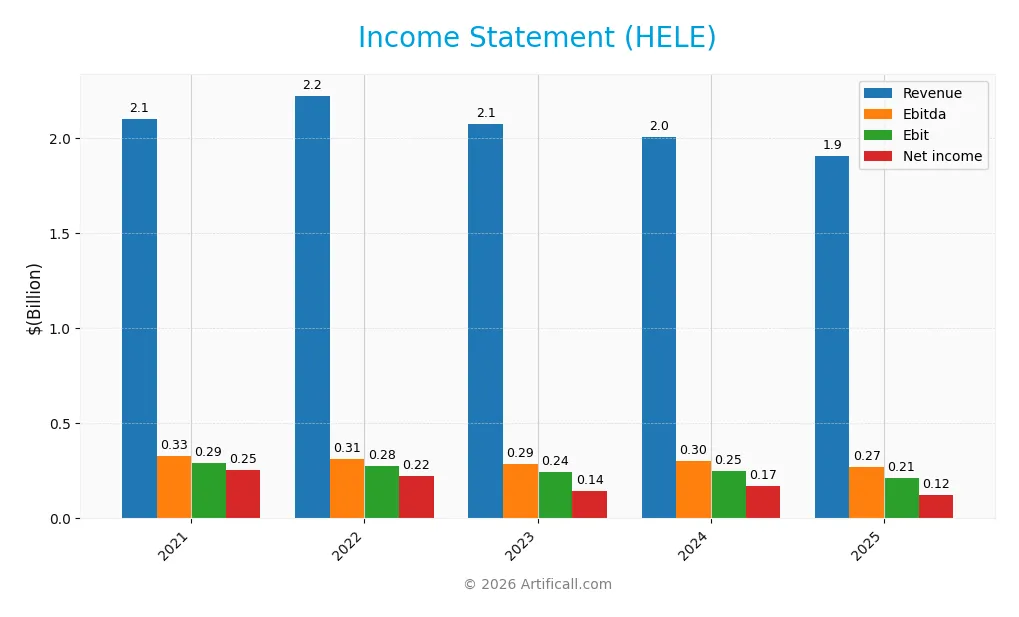
The table below presents Helen of Troy Limited’s key income statement figures for fiscal years 2021 through 2025, reported in USD.
| 2021 | 2022 | 2023 | 2024 | 2025 | |
|---|---|---|---|---|---|
| Revenue | 2.10B | 2.22B | 2.07B | 2.01B | 1.91B |
| Cost of Revenue | 1.17B | 1.27B | 1.17B | 1.06B | 993M |
| Operating Expenses | 646M | 681M | 688M | 688M | 772M |
| Gross Profit | 927M | 953M | 899M | 949M | 914M |
| EBITDA | 329M | 311M | 287M | 301M | 269M |
| EBIT | 291M | 275M | 242M | 250M | 214M |
| Interest Expense | 13M | 13M | 41M | 53M | 52M |
| Net Income | 254M | 224M | 143M | 169M | 124M |
| EPS | 10.16 | 9.27 | 5.98 | 7.06 | 5.38 |
| Filing Date | 2021-04-29 | 2022-04-28 | 2023-04-27 | 2024-04-24 | 2025-04-24 |
Income Statement Evolution
Helen of Troy’s revenue declined by 4.86% in the most recent year and by 9.11% over the 2021-2025 period, indicating a downward trend. Net income fell sharply by 22.85% year-over-year and 51.27% overall. Despite these decreases, gross margin remained stable at 47.93%, and ebit margin held a favorable 11.19%, suggesting some margin resilience amid shrinking top-line figures.
Is the Income Statement Favorable?
The 2025 income statement shows net income of $124M on $1.91B revenue, with a net margin of 6.49%, all classified as favorable metrics. However, the significant declines in revenue, net income, and earnings per share signal underlying challenges. Interest expense remains manageable at 2.72% of revenue. Overall, the fundamentals appear unfavorable given the persistent downward growth trends despite solid margin ratios.
Financial Ratios
The following table presents key financial ratios for Helen of Troy Limited (HELE) over the fiscal years 2021 to 2025, providing insight into profitability, valuation, liquidity, leverage, and operational efficiency:
| Ratios | 2021 | 2022 | 2023 | 2024 | 2025 |
|---|---|---|---|---|---|
| Net Margin | 12% | 10% | 7% | 8% | 6% |
| ROE | 20% | 17% | 10% | 10% | 7% |
| ROIC | 16% | 11% | 7% | 9% | 5% |
| P/E | 22 | 22 | 19 | 18 | 10 |
| P/B | 4.47 | 3.78 | 1.82 | 1.84 | 0.75 |
| Current Ratio | 1.58 | 1.80 | 2.16 | 1.87 | 2.00 |
| Quick Ratio | 0.80 | 0.87 | 1.06 | 0.99 | 1.03 |
| D/E | 0.31 | 0.65 | 0.66 | 0.43 | 0.57 |
| Debt-to-Assets | 17% | 30% | 34% | 25% | 31% |
| Interest Coverage | 22 | 21 | 5 | 5 | 3 |
| Asset Turnover | 0.93 | 0.79 | 0.71 | 0.71 | 0.61 |
| Fixed Asset Turnover | 12.4 | 9.1 | 5.3 | 5.4 | 5.2 |
| Dividend Yield | 0% | 0% | 0% | 0% | 0% |
Evolution of Financial Ratios
From 2021 to 2025, Helen of Troy Limited’s Return on Equity (ROE) declined from 20.49% to 7.35%, indicating reduced profitability. The Current Ratio improved from 1.58 to 2.0, suggesting enhanced liquidity. The Debt-to-Equity Ratio rose moderately from 0.31 to 0.57, reflecting a moderate increase in leverage over the period. Profitability margins showed a downward trend, with the net profit margin falling from 12.1% to 6.49%.
Are the Financial Ratios Favorable?
In 2025, Helen of Troy’s financial ratios present a mixed picture. Profitability indicators such as ROE and net margin are neutral to unfavorable, with ROE at 7.35% deemed unfavorable. Liquidity ratios, including a Current Ratio of 2.0 and Quick Ratio of 1.03, are favorable, indicating solid short-term financial health. Leverage ratios, including a Debt-to-Equity of 0.57 and debt-to-assets at 30.55%, are neutral. Market valuation ratios like P/E at 10.25 and P/B at 0.75 are favorable. Overall, 42.86% of ratios are favorable, 14.29% unfavorable, and 42.86% neutral, resulting in a slightly favorable assessment.
Shareholder Return Policy
Helen of Troy Limited (HELE) does not pay dividends, reflecting a zero dividend payout ratio and yield across recent fiscal years. The company appears to prioritize reinvestment and growth, supported by positive net income and free cash flow, with no indication of share buyback programs.
This no-dividend approach, coupled with a focus on capital expenditures and operational cash flow, suggests management aims to sustain long-term value creation. The absence of direct shareholder distributions aligns with a strategy emphasizing internal funding over immediate returns.
Score analysis
The following radar chart presents an overview of Helen of Troy Limited’s key financial scores across several valuation and performance metrics:
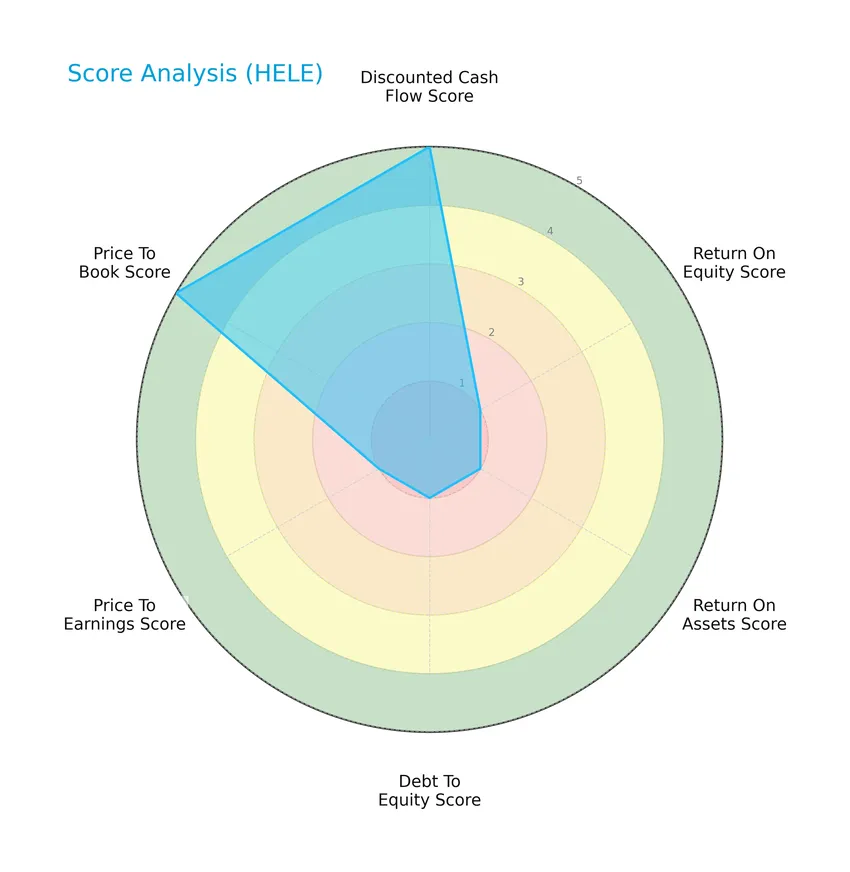
The scores reveal a mixed financial profile: a very favorable discounted cash flow and price-to-book scores contrast sharply with very unfavorable returns on equity and assets, debt-to-equity, and price-to-earnings scores, indicating uneven financial health and valuation metrics.
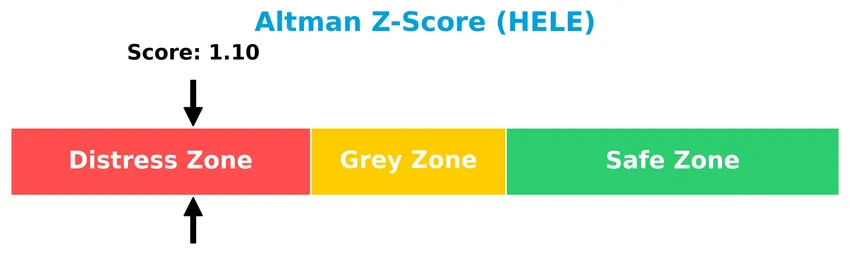
Analysis of the company’s bankruptcy risk
Helen of Troy Limited’s Altman Z-Score places it in the distress zone, suggesting a high risk of bankruptcy according to this financial stability indicator:
Is the company in good financial health?
This Piotroski diagram illustrates the company’s financial strength based on nine fundamental criteria:

With a Piotroski Score of 3, Helen of Troy Limited is categorized as very weak in financial health, highlighting significant challenges in profitability, leverage, liquidity, or efficiency metrics.
Competitive Landscape & Sector Positioning
This sector analysis will examine Helen of Troy Limited’s strategic positioning, revenue by segment, key products, main competitors, and competitive advantages. I will also try to determine whether the company holds a competitive advantage over its peers.
Strategic Positioning
Helen of Troy Limited maintains a diversified product portfolio across three main segments: Beauty & Wellness, Home & Outdoor, and previously Health & Wellness. Geographically, the company generates the majority of its revenue from the United States (over 1.3B in 2025) with significant exposure to EMEA, Asia Pacific, Canada, and Latin America, reflecting a broad international footprint.
Revenue by Segment
This pie chart illustrates Helen of Troy Limited’s revenue distribution by business segments for the fiscal year 2025.
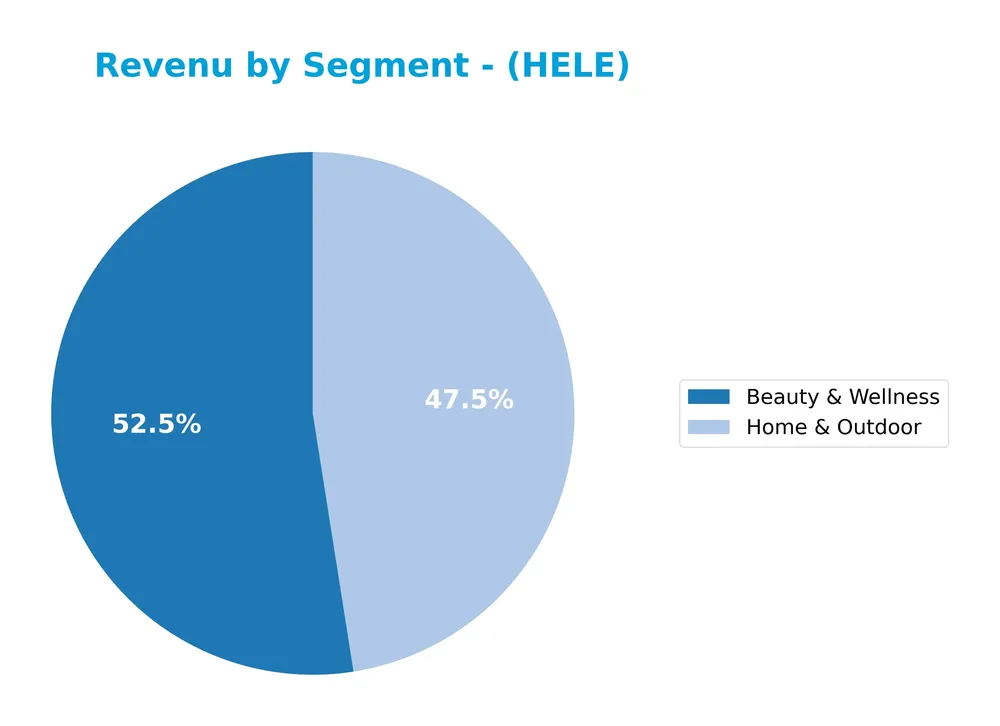
In 2025, Helen of Troy’s revenue was primarily driven by the Beauty & Wellness segment, which generated 1B in revenue, followed by Home & Outdoor with 906M. The Beauty & Wellness segment shows a decline compared to previous years where it peaked above 1.15B in 2023, indicating a recent slowdown. Meanwhile, Home & Outdoor remains relatively stable around 900M, suggesting steady demand. The concentration in these two segments highlights a risk if either faces market challenges.
Key Products & Brands
The table below details Helen of Troy Limited’s key products and brands across its main business segments:
| Product | Description |
|---|---|
| Home & Outdoor | Food preparation tools, storage containers, coffee makers, household cleaning products, feeding and drinking products, outdoor packs. |
| Health & Wellness | Thermometers, blood pressure monitors, pulse oximeters, humidifiers, water-filtration systems, air purifiers, heaters, and fans. |
| Beauty | Grooming brushes, hair styling and conditioning products, decorative hair accessories, hair appliances. |
| OXO | Consumer products including Good Grips kitchen tools, OXO tot, OXO Brew, and OXO Outdoor lines. |
| Hydro Flask | Insulated water bottles, hydration packs, drinkware, mugs, and soft coolers. |
| Osprey | Technical and outdoor sports packs, travel packs, luggage, daypacks, and everyday packs. |
| PUR | Faucet mount and pitcher-based water-filtration systems. |
| Honeywell | Air purifiers, heaters, fans, and humidifiers. |
| Braun | Personal care appliances and grooming tools. |
| Vicks | Health and wellness products including humidifiers and nasal aspirators. |
| Drybar | Hair care and styling products. |
| Hot Tools | Hair styling appliances. |
| Revlon | Beauty products including hair care and styling items. |
| Bed Head | Hair styling and treatment products. |
Helen of Troy Limited offers a diverse portfolio spanning Home & Outdoor, Health & Wellness, and Beauty segments, with strong brand recognition in consumer products. This diversity supports its presence in multiple retail channels globally.
Main Competitors
Helen of Troy Limited faces competition from 17 companies in its sector, with the table below presenting the top 10 leaders by market capitalization:
| Competitor | Market Cap. |
|---|---|
| The Procter & Gamble Company | 331.3B |
| Unilever PLC | 143.2B |
| Colgate-Palmolive Company | 62.6B |
| The Estée Lauder Companies Inc. | 38.5B |
| Kimberly-Clark Corporation | 33.7B |
| Kenvue Inc. | 33.2B |
| Church & Dwight Co., Inc. | 20.2B |
| The Clorox Company | 12.3B |
| e.l.f. Beauty, Inc. | 4.3B |
| Inter Parfums, Inc. | 2.7B |
Helen of Troy Limited ranks 15th among 17 competitors, with a market cap just 0.13% that of the leader, Procter & Gamble. The company is positioned below both the average market cap of the top 10 competitors (68.2B) and the sector median (4.3B). It holds a significant 87.65% market cap gap to the next competitor above, indicating a sizable challenge in closing that distance.
Comparisons with competitors
Check out how we compare the company to its competitors:
Does HELE have a competitive advantage?
Helen of Troy Limited does not present a competitive advantage as it is currently destroying value, with a declining return on invested capital (ROIC) that is below its weighted average cost of capital (WACC). The company’s profitability metrics show a generally unfavorable trend, including shrinking revenue and net margin over the 2021-2025 period.
Looking ahead, Helen of Troy operates diverse consumer product segments across multiple global markets, including Home & Outdoor, Health & Wellness, and Beauty. Opportunities may arise from expanding product lines and geographic reach, but the company’s recent financial performance signals challenges in sustaining value creation.
SWOT Analysis
This SWOT analysis highlights Helen of Troy Limited’s current strategic position to guide potential investors in decision-making.
Strengths
- strong brand portfolio
- favorable gross and EBIT margins
- solid liquidity ratios
Weaknesses
- declining revenue and net income trends
- weak return on equity and assets
- no dividend yield
Opportunities
- expanding health & wellness market
- potential for international growth
- innovation in home and beauty products
Threats
- intense competition in consumer products
- economic sensitivity impacting discretionary spending
- financial distress risk indicated by low Altman Z-score
Overall, Helen of Troy shows operational strengths and a resilient balance sheet but faces significant challenges with declining profitability and financial health. Strategic focus should be on reversing revenue decline and strengthening profitability to mitigate financial risks.
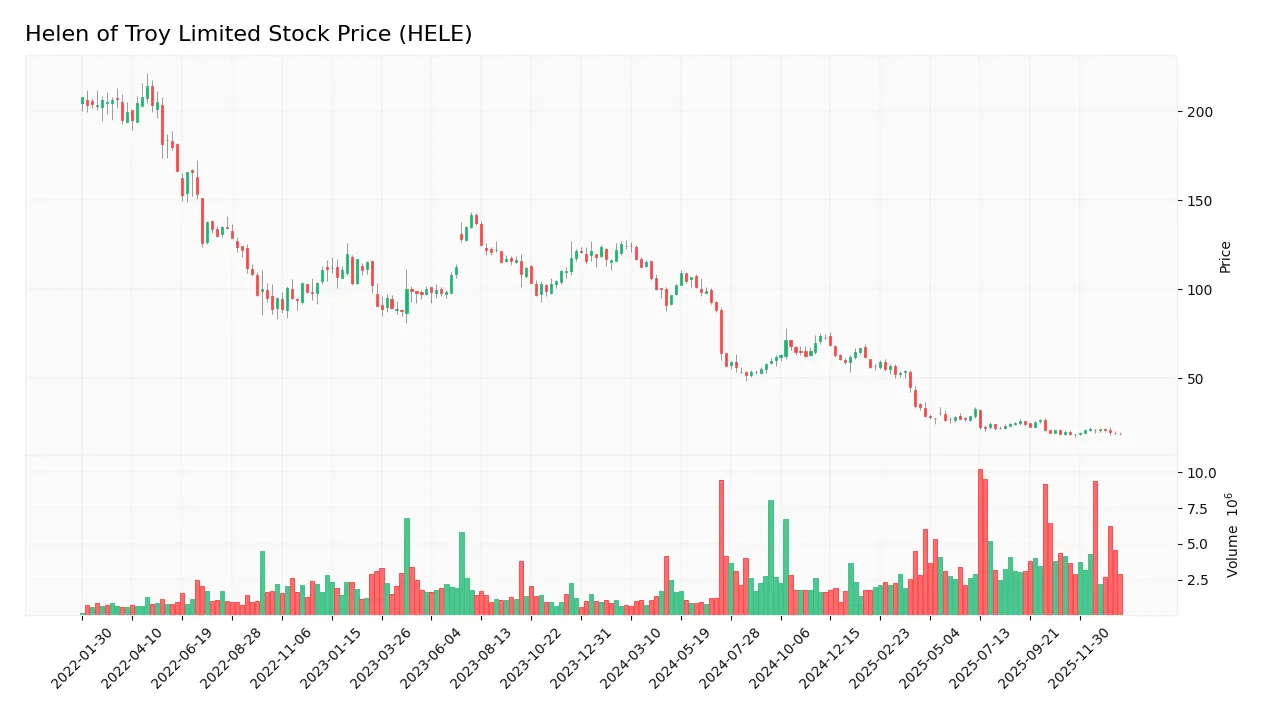
Stock Price Action Analysis
The following weekly chart illustrates Helen of Troy Limited’s stock price movements over the past 100 weeks, highlighting key trends and volatility:
Trend Analysis
Over the past 100 weeks, Helen of Troy Limited’s stock price declined sharply by 85.29%, indicating a strong bearish trend with accelerating downward momentum. The price moved from a high of 124.37 to a low of 18.3, with notable volatility reflected by a standard deviation of 30.47. Recent weeks show a minor 5.67% decline, maintaining a bearish but decelerating slope.
Volume Analysis
Trading volume over the last three months shows an increasing trend, totaling approximately 50.9M shares traded, with seller volume dominating at 64.76%. Buyer activity weakened to 35.24%, indicating a seller-driven market. This suggests cautious investor sentiment with stronger selling pressure and reduced market participation from buyers.
Target Prices
The consensus target price for Helen of Troy Limited (HELE) is clearly defined by analysts.
| Target High | Target Low | Consensus |
|---|---|---|
| 22 | 22 | 22 |
Analysts uniformly expect HELE’s stock price to reach $22, indicating a stable and precise outlook with no divergence in target estimates.

Don’t Let Luck Decide Your Entry Point
Optimize your entry points with our advanced ProRealTime indicators. You’ll get efficient buy signals with precise price targets for maximum performance. Start outperforming now!
Analyst & Consumer Opinions
This section examines the latest analyst ratings and consumer feedback regarding Helen of Troy Limited (HELE).
Stock Grades
Here is the summary of the latest reliable stock grades for Helen of Troy Limited from leading financial analysts:
| Grading Company | Action | New Grade | Date |
|---|---|---|---|
| UBS | Maintain | Neutral | 2026-01-09 |
| Canaccord Genuity | Maintain | Hold | 2026-01-09 |
| Canaccord Genuity | Maintain | Hold | 2026-01-06 |
| UBS | Maintain | Neutral | 2025-10-10 |
| Canaccord Genuity | Maintain | Hold | 2025-10-10 |
| UBS | Maintain | Neutral | 2025-10-02 |
| Canaccord Genuity | Downgrade | Hold | 2025-07-11 |
| UBS | Maintain | Neutral | 2025-07-11 |
| Canaccord Genuity | Maintain | Buy | 2025-07-07 |
| Canaccord Genuity | Maintain | Buy | 2025-04-25 |
The consensus remains steady at a Hold rating, reflecting cautious sentiment with UBS consistently maintaining Neutral grades and Canaccord Genuity showing a recent downgrade from Buy to Hold. This indicates a stable but cautious outlook on the stock.
Consumer Opinions
Consumers of Helen of Troy Limited (HELE) have expressed a mix of enthusiasm and concerns, reflecting diverse experiences with the company’s products and services.
| Positive Reviews | Negative Reviews |
|---|---|
| “Great product quality and longevity, truly worth the price.” | “Customer service response times can be slow.” |
| “Innovative design and user-friendly features.” | “Some items feel overpriced compared to competitors.” |
| “Reliable performance over months of use.” | “Limited availability in certain regions.” |
Overall, Helen of Troy’s products are praised for quality and innovation, though customers often highlight issues with customer support and pricing. These insights suggest a strong product base with room for service improvement.
Risk Analysis
Below is a table summarizing the key risks associated with investing in Helen of Troy Limited (HELE), highlighting their probability and potential impact:
| Category | Description | Probability | Impact |
|---|---|---|---|
| Financial Health | Altman Z-score at 1.10 signals distress zone, indicating a high risk of financial instability. | High | High |
| Profitability | Low ROE (7.35%) and weak Piotroski score (3) suggest poor profitability and financial strength. | High | Medium |
| Market Volatility | Stock price range wide (17.01-69.05) with recent 3.8% decline indicates price volatility risk. | Medium | Medium |
| Competitive Sector | Operating in Consumer Defensive, facing strong competition and evolving consumer trends. | Medium | Medium |
| Dividend Policy | No dividend payout can deter income-focused investors, limiting appeal in certain portfolios. | Medium | Low |
The most critical risks are the company’s financial distress signal from the Altman Z-score and weak profitability indicators. These factors raise caution about potential solvency issues despite a favorable valuation and moderate liquidity. Investors should weigh these risks carefully when considering HELE for their portfolios.
Should You Buy Helen of Troy Limited?
Helen of Troy Limited appears to be facing significant challenges, with declining profitability suggesting value erosion and a very unfavorable competitive moat. Despite a manageable leverage profile, the company’s financial strength is moderate at best, reflected in a B- rating and distress zone risk indicators.
Strength & Efficiency Pillars
Helen of Troy Limited shows mixed efficiency signals. The company maintains a solid gross margin of 47.93% and an EBIT margin of 11.19%, supporting operational profitability. Its net margin stands at 6.49%, reflecting moderate bottom-line returns. Financial health indicators display caution: the Altman Z-Score at 1.10 places the company in the distress zone, and the Piotroski score of 3 signals very weak financial strength. ROIC of 5.34% trails its WACC of 5.65%, indicating the company is currently not a value creator.
Weaknesses and Drawbacks
Significant concerns arise from valuation and leverage metrics. Despite a reasonable P/E ratio of 10.25 and a favorable P/B of 0.75, the company’s debt-to-equity ratio is at a moderate 0.57, which combined with a current ratio of 2.0 suggests manageable but notable leverage. The distress zone Altman Z-Score highlights elevated bankruptcy risk. Market pressure is evident with a bearish overall stock trend marked by an 85.29% price decline and seller dominance in recent periods, where buyers account for only 35.24% of volume, creating a challenging short-term environment.
Our Verdict about Helen of Troy Limited
Helen of Troy’s long-term fundamental profile may appear unfavorable due to declining profitability and financial distress signals. Despite some operational profitability and favorable valuation metrics, the bearish technical trend and recent seller dominance suggest that, despite its intrinsic potential, investors might consider a cautious wait-and-see approach before adding this stock for long-term exposure.
Disclaimer: This content is for informational purposes only and does not constitute financial, investment, or other professional advice. Investing in financial markets involves a significant risk of loss, and past performance is not indicative of future results.
Additional Resources
- Helen Of Troy Ltd (HELE) Q3 2026 Earnings Call Highlights: Navigating Challenges with Strategic … – Yahoo Finance (Jan 08, 2026)
- UBS retains a neutral rating on Helen of Troy Limited (HELE) – MSN (Jan 21, 2026)
- Helen of Troy Limited (NASDAQ:HELE) Short Interest Update – MarketBeat (Jan 19, 2026)
- Helen Of Troy Q3 Results: Macro Headwinds Persist, Shares A Hold (HELE) – Seeking Alpha (Jan 08, 2026)
- Some Confidence Is Lacking In Helen of Troy Limited (NASDAQ:HELE) As Shares Slide 28% – simplywall.st (Nov 01, 2025)
For more information about Helen of Troy Limited, please visit the official website: helenoftroy.com