Home > Analyses > Real Estate > Healthpeak Properties, Inc.
Healthpeak Properties, Inc. transforms the healthcare real estate landscape by delivering specialized facilities that support medical innovation and patient care. As a prominent REIT, it commands a strong position in healthcare discovery and delivery spaces, known for quality assets and strategic development. With a reputation for steady operational execution, Healthpeak’s ability to sustain growth and dividends invites scrutiny. I question whether its fundamentals continue to justify its valuation and growth outlook in today’s evolving market.

Table of contents
Business Model & Company Overview
Healthpeak Properties, Inc., founded in 1985 and headquartered in Denver, CO, stands as a dominant player in the healthcare real estate sector. As a fully integrated REIT and S&P 500 constituent, it operates a cohesive ecosystem centered on owning, operating, and developing high-quality properties tailored for healthcare discovery and delivery. This focus positions the company uniquely within the real estate industry.
Healthpeak generates revenue through a balanced mix of property leasing and development, targeting healthcare providers across the Americas, Europe, and Asia. Its portfolio blends stable rental income with growth from strategic property developments. The company’s competitive advantage lies in its specialized asset base, creating a durable economic moat that shapes the future infrastructure of healthcare delivery.
Financial Performance & Fundamental Metrics
I analyze Healthpeak Properties, Inc.’s income statement, key financial ratios, and dividend payout policy to evaluate its underlying business strength and shareholder returns.
Income Statement
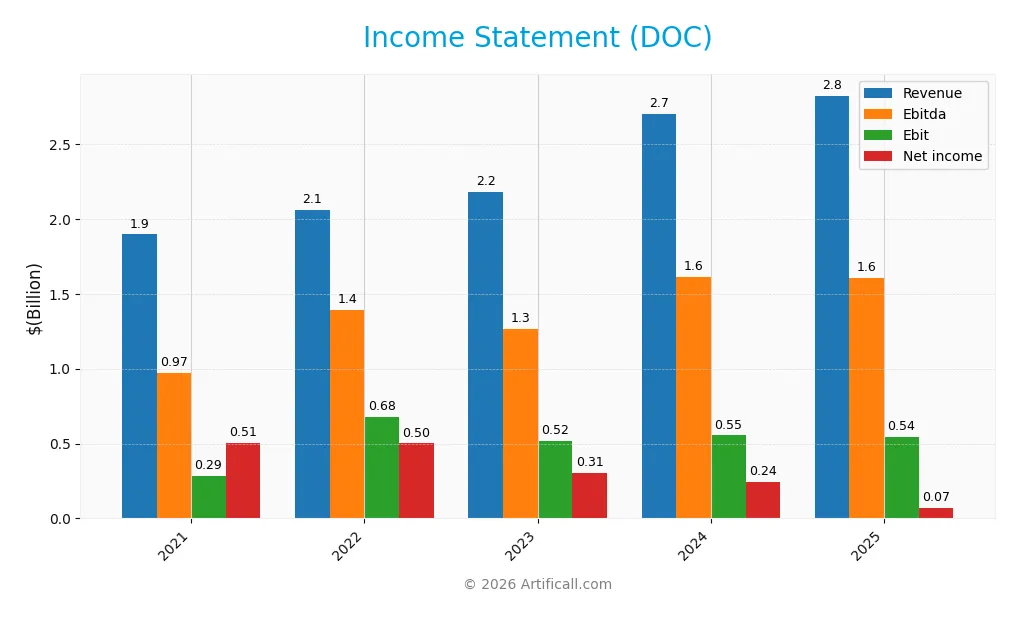
The table below summarizes Healthpeak Properties, Inc.’s key income statement metrics for fiscal years 2021 through 2025 in USD.
| 2021 | 2022 | 2023 | 2024 | 2025 | |
|---|---|---|---|---|---|
| Revenue | 1.90B | 2.06B | 2.18B | 2.70B | 2.82B |
| Cost of Revenue | 773M | 863M | 902M | 1.07B | 2.19B |
| Operating Expenses | 783M | 842M | 845M | 1.15B | 90M |
| Gross Profit | 1.12B | 1.20B | 1.28B | 1.63B | 635M |
| EBITDA | 971M | 1.39B | 1.27B | 1.61B | 1.60B |
| EBIT | 286M | 680M | 515M | 554M | 544M |
| Interest Expense | 158M | 173M | 200M | 280M | 305M |
| Net Income | 506M | 500M | 306M | 243M | 71M |
| EPS | 0.93 | 0.92 | 0.56 | 0.36 | 0.10 |
| Filing Date | 2022-02-09 | 2023-02-08 | 2024-02-09 | 2025-02-04 | 2026-02-03 |
Income Statement Evolution
Healthpeak Properties, Inc. saw revenue rise steadily by 4.5% in 2025, continuing a favorable 48.9% growth since 2021. However, gross profit plummeted nearly 61% year-over-year, compressing margins. EBIT declined by 1.7%, while net income dropped sharply, dragging net margin down. Operating expenses grew in line with revenue, showing some cost control stability.
Is the Income Statement Favorable?
The 2025 income statement reveals mixed fundamentals. Gross margin remains favorable at 22.5%, supported by a solid EBIT margin of 19.3%. Yet, interest expense at 10.8% of revenue weighs heavily, undermining profitability. The net margin of 2.5% is neutral but reflects a steep decline in bottom-line performance. Overall, income trends and margin pressures suggest an unfavorable profile.
Financial Ratios
The following table summarizes key financial ratios for Healthpeak Properties, Inc. (DOC) over the past five fiscal years:
| Ratios | 2021 | 2022 | 2023 | 2024 | 2025 |
|---|---|---|---|---|---|
| Net Margin | 27% | 24% | 14% | 9% | 3% |
| ROE | 7.8% | 7.5% | 4.8% | 2.9% | 1.0% |
| ROIC | 2.3% | 2.4% | 2.9% | 2.4% | 21.4% |
| P/E | 38.5 | 27.0 | 35.4 | 56.3 | 157.0 |
| P/B | 3.0 | 2.0 | 1.7 | 1.6 | 1.5 |
| Current Ratio | 0.37 | 0.34 | 0.41 | 1.13 | 1.09 |
| Quick Ratio | 0.37 | 0.34 | 0.41 | 1.13 | 1.09 |
| D/E | 0.98 | 1.01 | 1.12 | 1.07 | 1.39 |
| Debt-to-Assets | 42% | 43% | 45% | 45% | 51% |
| Interest Coverage | 2.15 | 2.06 | 2.17 | 1.68 | 1.78 |
| Asset Turnover | 0.12 | 0.13 | 0.14 | 0.14 | 0.14 |
| Fixed Asset Turnover | 8.1 | 8.7 | 9.1 | 6.4 | 6.8 |
| Dividend Yield | 3.3% | 4.8% | 6.1% | 5.8% | 7.6% |
Evolution of Financial Ratios
From 2021 to 2025, Healthpeak Properties, Inc.’s Return on Equity (ROE) declined sharply from 7.76% to 0.95%, indicating weakening profitability. The Current Ratio increased modestly from 0.37 to 1.09, showing improved short-term liquidity. Meanwhile, the Debt-to-Equity Ratio rose from 0.98 to 1.39, reflecting higher leverage and increased financial risk.
Are the Financial Ratios Favorable?
In 2025, the company displays a mix of strengths and weaknesses. Its ROIC at 21.39% exceeds the WACC of 6.4%, signaling value creation. However, low net margin (2.53%) and weak ROE (0.95%) raise concerns. Liquidity is neutral to favorable with a Current Ratio of 1.09 and Quick Ratio of 1.09. Leverage ratios, including a Debt-to-Equity of 1.39 and interest coverage of 1.78, are unfavorable. Asset turnover is low at 0.14, while fixed asset turnover remains strong at 6.85. Overall, the financial ratios are slightly unfavorable.
Shareholder Return Policy
Healthpeak Properties, Inc. maintains a dividend payout ratio around 12% with a robust dividend yield near 7.6%. The dividend per share shows a stable trend, supported by consistent free cash flow coverage and manageable capital expenditures. The company also engages in share buybacks, complementing its dividend distributions.
This balanced approach suggests a focus on sustainable shareholder returns without overextending resources. However, the company’s high debt levels and modest net profit margins warrant caution. Overall, the distribution policy appears aligned with maintaining long-term value creation while managing financial risks prudently.
Score analysis
The following radar chart illustrates key financial scores reflecting valuation, profitability, and leverage metrics:
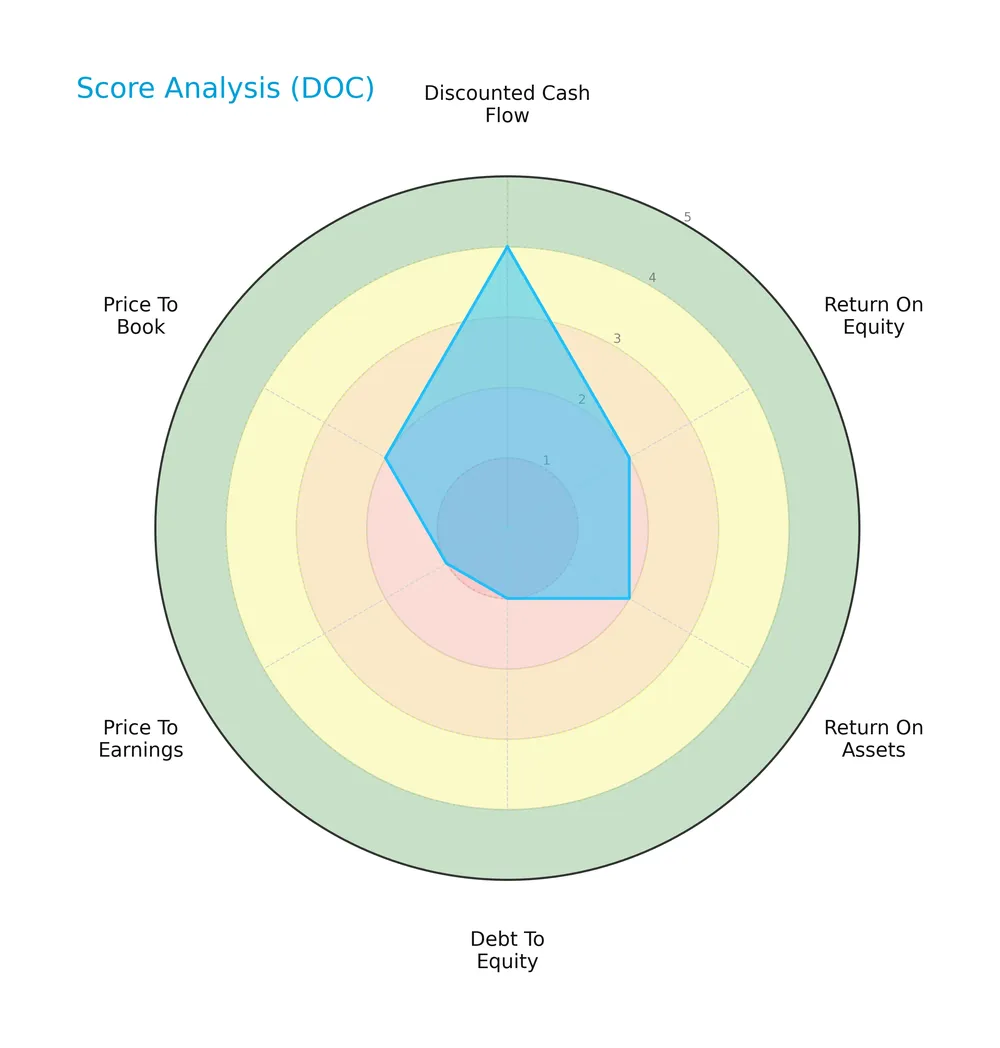
Healthpeak Properties, Inc. shows a favorable discounted cash flow score of 4. However, return on equity and assets scores are moderate at 2 each. Debt-to-equity and price-to-earnings scores are very unfavorable at 1, while price-to-book is moderate at 2.
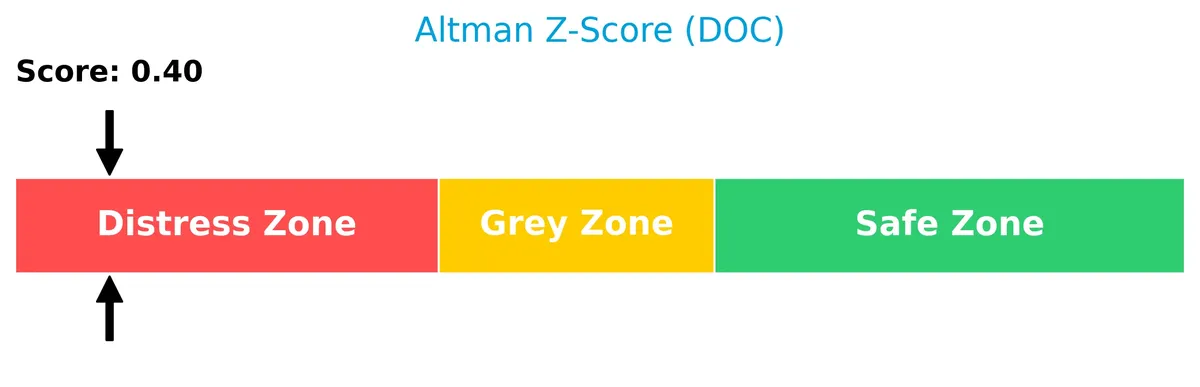
Analysis of the company’s bankruptcy risk
The Altman Z-Score places the company in the distress zone, signaling a high risk of bankruptcy based on financial ratios:
Is the company in good financial health?
The Piotroski Score diagram provides insight into the company’s financial strength using nine fundamental criteria:

With a Piotroski Score of 6, Healthpeak Properties, Inc. demonstrates average financial health. This suggests moderate operational efficiency and profitability but leaves room for improvement in financial robustness.
Competitive Landscape & Sector Positioning
This analysis explores Healthpeak Properties, Inc.’s strategic positioning within the healthcare REIT sector. I will assess its revenue segments, key products, and main competitors. I aim to determine whether Healthpeak holds a competitive advantage over its peers in this specialized real estate market.
Strategic Positioning
Healthpeak Properties, Inc. focuses on healthcare real estate, generating $1.27B from outpatient medical buildings, $860M from labs, and $604M from senior housing in 2025. Its portfolio targets specialized healthcare facilities, concentrating geographic exposure primarily within the U.S. market.
Revenue by Segment
This pie chart illustrates Healthpeak Properties, Inc.’s revenue distribution by segment for the full fiscal year 2025.
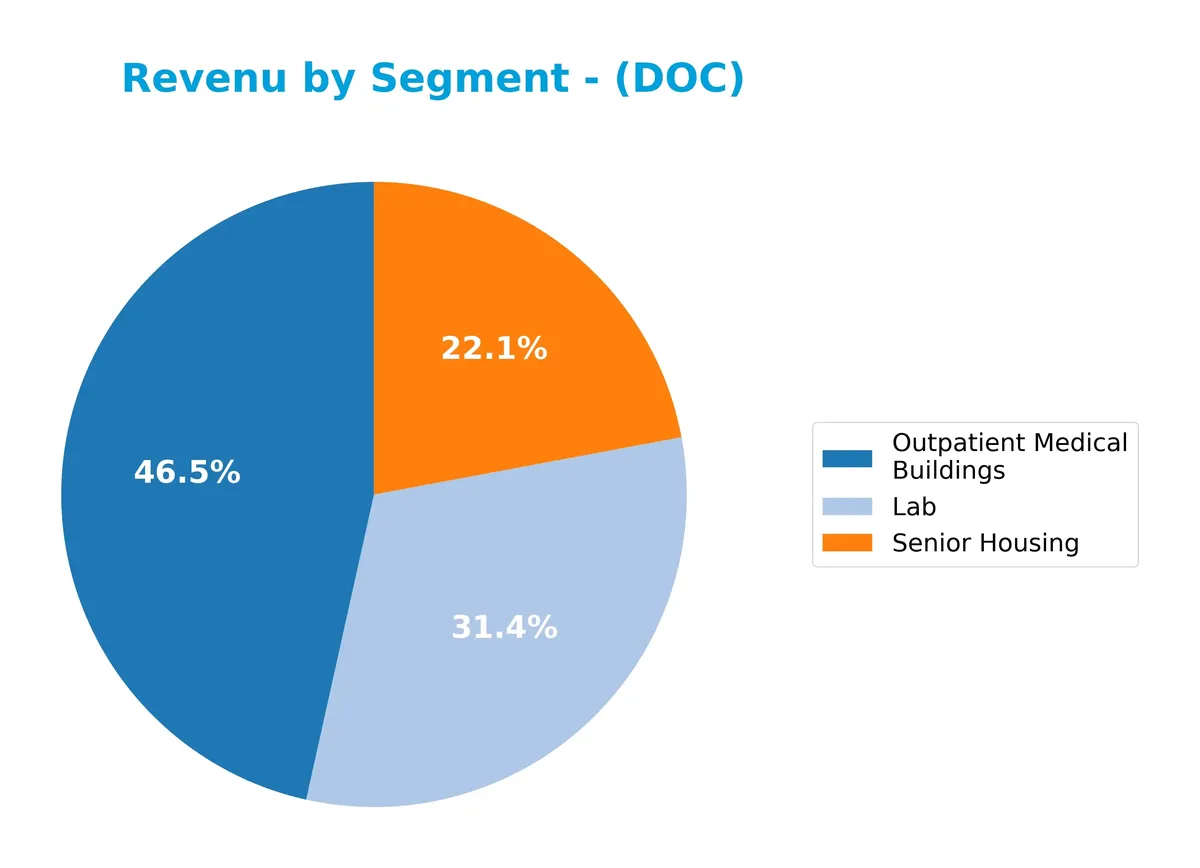
Healthpeak’s revenue primarily comes from Outpatient Medical Buildings, generating 1.27B. The Lab segment follows with 860M, while Senior Housing contributes 604M. The concentration in outpatient facilities signals a strategic focus on medical real estate. Senior Housing, while smaller, remains a significant part of the portfolio. The data suggests steady diversification without major shifts or emerging concentration risks in 2025.
Key Products & Brands
Healthpeak Properties generates revenue from distinct healthcare real estate segments as follows:
| Product | Description |
|---|---|
| Lab | Real estate facilities dedicated to healthcare laboratory operations, generating $860M in revenue in 2025. |
| Outpatient Medical Buildings | Properties designed for outpatient medical services, with revenue of $1.27B in 2025. |
| Senior Housing | Real estate assets focused on senior living accommodations, contributing $604M in 2025 revenue. |
Healthpeak’s portfolio centers on specialized healthcare real estate, balancing stable outpatient and senior housing assets with lab facilities. This mix reflects a focused strategy within the healthcare REIT sector.
Main Competitors
There are 3 competitors in this sector, with the table below showing the top 3 leaders by market capitalization:
| Competitor | Market Cap. |
|---|---|
| Welltower Inc. | 128.3B |
| Ventas, Inc. | 34.2B |
| Healthpeak Properties, Inc. | 11.3B |
Healthpeak Properties ranks 3rd among its competitors with a market cap just 9.1% of the leader, Welltower Inc. It sits below both the average market cap of the top 10 (57.9B) and the sector median (34.2B). The company has a significant 192.5% market cap gap to its nearest competitor above, Ventas, Inc.
Comparisons with competitors
Check out how we compare the company to its competitors:
Does Healthpeak Properties have a competitive advantage?
Healthpeak Properties demonstrates a sustainable competitive advantage, creating value with a ROIC 15% above WACC and a strong upward ROIC trend since 2021. This performance signals efficient capital use and growing profitability in the healthcare REIT sector.
Looking ahead, the company’s focus on high-quality healthcare real estate supports stable revenue streams across labs, outpatient medical buildings, and senior housing. Expansion in these segments offers continued opportunities to leverage its integrated platform and market position.
SWOT Analysis
This analysis highlights Healthpeak Properties, Inc.’s core competitive factors and challenges to guide strategic decisions.
Strengths
- strong ROIC well above WACC
- growing ROIC trend signals value creation
- stable dividend yield at 7.59%
Weaknesses
- weak net margin and declining profitability
- high debt-to-equity ratio raises financial risk
- Altman Z-score indicates distress zone
Opportunities
- expanding healthcare real estate demand
- potential for operational efficiency improvements
- favorable fixed asset turnover supports growth
Threats
- interest expenses pressure earnings
- competitive REIT healthcare market
- economic downturns affect tenant stability
Healthpeak shows a durable competitive advantage through superior ROIC despite profitability and leverage concerns. Its strategy must focus on debt management and margin recovery to capitalize on healthcare real estate growth.
Stock Price Action Analysis
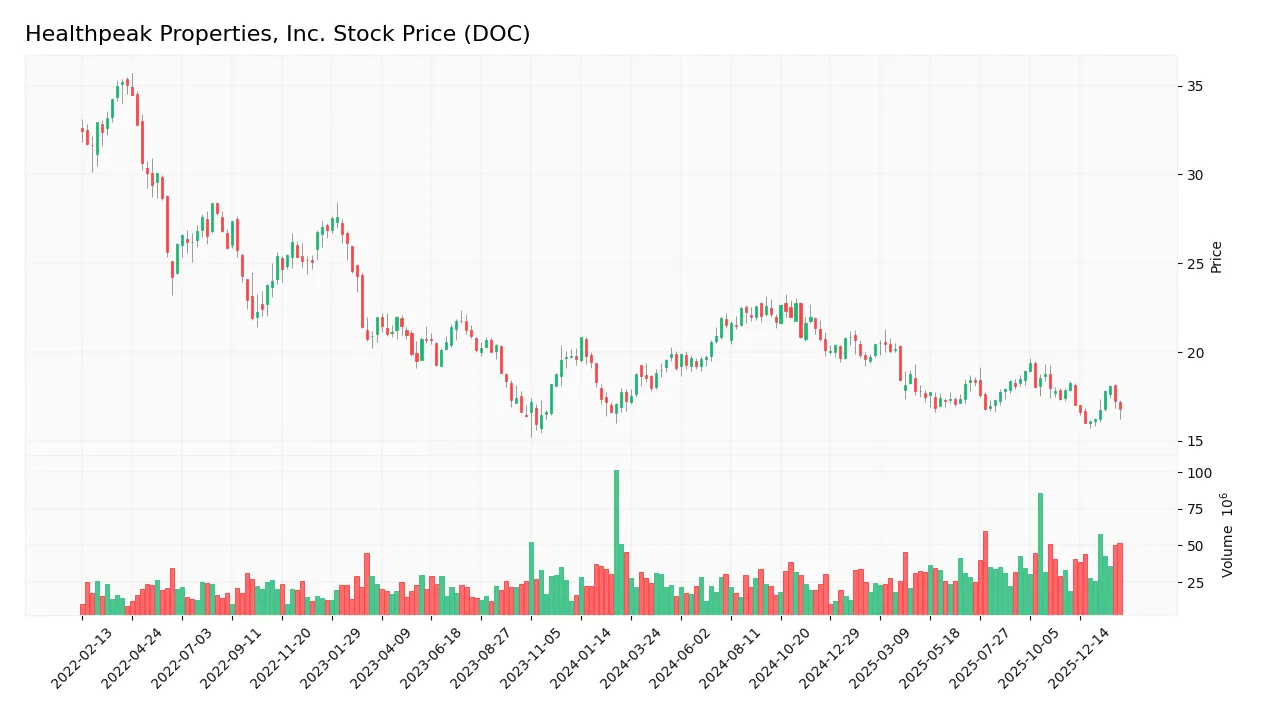
The weekly stock chart for Healthpeak Properties, Inc. (DOC) over the past 12 months shows notable price fluctuations and trend developments:
Trend Analysis
Over the past 12 months, DOC’s stock declined by 2.47%, indicating a bearish trend. The price dropped from a high of 22.76 to a low of 15.99 with accelerating downward momentum. The standard deviation of 1.81 suggests moderate volatility during this period.
Volume Analysis
Trading volume increased, totaling 3.6B shares, with buyers slightly dominating at 51.52%. In the last three months, volume rose with buyer participation steady at 51.82%, indicating neutral buyer behavior and balanced market interest.
Target Prices
Analysts project a target consensus that suggests moderate upside potential for Healthpeak Properties, Inc.
| Target Low | Target High | Consensus |
|---|---|---|
| 17 | 21 | 18.71 |
The target range reflects cautious optimism, with the consensus price pointing to a roughly 10-15% gain from current levels.

Don’t Let Luck Decide Your Entry Point
Optimize your entry points with our advanced ProRealTime indicators. You’ll get efficient buy signals with precise price targets for maximum performance. Start outperforming now!
Analyst & Consumer Opinions
This section examines analyst ratings and consumer feedback to provide a balanced view of Healthpeak Properties, Inc. (DOC).
Stock Grades
Here is the latest grading overview from recognized financial institutions for Healthpeak Properties, Inc.:
| Grading Company | Action | New Grade | Date |
|---|---|---|---|
| Evercore ISI Group | maintain | Outperform | 2026-02-04 |
| Wells Fargo | maintain | Equal Weight | 2026-02-02 |
| Jefferies | downgrade | Hold | 2025-12-16 |
| Evercore ISI Group | maintain | Outperform | 2025-12-15 |
| Wells Fargo | maintain | Equal Weight | 2025-11-25 |
| Baird | maintain | Outperform | 2025-11-12 |
| Raymond James | upgrade | Outperform | 2025-09-15 |
| Wells Fargo | maintain | Equal Weight | 2025-08-27 |
| Morgan Stanley | maintain | Overweight | 2025-08-22 |
| Deutsche Bank | downgrade | Hold | 2025-08-20 |
The grades show a balanced view with multiple firms maintaining Outperform or Equal Weight ratings. Downgrades from Buy to Hold by some firms indicate cautious sentiment, but the overall consensus remains positive with a Buy rating.
Consumer Opinions
Healthpeak Properties, Inc. (DOC) draws mixed reactions from its consumer base, reflecting both satisfaction and areas for improvement.
| Positive Reviews | Negative Reviews |
|---|---|
| “Properties are well-maintained and modern.” | “Customer service response times can be slow.” |
| “Consistent quality in healthcare real estate.” | “Some locations need upgrades and better amenities.” |
| “Transparent leasing terms and reliable management.” | “Rent increases feel steep in certain markets.” |
Overall, consumers praise Healthpeak’s property upkeep and transparency. However, slow service and rising rents remain recurring concerns that could impact tenant retention.
Risk Analysis
Below is a summary table highlighting key risks facing Healthpeak Properties, Inc. as of 2026:
| Category | Description | Probability | Impact |
|---|---|---|---|
| Financial Health | Altman Z-Score in distress zone indicates bankruptcy risk | High | High |
| Leverage | Debt-to-equity ratio at 1.39 signals heavy indebtedness | High | High |
| Profitability | Low net margin (2.53%) and ROE (0.95%) reflect weak profits | High | Medium |
| Interest Coverage | Interest coverage ratio of 1.78 raises refinancing risks | Medium | Medium |
| Valuation | Elevated P/E ratio (156.87) suggests overvaluation risk | Medium | Medium |
| Liquidity | Current ratio near 1.09 implies limited short-term buffer | Medium | Low |
The most pressing risks combine high leverage and financial distress signals, with the Altman Z-Score firmly in the distress zone. This underscores vulnerability to economic downturns or rising interest rates. Profitability remains weak despite a favorable ROIC vs. WACC spread, limiting strategic flexibility. Investors must weigh these risks carefully against Healthpeak’s stable dividend yield and real estate asset base.
Should You Buy Healthpeak Properties, Inc.?
Healthpeak Properties, Inc. appears to be creating strong value with a durable competitive moat supported by a growing ROIC trend. While profitability and operational efficiency show moderate improvement, the leverage profile remains substantial, resulting in a cautious C+ rating.
Strength & Efficiency Pillars
Healthpeak Properties, Inc. stands out as a value creator with a robust ROIC of 21.39% surpassing its WACC of 6.4%. This signals efficient capital allocation and strong value generation. The company’s fixed asset turnover of 6.85 reflects operational efficiency, and a Piotroski score of 6 suggests decent financial health. Despite a concerning Altman Z-score of 0.40 placing it in the distress zone, the firm maintains a favorable quick ratio of 1.09, supporting short-term liquidity.
Weaknesses and Drawbacks
However, several red flags temper enthusiasm. A sky-high P/E ratio of 156.87 indicates an excessively premium valuation, raising concerns about price sustainability. The debt-to-equity ratio of 1.39 and a debt-to-assets ratio above 51% reveal significant leverage risks. Interest coverage at 1.78 is thin, exposing the company to potential difficulties servicing debt if earnings falter. Moreover, net margin at 2.53% and ROE below 1% highlight weak profitability, undermining growth prospects.
Our Verdict about Healthpeak Properties, Inc.
The fundamental profile is mixed, with clear value-creation capabilities but serious leverage and profitability concerns. The stock exhibits a bearish overall trend with accelerating downside, while recent buyer dominance remains neutral. Despite the company’s long-term competitive advantages, recent market pressure suggests a cautious, wait-and-see approach may better suit investors seeking optimal entry points.
Disclaimer: This content is for informational purposes only and does not constitute financial, investment, or other professional advice. Investing in financial markets involves a significant risk of loss, and past performance is not indicative of future results.
Additional Resources
- Cullen Capital Management LLC Buys 641,771 Shares of Healthpeak Properties, Inc. $DOC – MarketBeat (Feb 05, 2026)
- Healthpeak Properties (DOC) Downgraded by Argus Research to Hold | DOC Stock News – GuruFocus (Feb 05, 2026)
- Healthpeak Properties (DOC) Is Down 7.1% After Earnings Beat And Janus Living IPO Plan Announcement – Has The Bull Case Changed? – Yahoo Finance (Feb 04, 2026)
- Healthpeak Properties Inc (NYSE:DOC) Reports Strong Q4 2025 Earnings Beat and Unveils Major Portfolio Reshaping Strategy – Chartmill (Feb 02, 2026)
- Palmetto Grain Brokerage – – Palmetto Grain Brokerage (Feb 03, 2026)
For more information about Healthpeak Properties, Inc., please visit the official website: healthpeak.com