Home > Analyses > Healthcare > HCA Healthcare, Inc.
HCA Healthcare, Inc. transforms patient care across 20 states and England, touching millions of lives daily. It commands a robust presence in the medical care facilities sector, operating 182 hospitals and numerous outpatient centers. Known for integrating acute care with specialized services, HCA leads through innovation and scale. As healthcare demands evolve, I question whether HCA’s current fundamentals can sustain its premium valuation and fuel future growth.

Table of contents
Business Model & Company Overview
HCA Healthcare, Inc., founded in 1968 and headquartered in Nashville, Tennessee, dominates the medical care facilities sector with a vast network of 182 hospitals and numerous outpatient centers. Its integrated ecosystem spans general and acute care, psychiatric services, and specialized outpatient therapies, forming a cohesive platform dedicated to comprehensive health care delivery across 20 states and England. This scale enables HCA to serve diverse patient needs under one umbrella, reinforcing its position as a leading health care provider.
The company’s revenue engine balances inpatient hospital services with a robust portfolio of outpatient care centers, ambulatory surgery, and diagnostic services, creating multiple recurring revenue streams. Its strategic footprint across the Americas and Europe leverages regional demand for both acute and outpatient care. HCA’s ability to blend scale with service diversity underpins a durable economic moat, positioning it as a pivotal force shaping the future of health care infrastructure.
Financial Performance & Fundamental Metrics
I analyze HCA Healthcare, Inc.’s income statement, key financial ratios, and dividend payout policy to assess its operational strength and shareholder returns.
Income Statement
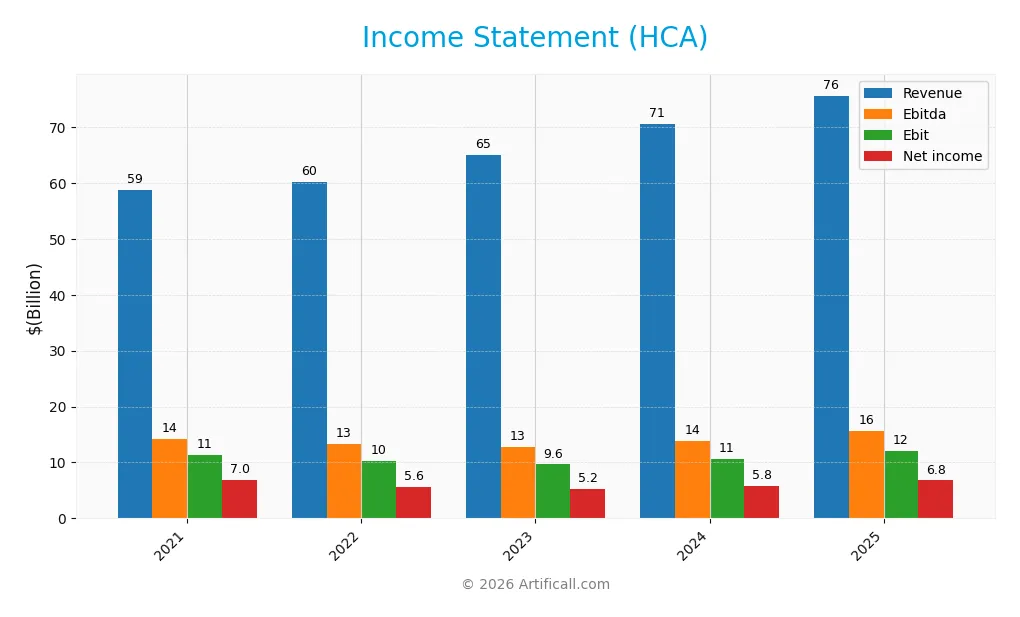
The following table presents HCA Healthcare, Inc.’s key income statement figures for the fiscal years 2021 through 2025, reflecting revenue growth and profitability trends.
| 2021 | 2022 | 2023 | 2024 | 2025 | |
|---|---|---|---|---|---|
| Revenue | 58.8B | 60.2B | 64.97B | 70.6B | 75.6B |
| Cost of Revenue | 36.3B | 37.1B | 39.4B | 41.9B | 44.2B |
| Operating Expenses | 12.8B | 14.1B | 15.95B | 18.1B | 19.4B |
| Gross Profit | 22.5B | 23.2B | 25.6B | 28.7B | 31.4B |
| EBITDA | 14.3B | 13.3B | 12.7B | 13.9B | 15.6B |
| EBIT | 11.4B | 10.3B | 9.6B | 10.6B | 12.1B |
| Interest Expense | 1.53B | 1.74B | 1.94B | 2.06B | 2.25B |
| Net Income | 6.96B | 5.64B | 5.24B | 5.76B | 6.78B |
| EPS | 21.51 | 19.44 | 19.24 | 22.27 | 28.62 |
| Filing Date | 2022-02-18 | 2023-02-17 | 2024-02-16 | 2025-02-14 | 2026-02-10 |
Income Statement Evolution
HCA Healthcare’s revenue rose steadily from $58.8B in 2021 to $75.6B in 2025, a 28.7% increase. Gross profit expanded proportionally, with gross margins holding around 41.5%. Net income showed mixed results, declining 2.5% overall despite a 10% margin improvement in the most recent year, reflecting margin volatility over the period.
Is the Income Statement Favorable?
The 2025 income statement reveals solid fundamentals with a 7.1% revenue increase and a strong 14.1% EBIT growth. Margins improved notably: gross margin at 41.5%, EBIT margin at 16%, and net margin near 9%. Interest expense remains well controlled at under 3%. Overall, the income statement metrics and growth indicators are favorable, underscoring operational efficiency and profitability gains.
Financial Ratios
The following table presents key financial ratios for HCA Healthcare, Inc. over recent fiscal years, offering a snapshot of profitability, liquidity, leverage, and valuation metrics:
| Ratios | 2021 | 2022 | 2023 | 2024 | 2025 |
|---|---|---|---|---|---|
| Net Margin | 11.8% | 9.37% | 8.07% | 8.16% | 8.97% |
| ROE | -7.46 | -2.04 | -2.95 | -2.30 | -1.13 |
| ROIC | 18.2% | 16.7% | 16.4% | 16.7% | 18.5% |
| P/E | 11.9 | 12.3 | 14.1 | 13.5 | 15.9 |
| P/B | -89.0 | -25.2 | -41.6 | -31.1 | -17.9 |
| Current Ratio | 1.41 | 1.38 | 1.18 | 1.08 | 0.83 |
| Quick Ratio | 1.21 | 1.17 | 1.02 | 0.97 | 0.73 |
| D/E | -39.4 | -14.5 | -23.6 | -18.1 | -8.33 |
| Debt-to-Assets | 72.4% | 76.7% | 74.5% | 76.0% | 82.7% |
| Interest Coverage | 6.33 | 5.21 | 4.97 | 5.12 | 5.32 |
| Asset Turnover | 1.16 | 1.15 | 1.16 | 1.19 | 1.25 |
| Fixed Asset Turnover | 2.24 | 2.18 | 2.17 | 2.24 | 2.43 |
| Dividend Yield | 0.75% | 0.94% | 0.90% | 0.89% | 0.63% |
Evolution of Financial Ratios
From 2021 to 2025, HCA Healthcare’s ROE declined sharply, turning negative in recent years, signaling challenges in equity profitability. The current ratio steadily decreased, falling below 1 in 2025, indicating weakening liquidity. Debt-to-equity ratio remained negative but improved slightly, reflecting complex capital structure dynamics. Profitability margins showed modest improvement, though net margin stayed neutral.
Are the Financial Ratios Fovorable?
In 2025, profitability appears mixed: ROIC at 18.5% is favorable, but ROE at -112.6% is unfavorable. Liquidity ratios, including current (0.83) and quick (0.73), remain below 1, raising caution. Leverage measures show high debt-to-assets at 82.7% (unfavorable), yet debt-to-equity ratio is favorable at -8.33. Market multiples, such as P/E of 15.9, are neutral, with dividend yield low at 0.63%. Overall, ratios suggest a neutral financial position.
Shareholder Return Policy
HCA Healthcare, Inc. maintains a consistent dividend policy with a payout ratio near 10-13% and a dividend yield around 0.6-0.9%. Dividend payments are covered by free cash flow, supported by a dividend paid and capex coverage ratio above 1.7, indicating prudent capital allocation.
The company also engages in share buybacks alongside dividends. While the payout remains modest relative to earnings, this balanced approach appears sustainable and aligned with long-term shareholder value creation. However, the relatively low current ratio and high leverage warrant monitoring for potential liquidity risks.
Score analysis
The following radar chart illustrates key financial scores for HCA Healthcare, Inc., highlighting its valuation and performance metrics:
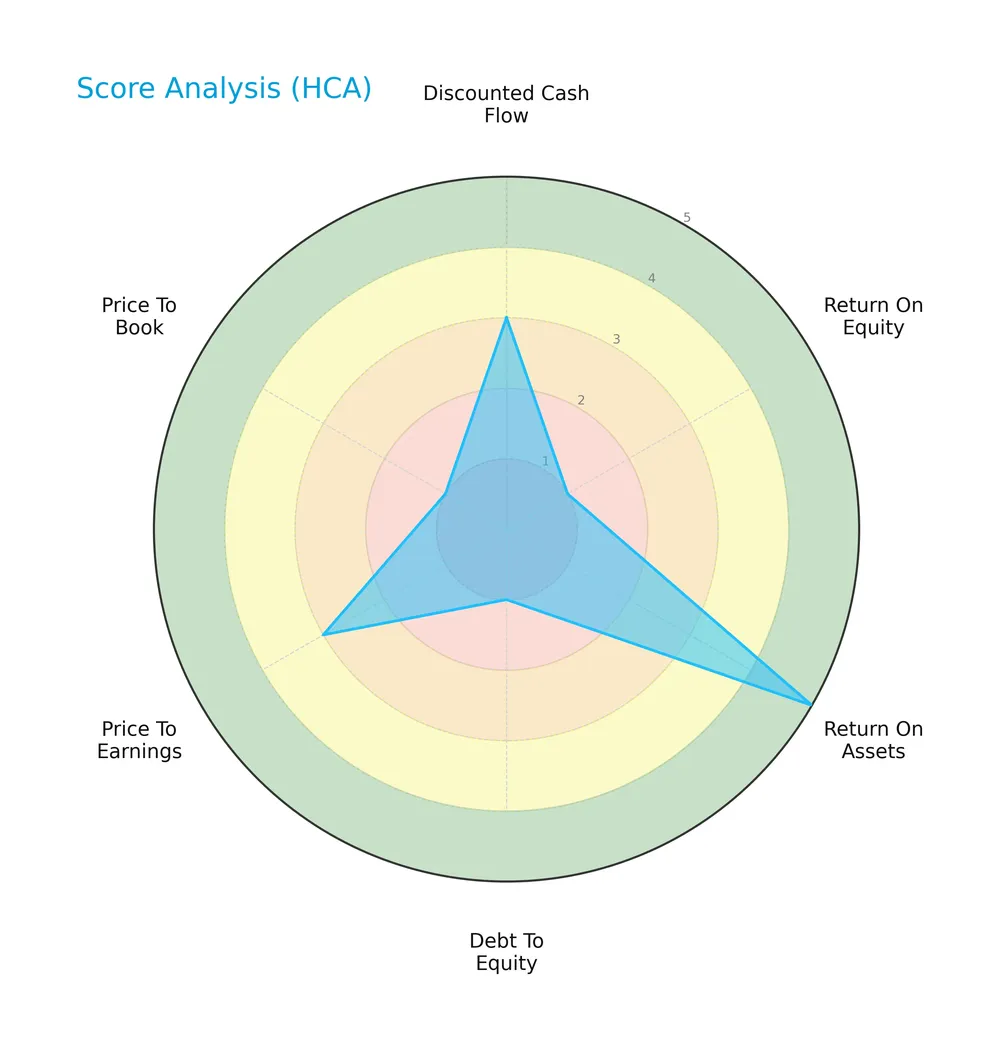
HCA shows mixed scores with a moderate discounted cash flow and price-to-earnings valuation. However, return on equity, debt-to-equity, and price-to-book scores are very unfavorable. Return on assets stands out as very favorable.
Analysis of the company’s bankruptcy risk
HCA’s Altman Z-Score places it in the grey zone, indicating a moderate risk of bankruptcy and financial uncertainty:

Is the company in good financial health?
The Piotroski Score diagram below assesses HCA’s overall financial strength and operational efficiency:

With a Piotroski Score of 7, HCA demonstrates strong financial health, reflecting sound profitability, liquidity, and leverage management. This suggests resilience despite some valuation concerns.
Competitive Landscape & Sector Positioning
This section examines HCA Healthcare, Inc.’s strategic positioning within the medical care facilities sector. It reviews revenue distribution by segment, key products, and main competitors. I will assess whether HCA holds a competitive advantage compared to its peers.
Strategic Positioning
HCA Healthcare concentrates primarily on the U.S. market, operating 182 hospitals across 20 states and England. Its revenue stems mainly from managed care insurers and government programs, with a small but growing international segment of $1.68B in 2024, reflecting moderate geographic diversification.
Revenue by Segment
This pie chart illustrates HCA Healthcare’s revenue distribution across key segments for the fiscal year 2024, highlighting the company’s diverse payer mix and international exposure.
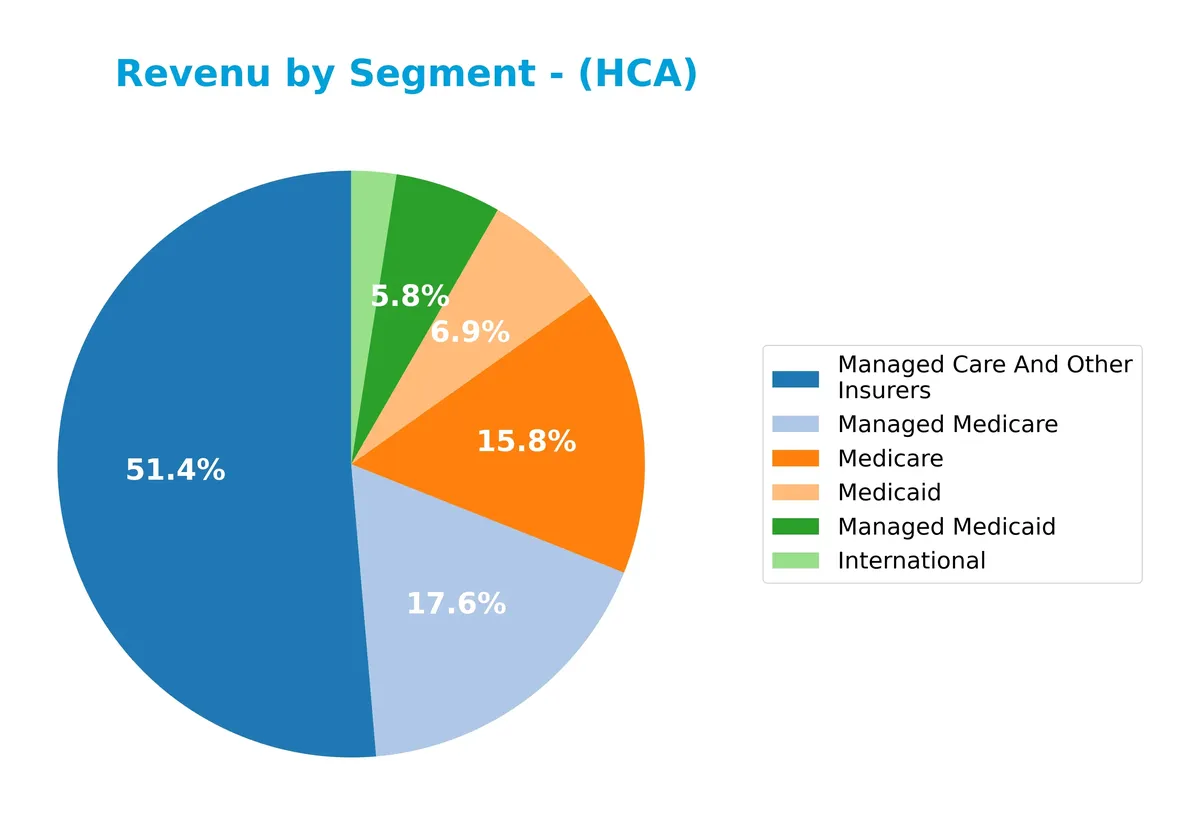
In 2024, Managed Care and Other Insurers dominate with $34.95B, driving the business with steady growth over recent years. Medicare and Managed Medicare also contribute significantly, totaling about $22.8B combined. Managed Medicaid and Medicaid show moderate increases, indicating expanding government payer reliance. International revenue, while the smallest at $1.68B, steadily grows, diversifying geographic risk. The 2024 figures reflect an accelerating concentration in managed insurance segments, underscoring HCA’s strategic focus on these higher-margin payers.
Key Products & Brands
HCA Healthcare, Inc. generates revenue from diverse healthcare services and insurance categories, detailed below:
| Product | Description |
|---|---|
| General and Acute Care Hospitals | Provide inpatient care, intensive care, cardiac care, diagnostic, and emergency services. |
| Outpatient Services | Include outpatient surgery, laboratory, radiology, respiratory therapy, cardiology, physical therapy. |
| Outpatient Health Care Facilities | Comprise ambulatory surgery centers, emergency care, urgent care, walk-in clinics, diagnostic and imaging centers. |
| Psychiatric Hospitals | Deliver therapeutic programs for child, adolescent, and adult psychiatric care, substance abuse treatment, and counseling. |
| Managed Care and Other Insurers | Revenue from agreements with managed care organizations and other insurers. |
| Managed Medicare | Revenue from Medicare Advantage and other managed Medicare plans. |
| Managed Medicaid | Revenue from Medicaid managed care plans. |
| Medicare | Traditional Medicare fee-for-service revenue. |
| Medicaid | Traditional Medicaid fee-for-service revenue. |
| International | Revenue from healthcare services outside the United States, including operations in England. |
HCA Healthcare’s portfolio spans comprehensive inpatient and outpatient care, psychiatric services, and insurance reimbursements. Managed care and insurer contracts dominate revenue, reflecting the sector’s reliance on payer relationships.
Main Competitors
There are 4 competitors total; the table below lists the top 4 leaders by market capitalization:
| Competitor | Market Cap. |
|---|---|
| HCA Healthcare, Inc. | 114B |
| Solventum Corporation | 13.7B |
| Universal Health Services, Inc. | 14.2B |
| DaVita Inc. | 8.1B |
HCA Healthcare, Inc. ranks first among its four competitors with a market cap slightly above the leader benchmark at 1.0031x. It stands well above both the average top 10 market cap of 37.5B and the sector median of 13.9B. The company holds a wide gap from its closest rival, with a distance to the next competitor below of -707.89%, emphasizing its dominant scale in the sector.
Comparisons with competitors
Check out how we compare the company to its competitors:
Does HCA have a competitive advantage?
HCA Healthcare, Inc. presents a competitive advantage, evidenced by a favorable ROIC exceeding WACC by 10.5%, signaling strong value creation and efficient capital use. The company sustains stable profitability with a neutral ROIC trend over 2021-2025, confirming consistent operational strength.
Looking ahead, HCA’s broad portfolio spans 182 hospitals and multiple outpatient facilities across 20 states and England. Expansion opportunities exist in ambulatory and specialized care centers, potentially driving growth as healthcare demands evolve in diverse US and UK markets.
SWOT Analysis
This analysis highlights HCA Healthcare’s internal strengths and weaknesses alongside external opportunities and threats shaping its strategic outlook.
Strengths
- strong gross margin at 41.5%
- favorable EBIT margin near 16%
- robust ROIC at 18.5% exceeding WACC
Weaknesses
- weak current and quick ratios below 1
- high debt-to-assets ratio at 82.7%
- negative ROE signals equity inefficiency
Opportunities
- expansion in outpatient and ambulatory care
- increasing demand for psychiatric and rehab services
- potential growth in new geographic markets
Threats
- regulatory risks in healthcare policies
- intense competition in care facilities
- economic downturns affecting patient volumes
HCA benefits from solid profitability and value creation but faces liquidity and leverage concerns. Strategic focus should leverage outpatient growth while managing debt and regulatory threats.
Stock Price Action Analysis
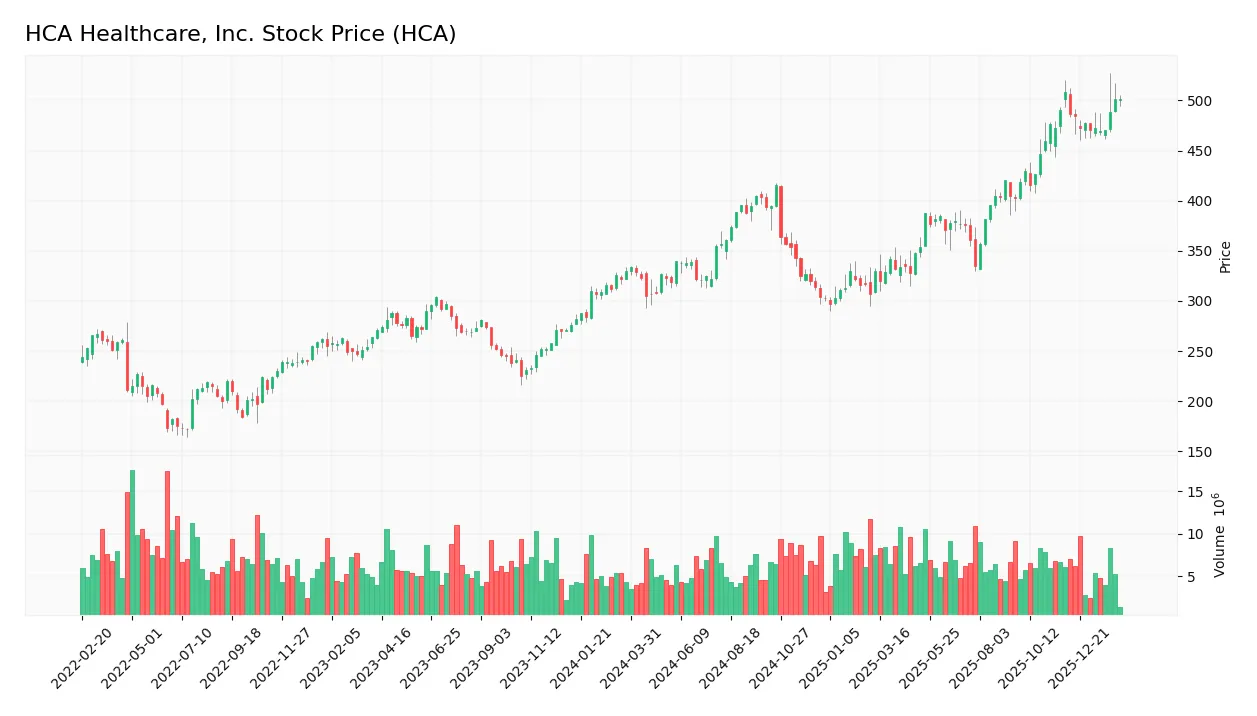
The weekly stock chart displays HCA Healthcare, Inc.’s price movements over the past 12 months, highlighting key trend shifts and volatility:
Trend Analysis
Over the past 12 months, HCA’s stock price rose 52.12%, indicating a bullish trend despite deceleration. The highest price reached 508.29, with a low of 296.7. Volatility is high, evidenced by a 58.09 standard deviation, reflecting substantial price fluctuations.
Volume Analysis
Trading volume is increasing, with buyers accounting for 56.71% of total volume, signaling buyer-driven activity overall. In the recent three months, buyer dominance eased to 52.4%, showing neutral buyer behavior and balanced market participation.
Target Prices
Analysts project a robust target consensus for HCA Healthcare, Inc., reflecting confidence in its growth prospects.
| Target Low | Target High | Consensus |
|---|---|---|
| 425 | 598 | 521.08 |
The target prices indicate a bullish outlook, with a consensus suggesting a potential upside of roughly 10-15% from current levels.

Don’t Let Luck Decide Your Entry Point
Optimize your entry points with our advanced ProRealTime indicators. You’ll get efficient buy signals with precise price targets for maximum performance. Start outperforming now!
Analyst & Consumer Opinions
This section examines recent analyst grades and consumer feedback regarding HCA Healthcare, Inc.’s market performance and reputation.
Stock Grades
Here are the latest verified stock grades from established financial institutions for HCA Healthcare, Inc.:
| Grading Company | Action | New Grade | Date |
|---|---|---|---|
| Argus Research | Maintain | Buy | 2026-02-06 |
| Wells Fargo | Maintain | Equal Weight | 2026-01-30 |
| UBS | Maintain | Buy | 2026-01-28 |
| Jefferies | Maintain | Buy | 2026-01-28 |
| Keybanc | Maintain | Overweight | 2026-01-28 |
| Deutsche Bank | Maintain | Buy | 2026-01-28 |
| Oppenheimer | Maintain | Outperform | 2026-01-28 |
| Barclays | Maintain | Overweight | 2026-01-28 |
| Cantor Fitzgerald | Maintain | Overweight | 2026-01-28 |
| Truist Securities | Maintain | Buy | 2026-01-28 |
The consensus reflects a strong buy sentiment with most firms maintaining positive ratings. A minority hold equal weight positions, signaling moderate optimism but no downgrade momentum.
Consumer Opinions
Consumers express a mix of appreciation and concern about HCA Healthcare, Inc.’s services.
| Positive Reviews | Negative Reviews |
|---|---|
| Efficient patient care and short wait times | High costs and unclear billing practices |
| Friendly and professional medical staff | Limited appointment availability |
| Modern facilities and advanced technology | Inconsistent communication from staff |
Overall, patients praise HCA for its professionalism and cutting-edge facilities. However, they frequently cite cost transparency and scheduling as areas needing improvement.
Risk Analysis
Below is a table summarizing key risks facing HCA Healthcare, Inc. based on recent financial and operational data:
| Category | Description | Probability | Impact |
|---|---|---|---|
| Financial Leverage | High debt-to-assets ratio of 82.7% increases financial risk. | High | High |
| Liquidity | Current ratio of 0.83 indicates tight short-term liquidity. | Medium | Medium |
| Profitability | Negative return on equity (-112.6%) signals shareholder losses. | Medium | High |
| Market Volatility | Beta at 1.37 shows sensitivity to broader market swings. | High | Medium |
| Dividend Yield | Low yield (0.63%) may reduce income appeal for investors. | Low | Low |
| Bankruptcy Risk | Altman Z-score of 2.92 places company in grey zone risk. | Medium | High |
The most pressing risks stem from HCA’s elevated leverage and weak return on equity. Despite a strong ROIC of 18.5%, the high debt load (82.7% debt to assets) and subpar liquidity ratios expose the company to financial strain in downturns. The Altman Z-score in the grey zone underscores moderate bankruptcy risk, warranting cautious monitoring. Market volatility remains a factor given its beta above 1.3. Investors must weigh these risks against HCA’s operational scale and healthcare sector resilience.
Should You Buy HCA Healthcare, Inc.?
HCA Healthcare, Inc. appears to be a profitable company with stable value creation, supported by a durable competitive moat and a manageable but notable leverage profile. While its overall rating is a cautious B-, the firm’s financial health suggests a profile of operational efficiency tempered by some leverage risks.
Strength & Efficiency Pillars
HCA Healthcare, Inc. shows solid operational efficiency with a gross margin of 41.5% and an EBIT margin of 15.98%. The company generates a respectable net margin of 8.97%, reflecting effective cost control. The return on invested capital (ROIC) stands at 18.53%, significantly above the weighted average cost of capital (WACC) of 8%, confirming HCA as a clear value creator. Despite an unfavorable return on equity (-112.56%), these margins and capital returns indicate stable profitability and competitive advantages in healthcare services.
Weaknesses and Drawbacks
HCA operates in the Altman Z-Score grey zone at 2.92, signaling moderate bankruptcy risk that investors must weigh carefully. The company’s current ratio is weak at 0.83, indicating liquidity constraints that could hamper short-term obligations. Additionally, a high debt-to-assets ratio of 82.67% flags elevated leverage risk, while a negative price-to-book ratio (-17.87) signals potential accounting irregularities or market skepticism. These financial vulnerabilities temper the otherwise favorable operational profile and introduce notable downside risks.
Our Final Verdict about HCA Healthcare, Inc.
HCA Healthcare presents a fundamentally sound operational profile with robust value creation. However, the grey zone Altman Z-Score warns of moderate solvency risks, requiring cautious capital deployment. The bullish long-term stock trend paired with neutral recent buyer dominance suggests the profile might appear attractive but warrants a watchful, measured approach. Investors could consider waiting for clearer signs of financial stability before committing significant capital.
Disclaimer: This content is for informational purposes only and does not constitute financial, investment, or other professional advice. Investing in financial markets involves a significant risk of loss, and past performance is not indicative of future results.
Additional Resources
- HCA Healthcare, Inc. SEC 10-K Report – TradingView (Feb 10, 2026)
- Diamond Hill Capital’s Strategic Moves: HCA Healthcare Inc. Reduced by 1.25% – Yahoo Finance (Feb 06, 2026)
- Candriam S.C.A. Lowers Stock Holdings in HCA Healthcare, Inc. $HCA – MarketBeat (Feb 09, 2026)
- Will Lower Patient Days Affect Tenet Healthcare’s Q4 Earnings? – Finviz (Feb 10, 2026)
- HCA Healthcare stock price target raised to $541 from $503 at Bernstein – Investing.com (Feb 09, 2026)
For more information about HCA Healthcare, Inc., please visit the official website: hcahealthcare.com