Home > Analyses > Consumer Cyclical > Hasbro, Inc.
Hasbro, Inc. sparks imagination worldwide, shaping childhoods and entertainment with iconic toys and games. Its flagship brands, from action figures to trading cards, define the leisure landscape through innovation and quality. Hasbro’s strategic expansion into digital gaming and entertainment content deepens its market influence. As the company navigates evolving consumer trends, I ask: does Hasbro’s current financial strength and growth trajectory justify its premium valuation in 2026?
Table of contents
Business Model & Company Overview
Hasbro, Inc., founded in 1923 and headquartered in Pawtucket, Rhode Island, dominates the leisure industry with a diverse ecosystem of toys, games, and entertainment content. The company integrates iconic brands through consumer products, digital gaming via Wizards of the Coast, and global entertainment ventures. This cohesive mission connects physical play with immersive digital and media experiences, reinforcing its leadership in a highly competitive market.
Hasbro’s revenue engine balances robust sales from toys and licensed products with growth in digital game development and entertainment content distribution. Its footprint spans the Americas, Europe, and Asia, leveraging retail and e-commerce channels to maximize reach. This multi-segment approach builds strong brand loyalty and recurring revenue streams, creating a resilient economic moat that shapes the future of play and entertainment worldwide.
Financial Performance & Fundamental Metrics
I will analyze Hasbro, Inc.’s income statement, key financial ratios, and dividend payout policy to assess its overall financial health and shareholder value creation.
Income Statement
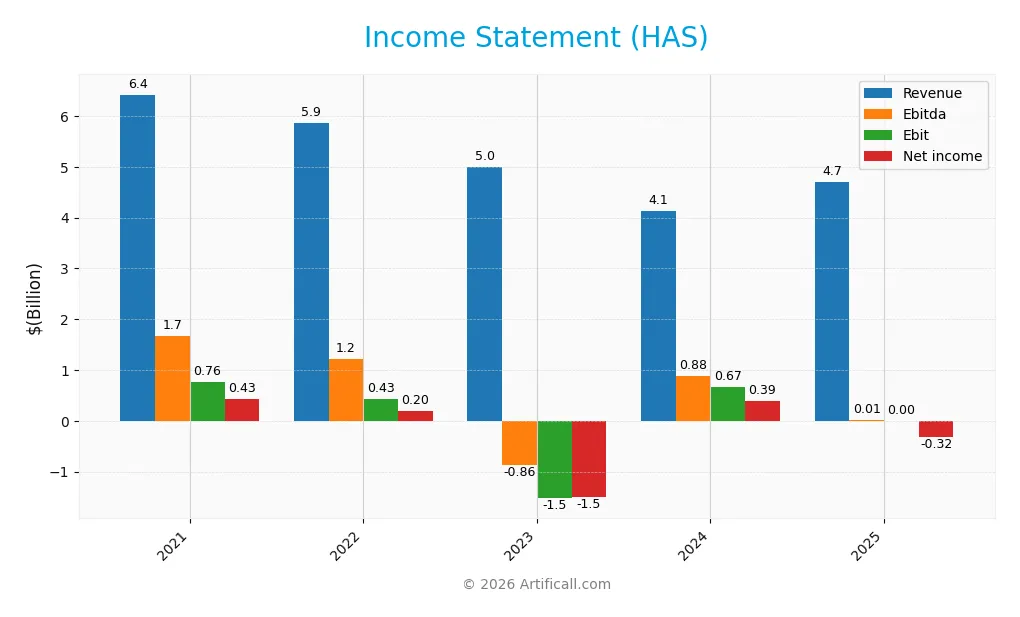
The table below summarizes Hasbro, Inc.’s key income statement figures from 2021 to 2025, offering a clear view of its revenue, expenses, and profitability trends over these years.
| 2021 | 2022 | 2023 | 2024 | 2025 | |
|---|---|---|---|---|---|
| Revenue | 6.42B | 5.86B | 5.00B | 4.14B | 4.70B |
| Cost of Revenue | 2.55B | 2.40B | 2.13B | 1.46B | 1.40B |
| Operating Expenses | 3.11B | 3.04B | 4.41B | 1.98B | 2.25B |
| Gross Profit | 3.87B | 3.45B | 2.87B | 2.67B | 3.30B |
| EBITDA | 1.67B | 1.22B | -863M | 880M | 233M |
| EBIT | 762M | 433M | -1.52B | 668M | 61M |
| Interest Expense | 180M | 171M | 186M | 171M | 163M |
| Net Income | 429M | 204M | -1.49B | 386M | -322M |
| EPS | 3.11 | 1.47 | -10.73 | 2.77 | -2.30 |
| Filing Date | 2022-02-23 | 2023-02-22 | 2024-02-13 | 2025-02-27 | 2026-02-25 |
Income Statement Evolution
Hasbro’s revenue declined by 27% from 2021 to 2025, though it rebounded 14% in 2025 alone. Gross margins remained robust, above 70%, signaling efficient cost control. However, EBIT plunged 91% in the last year, reflecting deteriorating operating profitability. Net income swung from positive to a significant loss, compressing net margins sharply.
Is the Income Statement Favorable?
In 2025, Hasbro reported $4.7B revenue with a strong 70.3% gross margin, indicating solid product profitability. Yet, operating income fell dramatically to $61M, dragging net income to a negative $322M. Interest expense remains manageable at 3.5% of revenue. Overall, the fundamentals are unfavorable due to deteriorating bottom-line performance and margin compression.
Financial Ratios
The following table summarizes key financial ratios for Hasbro, Inc. over recent fiscal years, providing a clear snapshot of profitability, liquidity, leverage, and market valuation:
| Ratios | 2021 | 2022 | 2023 | 2024 | 2025 |
|---|---|---|---|---|---|
| Net Margin | 6.7% | 3.5% | -29.8% | 9.3% | -6.9% |
| ROE | 14.2% | 7.2% | -140.2% | 33.3% | -57.0% |
| ROIC | 7.3% | 4.3% | -26.7% | 11.0% | 25.3% |
| P/E | 32 | 40 | -4.8 | 20.1 | -36.0 |
| P/B | 4.5 | 2.9 | 6.7 | 6.7 | 20.5 |
| Current Ratio | 1.52 | 1.37 | 1.13 | 1.60 | 1.38 |
| Quick Ratio | 1.29 | 1.06 | 0.97 | 1.40 | 1.24 |
| D/E | 1.34 | 1.41 | 3.29 | 2.95 | 5.77 |
| Debt-to-Assets | 40.5% | 43.1% | 53.5% | 53.8% | 58.8% |
| Interest Coverage | 4.2 | 2.4 | -8.3 | 4.0 | 6.5 |
| Asset Turnover | 0.64 | 0.63 | 0.76 | 0.65 | 0.85 |
| Fixed Asset Turnover | 15.2 | 13.9 | 15.0 | 13.7 | 19.0 |
| Dividend Yield | 2.7% | 4.8% | 5.5% | 5.0% | 3.4% |
Evolution of Financial Ratios
Return on Equity (ROE) deteriorated sharply, plunging to -57.01% in 2025, signaling weak profitability. The Current Ratio showed moderate decline from 1.60 in 2024 to 1.38 in 2025, indicating slightly reduced liquidity. Debt-to-Equity Ratio almost doubled, rising to 5.77 in 2025, reflecting increased leverage and financial risk.
Are the Financial Ratios Fovorable?
Profitability ratios reveal challenges with a negative net margin (-6.86%) and ROE, despite a strong Return on Invested Capital (25.32%) above the 5.82% WACC, indicating efficient capital use. Liquidity is neutral to favorable, with a 1.38 Current Ratio and 1.24 Quick Ratio. Leverage ratios, including a high 5.77 Debt-to-Equity and 58.81% Debt-to-Assets, raise concerns. Market valuation shows an unfavorable 20.54 Price-to-Book ratio but favorable dividend yield (3.38%) and fixed asset turnover (18.97). Overall, ratios balance out to a neutral stance.
Shareholder Return Policy
Hasbro, Inc. maintains a dividend with a payout ratio exceeding 100% in 2025, supported by a 3.38% yield and consistent share buybacks. However, the negative net income and free cash flow coverage below 2x raise concerns about distribution sustainability.
The company’s return policy appears strained by profitability challenges and elevated leverage. This approach may pressure long-term shareholder value unless profitability and cash flow improve to sustainably fund dividends and repurchases.
Score analysis
The radar chart below highlights Hasbro, Inc.’s key financial scores across valuation, profitability, and leverage metrics:
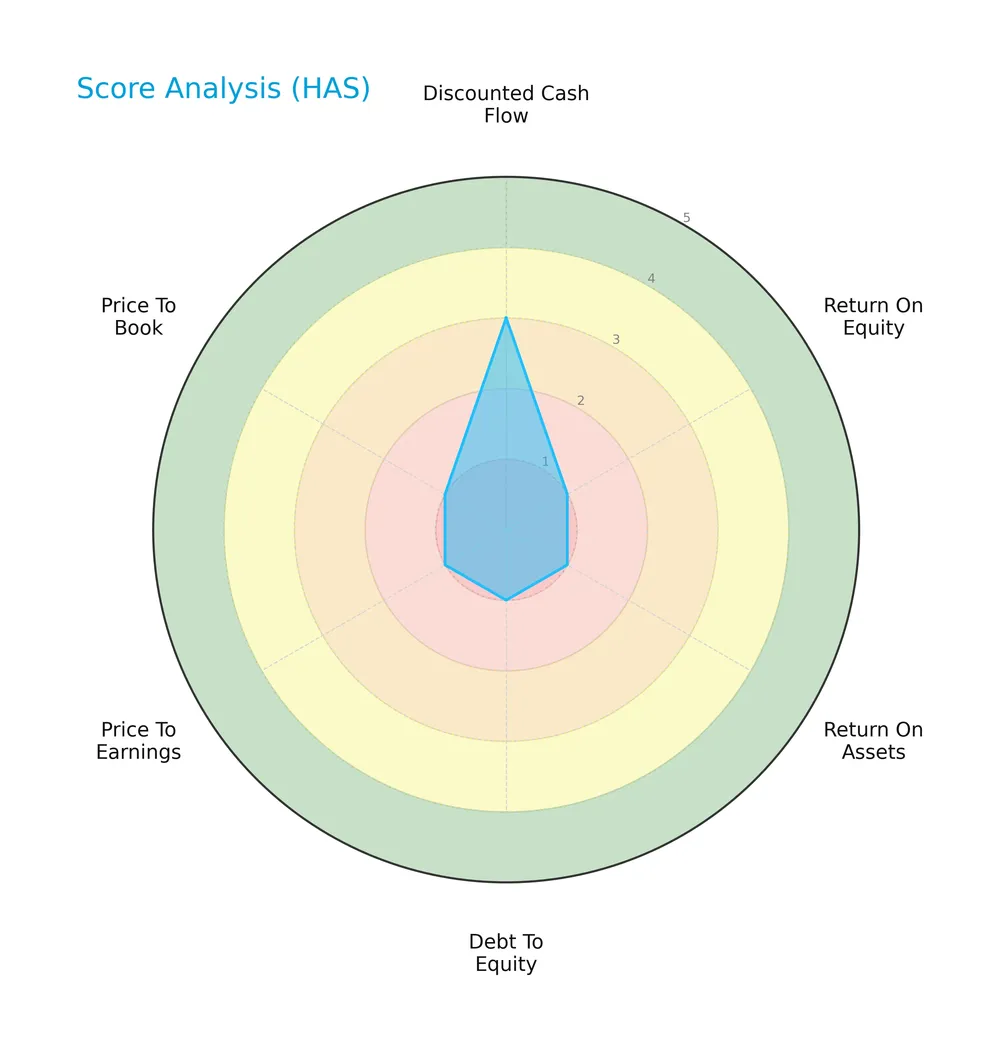
Hasbro scores moderately on discounted cash flow (3), but registers very unfavorable marks on return on equity, return on assets, debt-to-equity, price-to-earnings, and price-to-book ratios—all scoring 1. This signals significant weakness in profitability and valuation metrics.
Analysis of the company’s bankruptcy risk
The Altman Z-Score places Hasbro in the grey zone, indicating a moderate risk of bankruptcy and financial distress:

Is the company in good financial health?
The Piotroski Score diagram below summarizes Hasbro’s financial health assessment:

With a Piotroski Score of 5, Hasbro’s financial condition rates as average. This suggests mixed signals on profitability, leverage, and operating efficiency, reflecting neither strong nor weak financial health.
Competitive Landscape & Sector Positioning
This analysis will explore Hasbro, Inc.’s strategic positioning, revenue segments, key products, and main competitors within the leisure sector. I will assess whether Hasbro holds a competitive advantage over its peers in this dynamic market environment.
Strategic Positioning
Hasbro, Inc. maintains a diversified product portfolio across Consumer Products, Wizards of the Coast and Digital Gaming, and Entertainment. Geographically, it balances revenue between the U.S. and Canada (2.8B in 2025) and International markets (1.9B), reflecting a broad market exposure within the leisure sector.
Revenue by Segment
This pie chart presents Hasbro, Inc.’s revenue distribution by segment over fiscal year 2025. It highlights the relative contribution of consumer products, entertainment, and corporate segments.
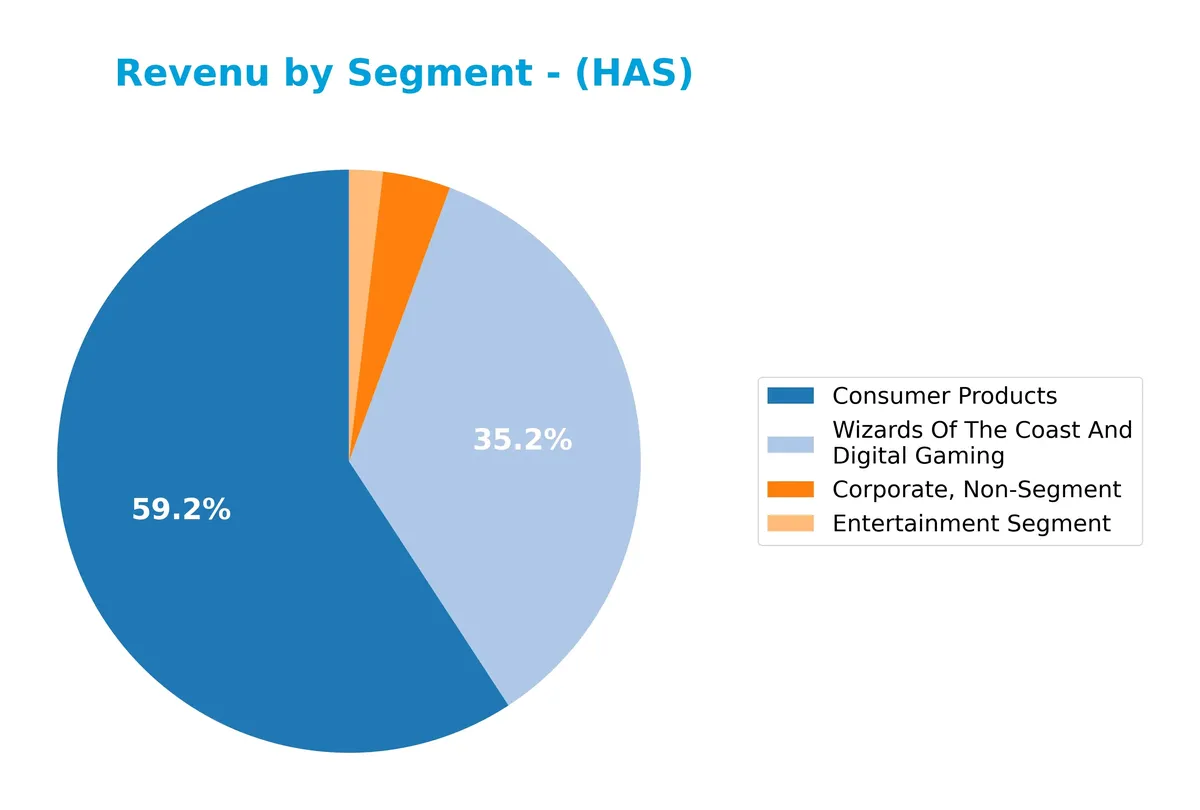
In 2025, Consumer Products dominate Hasbro’s revenue with $2.44B, signaling a contraction from prior years where it exceeded $3B. Entertainment lags significantly at $77M, showing a sharp decline from its peak. The Corporate segment, non-operational in nature, contributes $184M but carries limited business value. The lack of Wizards Of The Coast revenue this year marks a notable shift, signaling concentration risk and a pivot away from digital gaming.
Key Products & Brands
Hasbro’s product portfolio spans toys, games, digital content, and entertainment segments as detailed below:
| Product | Description |
|---|---|
| Consumer Products | Toys and games including action figures, dolls, play sets, preschool toys, plush, sports blasters, vehicles, and licensed apparel. |
| Wizards of the Coast and Digital Gaming | Trading card, role-playing, and digital games promoting Hasbro and Wizards of the Coast brands. |
| Entertainment Segment | Development, production, and distribution of films, TV shows, digital content, and live family entertainment. |
| Corporate, Non-Segment | Corporate operations and activities not allocated to specific product segments. |
Hasbro blends traditional toys with digital gaming and entertainment, maintaining diversified revenue streams across physical and digital play experiences.
Main Competitors
There are 2 main competitors in the sector; the table below lists the top 10 leaders by market capitalization:
| Competitor | Market Cap. |
|---|---|
| Carnival Corporation & plc | 40.6B |
| Hasbro, Inc. | 11.6B |
Hasbro, Inc. ranks 2nd among its competitors, holding 34.5% of the top player’s market cap. It sits below both the average market cap of the top 10 (26.1B) and the sector median. The company faces a significant gap of +189.7% to its nearest competitor above.
Comparisons with competitors
Check out how we compare the company to its competitors:
Does Hasbro have a competitive advantage?
Hasbro demonstrates a clear competitive advantage, evidenced by a very favorable moat rating and a ROIC exceeding its WACC by 19.5%, indicating consistent value creation. The company’s growing ROIC trend of 247% over 2021-2025 signals increasing profitability and efficient capital use.
Looking ahead, Hasbro’s diversified segments—consumer products, digital gaming, and entertainment—position it well for new growth opportunities. Continued brand licensing and expansion into digital and live entertainment markets offer potential avenues to sustain its competitive edge.
SWOT Analysis
This SWOT analysis highlights Hasbro, Inc.’s strategic position by identifying key internal and external factors shaping its future.
Strengths
- strong brand portfolio
- growing ROIC far above WACC
- diverse entertainment and gaming segments
Weaknesses
- negative net margin and ROE
- high debt-to-equity ratio
- weak interest coverage ratio
Opportunities
- expanding international sales
- digital gaming growth potential
- licensing and brand extension
Threats
- competitive pressure in toys and entertainment
- economic cyclicality impact
- rising raw material costs
Hasbro benefits from a durable competitive advantage with rising profitability. However, profitability weaknesses and leverage risks demand cautious capital allocation. Strategic focus on digital innovation and global expansion can offset competitive and economic headwinds.
Stock Price Action Analysis
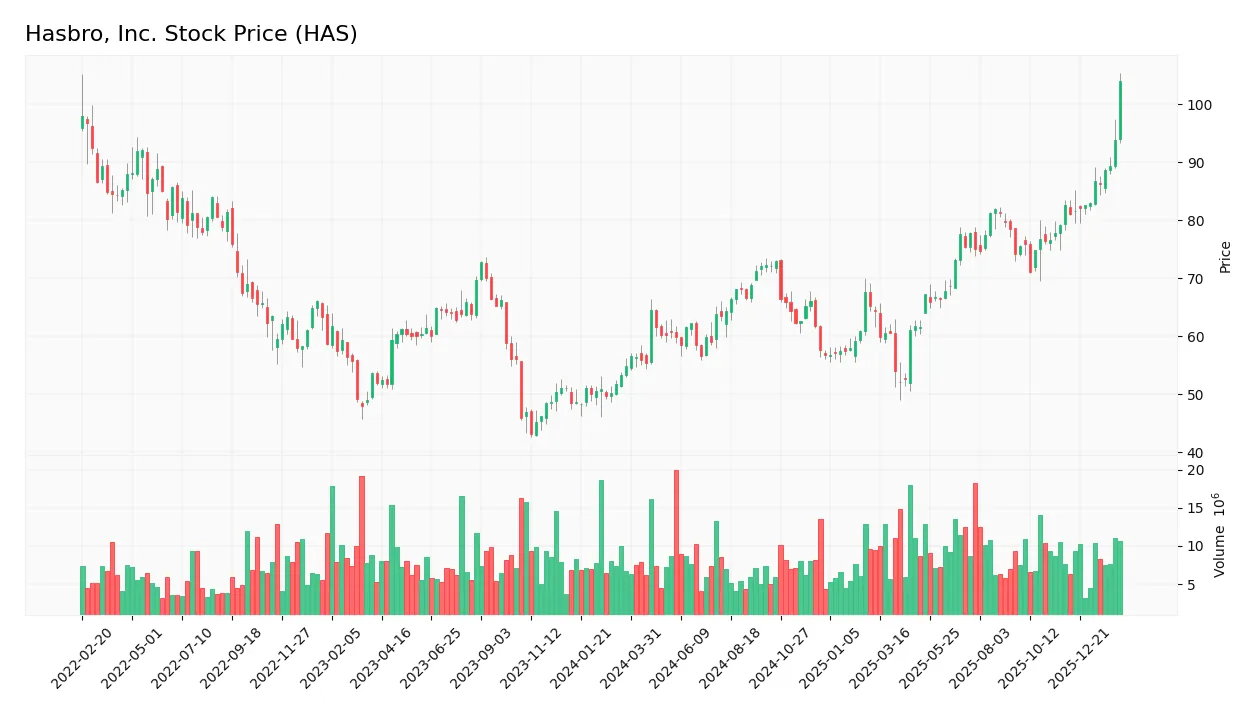
The upcoming weekly chart illustrates Hasbro, Inc.’s significant price movement and volatility over the last 12 months:
Trend Analysis
Over the past year, Hasbro’s stock price surged 76.8%, signaling a clear bullish trend with accelerating momentum. The price oscillated between a low of 52.04 and a high of 102.45, showing strong upward acceleration and notable volatility with a 10.95% standard deviation.
Volume Analysis
Trading volume trends upward, with buyers accounting for 62% overall and 81% in the recent three months. This strongly buyer-dominant activity, coupled with increasing volume, reflects heightened investor interest and positive market participation.
Target Prices
The consensus target price for Hasbro, Inc. reflects moderate upside potential.
| Target Low | Target High | Consensus |
|---|---|---|
| 99 | 120 | 112.4 |
Analysts expect Hasbro to trade between $99 and $120, with a consensus around $112, indicating cautious optimism.

Don’t Let Luck Decide Your Entry Point
Optimize your entry points with our advanced ProRealTime indicators. You’ll get efficient buy signals with precise price targets for maximum performance. Start outperforming now!
Analyst & Consumer Opinions
This section reviews analyst grades and consumer feedback to assess market perception of Hasbro, Inc. (HAS).
Stock Grades
Here is the summary of recent verified stock grades for Hasbro, Inc., reflecting analyst actions and opinions:
| Grading Company | Action | New Grade | Date |
|---|---|---|---|
| Citigroup | Maintain | Buy | 2026-02-12 |
| Goldman Sachs | Maintain | Buy | 2026-02-11 |
| JP Morgan | Maintain | Overweight | 2026-02-11 |
| DA Davidson | Maintain | Neutral | 2026-02-11 |
| Roth Capital | Maintain | Buy | 2026-02-04 |
| Morgan Stanley | Maintain | Overweight | 2026-02-02 |
| UBS | Maintain | Buy | 2026-01-07 |
| UBS | Maintain | Buy | 2025-11-14 |
| Citigroup | Maintain | Buy | 2025-10-24 |
| B of A Securities | Maintain | Buy | 2025-09-29 |
The consensus leans strongly toward a Buy rating, with multiple firms maintaining positive stances. Neutral and Overweight ratings indicate some variation, but no downgrades or sell opinions appear.
Consumer Opinions
Consumers display mixed emotions about Hasbro, Inc., reflecting both enthusiasm for its iconic brands and frustration over product availability.
| Positive Reviews | Negative Reviews |
|---|---|
| “Hasbro’s classic toys bring nostalgia and joy.” | “Frequent stock shortages make it hard to buy.” |
| “Innovative game designs keep family game nights fresh.” | “Some items feel overpriced for the quality.” |
| “Strong brand recognition ensures trusted gifts.” | “Customer service response times can lag.” |
Overall, consumers praise Hasbro’s brand legacy and innovation. However, supply chain issues and pricing concerns repeatedly emerge as weaknesses, signaling areas for strategic improvement.
Risk Analysis
Below is a summary table highlighting key risks facing Hasbro, Inc., including their likelihood and potential impact:
| Category | Description | Probability | Impact |
|---|---|---|---|
| Profitability | Negative net margin (-6.86%) signals ongoing operating losses despite solid ROIC (25.32%). | High | High |
| Leverage | High debt-to-assets ratio (58.8%) and weak interest coverage (0.38) raise solvency concerns. | High | High |
| Valuation | Elevated price-to-book (20.54) suggests overvaluation risk amid poor earnings quality. | Medium | Medium |
| Liquidity | Current ratio (1.38) is adequate but offers limited cushion against short-term obligations. | Medium | Medium |
| Bankruptcy Risk | Altman Z-score of 2.72 places Hasbro in a grey zone, indicating moderate financial distress. | Medium | High |
| Operational Risk | Dependence on branded entertainment and licensing exposes business to consumer trends volatility. | Medium | Medium |
The most pressing risks for Hasbro stem from its profitability and leverage profile. Despite a strong ROIC, the company’s negative net margin and poor interest coverage highlight strained earnings and debt servicing capacity. The Altman Z-score underscores a moderate bankruptcy risk, warranting cautious monitoring. Elevated valuation multiples amid earnings weakness add further vulnerability in a cyclical consumer sector.
Should You Buy Hasbro, Inc.?
Hasbro, Inc. appears to present a very favorable moat with growing ROIC, suggesting durable competitive advantage and value creation. While profitability metrics remain weak and debt profile could raise concerns, the overall rating of C- reflects cautious optimism in operational efficiency.
Strength & Efficiency Pillars
Hasbro, Inc. shows operational resilience with a gross margin of 70.26% and a favorable ROIC of 25.32%, well above its WACC of 5.82%. This margin spread confirms Hasbro as a clear value creator. Despite a negative net margin (-6.86%), the company maintains solid asset efficiency with a fixed asset turnover of 18.97. These metrics reflect Hasbro’s ability to generate returns above its cost of capital, signaling a sustainable competitive advantage and growing profitability.
Weaknesses and Drawbacks
Hasbro’s Altman Z-Score of 2.72 places it in the grey zone, signaling moderate bankruptcy risk. This caution outweighs some operational strengths. The company’s debt-to-equity ratio at 5.77 and debt-to-assets of 58.81% represent heavy leverage, stressing financial flexibility. A high price-to-book ratio of 20.54 suggests overvaluation, while a low interest coverage ratio of 0.38 flags difficulty covering debt costs. These factors could pressure Hasbro’s stock and increase vulnerability in adverse markets.
Our Final Verdict about Hasbro, Inc.
Despite Hasbro’s clear operational value creation and a bullish stock trend supported by strong buyer dominance (80.59%), the moderate solvency risk indicated by the Altman Z-Score in the grey zone suggests caution. The company’s financial leverage and valuation concerns mean it may appear attractive but could warrant a wait-and-see approach before committing significant capital.
Disclaimer: This content is for informational purposes only and does not constitute financial, investment, or other professional advice. Investing in financial markets involves a significant risk of loss, and past performance is not indicative of future results.
Additional Resources
- Decoding Hasbro Inc (HAS): A Strategic SWOT Insight – GuruFocus (Feb 26, 2026)
- HASBRO, INC. SEC 10-K Report – TradingView (Feb 25, 2026)
- Fox Run Management L.L.C. Has $2.15 Million Stake in Hasbro, Inc. $HAS – MarketBeat (Feb 25, 2026)
- Insider Selling: Holly Barbacovi Sells Shares of Hasbro Inc (HAS) – GuruFocus (Feb 23, 2026)
- Hasbro, Inc. $HAS Shares Purchased by Aberdeen Group plc – MarketBeat (Feb 22, 2026)
For more information about Hasbro, Inc., please visit the official website: hasbro.com