Home > Analyses > Energy > Halliburton Company
Halliburton Company drives the backbone of global energy production through cutting-edge drilling and completion technologies. It commands a pivotal role in oilfield services, delivering advanced solutions that optimize well performance and reservoir management. Renowned for innovation, Halliburton shapes how energy companies extract resources efficiently and sustainably. As the energy sector evolves, I ask whether Halliburton’s operational strength and technological edge continue to justify its valuation and growth outlook.

Table of contents
Business Model & Company Overview
Halliburton Company, founded in 1919 and headquartered in Houston, Texas, stands as a dominant player in the Oil & Gas Equipment & Services industry. It operates a cohesive ecosystem spanning Completion and Production, plus Drilling and Evaluation segments. This integrated approach delivers advanced well completion, stimulation, drilling fluids, and digital solutions, underpinning its core mission to optimize energy extraction worldwide.
The company’s revenue engine balances robust hardware sales—like drill bits and pumps—with high-value software and recurring services, including cloud-based AI and reservoir management. Halliburton commands a strategic presence across the Americas, Europe, and Asia, leveraging its extensive footprint to serve global energy markets. Its economic moat lies in technological innovation and comprehensive service integration, shaping the industry’s future trajectory.
Financial Performance & Fundamental Metrics
I analyze Halliburton Company’s income statement, key financial ratios, and dividend payout policy to uncover its operational efficiency and shareholder return strategy.
Income Statement
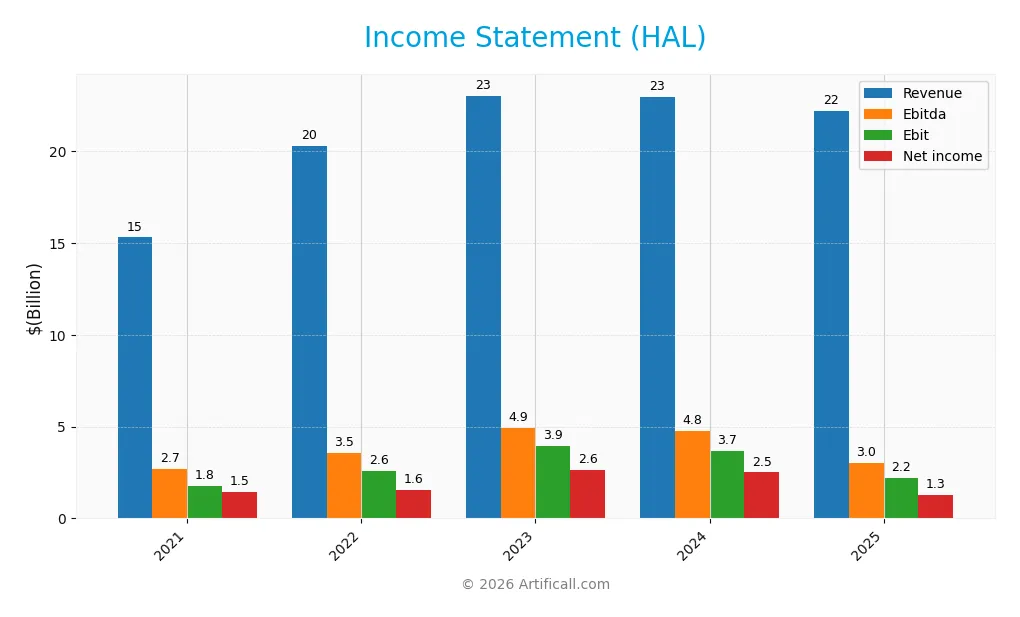
The table below summarizes Halliburton Company’s key income statement figures for the fiscal years 2021 through 2025 in USD, highlighting revenue, expenses, profitability, and earnings per share.
| 2021 | 2022 | 2023 | 2024 | 2025 | |
|---|---|---|---|---|---|
| Revenue | 15.3B | 20.3B | 23.0B | 22.9B | 22.2B |
| Cost of Revenue | 13.3B | 17.0B | 18.7B | 18.6B | 18.7B |
| Operating Expenses | 216M | 606M | 277M | 479M | 845M |
| Gross Profit | 2.0B | 3.3B | 4.4B | 4.3B | 3.5B |
| EBITDA | 2.7B | 3.5B | 4.9B | 4.8B | 3.0B |
| EBIT | 1.8B | 2.6B | 3.9B | 3.7B | 2.2B |
| Interest Expense | 529M | 492M | 578M | 450M | 418M |
| Net Income | 1.5B | 1.6B | 2.6B | 2.5B | 1.3B |
| EPS | 1.63 | 1.74 | 2.93 | 2.83 | 1.51 |
| Filing Date | 2022-02-04 | 2023-02-07 | 2024-02-06 | 2025-02-12 | 2026-02-06 |
Income Statement Evolution
Halliburton’s revenue grew 45% from 2021 to 2025 but declined 3.3% in the latest year. Net income decreased nearly 12% over the full period and dropped 47% in 2025. Gross and EBIT margins remained stable, around 15.8% and 9.9%, despite shrinking profits. The company faced margin pressure amid rising costs and weaker top-line momentum.
Is the Income Statement Favorable?
The 2025 income statement reveals unfavorable fundamentals. Net margin fell to 5.8%, down 47% year-over-year, signaling eroding profitability. EBIT contracted 41%, reflecting operational challenges. However, interest expense remained low at 1.9% of revenue, a relative strength. Overall, most income metrics deteriorated, pointing to an earnings environment under strain and caution warranted.
Financial Ratios
The table below summarizes key financial ratios for Halliburton Company over the last five fiscal years, highlighting profitability, liquidity, leverage, efficiency, and dividend metrics:
| Ratios | 2021 | 2022 | 2023 | 2024 | 2025 |
|---|---|---|---|---|---|
| Net Margin | 9.53% | 7.74% | 11.46% | 10.90% | 5.78% |
| ROE | 21.70% | 19.78% | 28.09% | 23.81% | 12.21% |
| ROIC | 9.86% | 11.13% | 16.46% | 14.70% | 9.70% |
| P/E | 14.00 | 22.63 | 12.32 | 9.59 | 18.48 |
| P/B | 3.04 | 4.48 | 3.46 | 2.28 | 2.26 |
| Current Ratio | 2.31 | 2.05 | 2.06 | 2.05 | 2.04 |
| Quick Ratio | 1.76 | 1.50 | 1.48 | 1.54 | 1.51 |
| D/E | 1.52 | 1.13 | 0.94 | 0.83 | 0.84 |
| Debt-to-Assets | 45.78% | 38.46% | 35.69% | 34.28% | 35.37% |
| Interest Coverage | 3.40 | 5.50 | 7.06 | 8.49 | 6.34 |
| Asset Turnover | 0.69 | 0.87 | 0.93 | 0.90 | 0.89 |
| Fixed Asset Turnover | 2.91 | 3.86 | 3.84 | 3.74 | 3.58 |
| Dividend Yield | 0.79% | 1.22% | 1.77% | 2.50% | 2.44% |
Evolution of Financial Ratios
From 2021 to 2025, Halliburton’s Return on Equity (ROE) showed volatility, peaking in 2023 before declining to 12.2% in 2025. The Current Ratio remained stable above 2.0, indicating consistent liquidity. Meanwhile, the Debt-to-Equity Ratio decreased from 1.52 in 2021 to around 0.84 in 2025, reflecting reduced leverage and improved balance sheet strength.
Are the Financial Ratios Favorable?
In 2025, profitability ratios like net margin (5.78%) and ROE (12.2%) are neutral, suggesting moderate returns. Liquidity ratios, including a Current Ratio of 2.04 and Quick Ratio of 1.51, are favorable, signaling solid short-term financial health. Leverage metrics such as Debt-to-Equity at 0.84 are neutral, while interest coverage and fixed asset turnover ratios are favorable. Overall, about 43% of key ratios are favorable, with no unfavorable ratings, resulting in a slightly favorable financial profile.
Shareholder Return Policy
Halliburton maintains a consistent dividend policy with a payout ratio around 45% in 2025 and a 2.44% dividend yield. The dividend per share rose steadily from $0.18 in 2021 to $0.69 in 2025, supported by free cash flow coverage above 50%.
The company also engages in share buybacks, balancing capital returns with reinvestment. This disciplined approach supports sustainable long-term value creation, though the payout ratio near 50% warrants monitoring for potential distribution risks amid market volatility.
Score analysis
The radar chart below visualizes Halliburton’s key financial scores across valuation, profitability, and leverage factors:
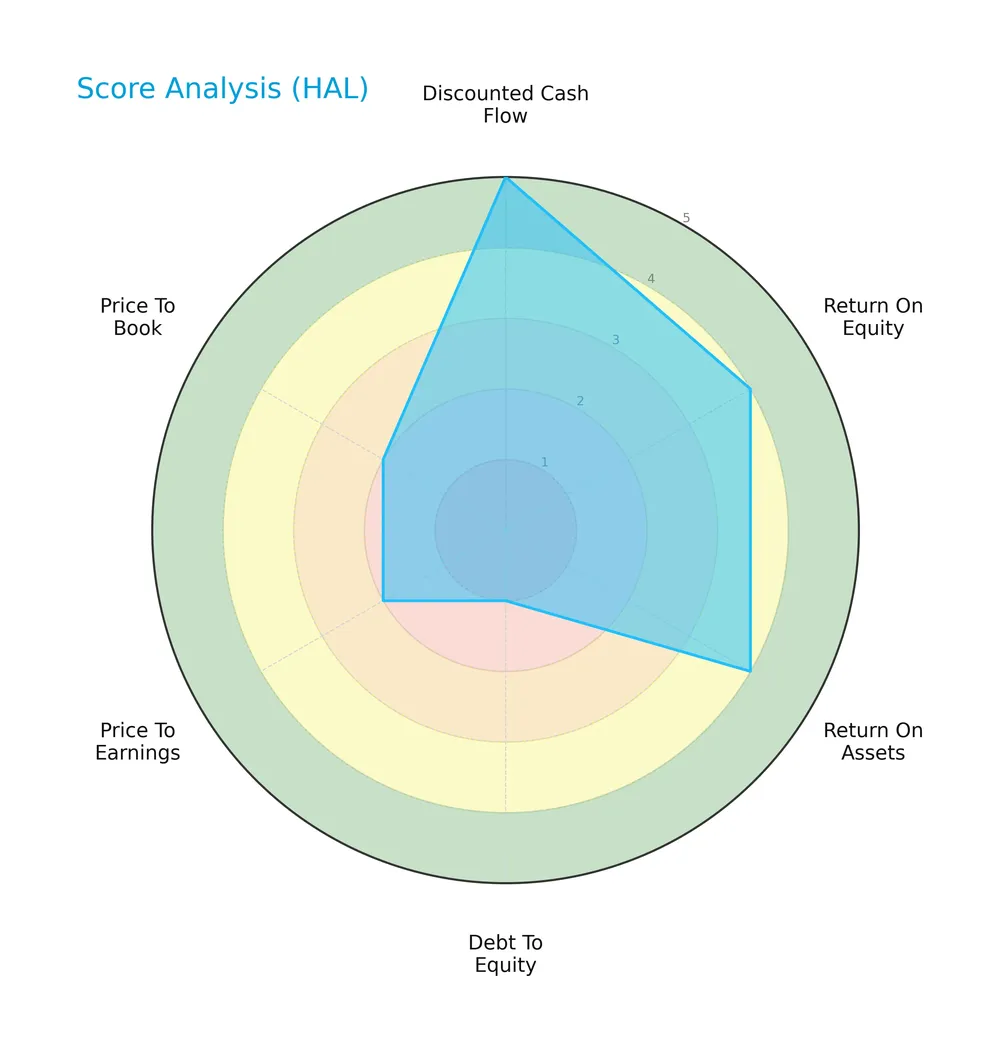
Halliburton scores very favorably in discounted cash flow (5) and shows favorable returns on equity (4) and assets (4). However, its debt-to-equity ratio scores very unfavorably (1), with valuation metrics price-to-earnings (2) and price-to-book (2) also lagging. Overall, the composite score is moderate (3).
Analysis of the company’s bankruptcy risk
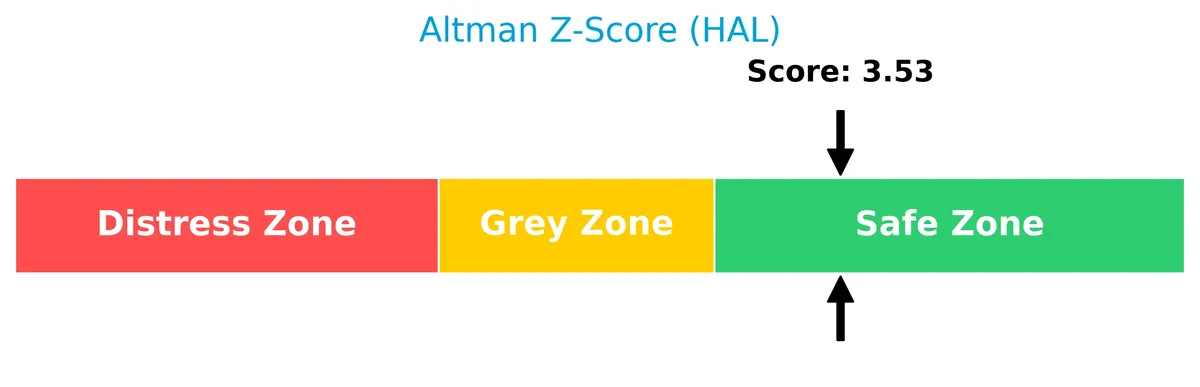
Halliburton’s Altman Z-Score places it securely in the safe zone, indicating a low bankruptcy risk and solid financial stability:
Is the company in good financial health?
The Piotroski Score diagram illustrates Halliburton’s average financial health based on profitability, leverage, and efficiency measures:

With a score of 5, Halliburton sits in the average range, reflecting mixed signals about its financial strength and operational efficiency.
Competitive Landscape & Sector Positioning
This analysis explores Halliburton Company’s strategic positioning, revenue segments, key products, and main competitors. I will assess whether Halliburton holds a competitive advantage within its sector.
Strategic Positioning
Halliburton operates a diversified portfolio with two main segments: Completion and Production (13.3B in 2024) and Drilling and Evaluation (9.7B). Geographically, it generates significant revenue across North America (9.6B), Middle East/Asia (6.1B), Latin America (4.2B), and Europe/Africa/CIS (3B), reflecting broad global exposure.
Revenue by Segment
This pie chart illustrates Halliburton’s revenue breakdown between Completion And Production and Drilling And Evaluation segments for fiscal year 2024.
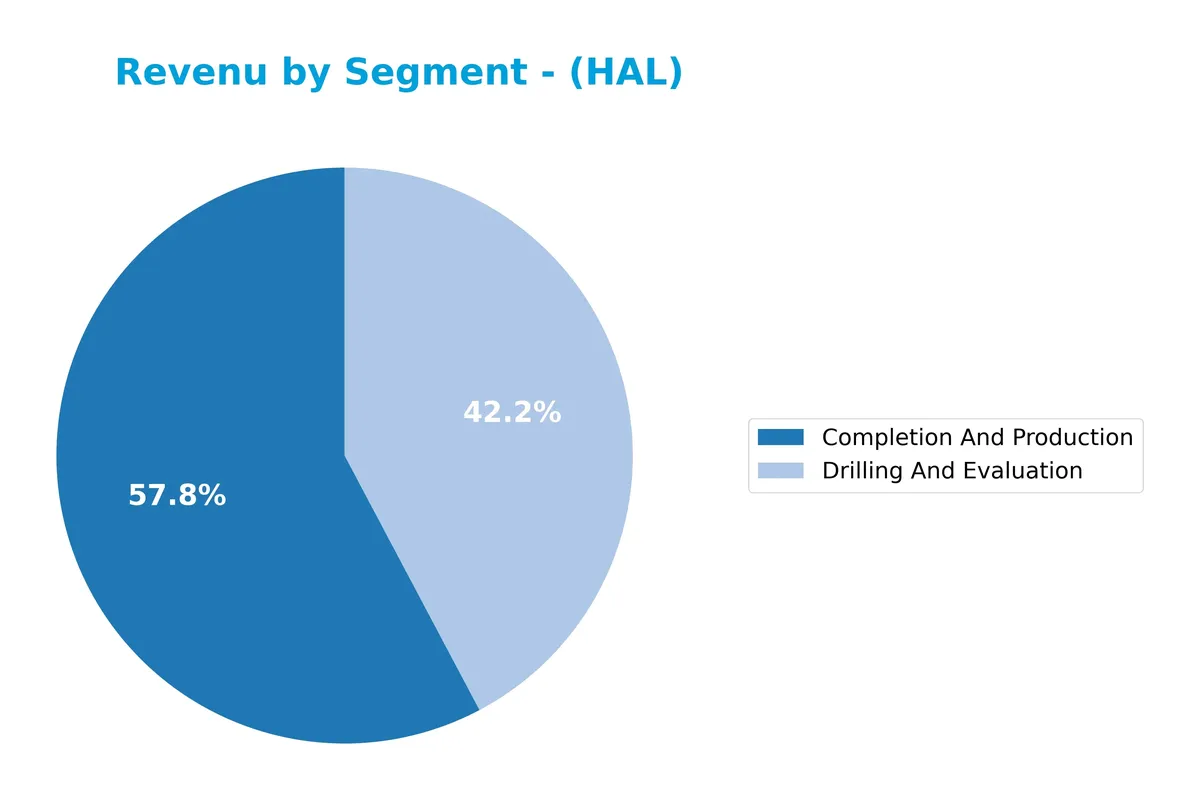
Completion And Production leads with $13.3B, consistently outpacing Drilling And Evaluation, which generated $9.7B in 2024. Historically, Completion And Production has driven Halliburton’s growth, reflecting its strategic emphasis on well completion services. The slight decline from 2023’s $13.7B signals a modest slowdown, but the segment remains the core revenue contributor with less concentration risk than a single-segment dependency.
Key Products & Brands
The table below outlines Halliburton’s primary products and brands by segment and their descriptions:
| Product | Description |
|---|---|
| Completion and Production | Services include stimulation, sand control, cementing, downhole completion tools, artificial lift, coiled tubing, and pipeline process services. |
| Drilling and Evaluation | Offers drilling fluids, performance additives, drill bits, wireline and perforating services, digital AI solutions, testing, and subsea services. |
Halliburton’s products focus on upstream oilfield services. Completion and Production drives enhanced well productivity. Drilling and Evaluation supports exploration and reservoir analysis. Both segments integrate technology and field services essential to energy operations.
Main Competitors
In the Energy sector’s Oil & Gas Equipment & Services industry, four competitors exist. Below is the list of the top 10 leaders by market capitalization:
| Competitor | Market Cap. |
|---|---|
| SLB N.V. | 60B |
| Baker Hughes Company | 47B |
| Halliburton Company | 25B |
| TechnipFMC plc | 19B |
Halliburton ranks 3rd among its four competitors, holding roughly 50% of the market cap of the leader, SLB N.V. The company sits below both the average market cap of the top 10 peers (37.7B) and the sector median (36B). It maintains a significant 56% gap to its next closest competitor above, Baker Hughes.
Comparisons with competitors
Check out how we compare the company to its competitors:
Does Halliburton have a competitive advantage?
Halliburton demonstrates a competitive advantage by consistently generating a ROIC 3.2% above its WACC, indicating efficient use of capital and value creation despite a declining profitability trend. Its diverse product and service offerings in Completion, Production, Drilling, and digital solutions support its strong position in the oil and gas equipment and services sector.
Looking ahead, Halliburton’s expansion across multiple geographies, including North America, Middle East/Asia, and Latin America, alongside investments in cloud-based digital services and AI for reservoir management, suggests potential growth opportunities in evolving energy markets.
SWOT Analysis
This analysis highlights Halliburton’s core competitive factors and areas for improvement to guide strategic decisions.
Strengths
- Diversified global footprint
- Strong cash flow generation
- Favorable interest coverage ratio
Weaknesses
- Declining revenue and profit growth
- Below-par net margin trend
- High debt-to-equity ratio
Opportunities
- Expansion in Middle East/Asia markets
- Adoption of AI and cloud digital services
- Increasing global energy demand
Threats
- Volatile oil prices
- Regulatory and environmental pressures
- Intense industry competition
Halliburton’s strengths in global reach and financial stability support resilience. However, deteriorating profitability and leverage risks require cautious capital allocation. Growth hinges on leveraging technology and regional expansion while managing external market volatility.
Stock Price Action Analysis
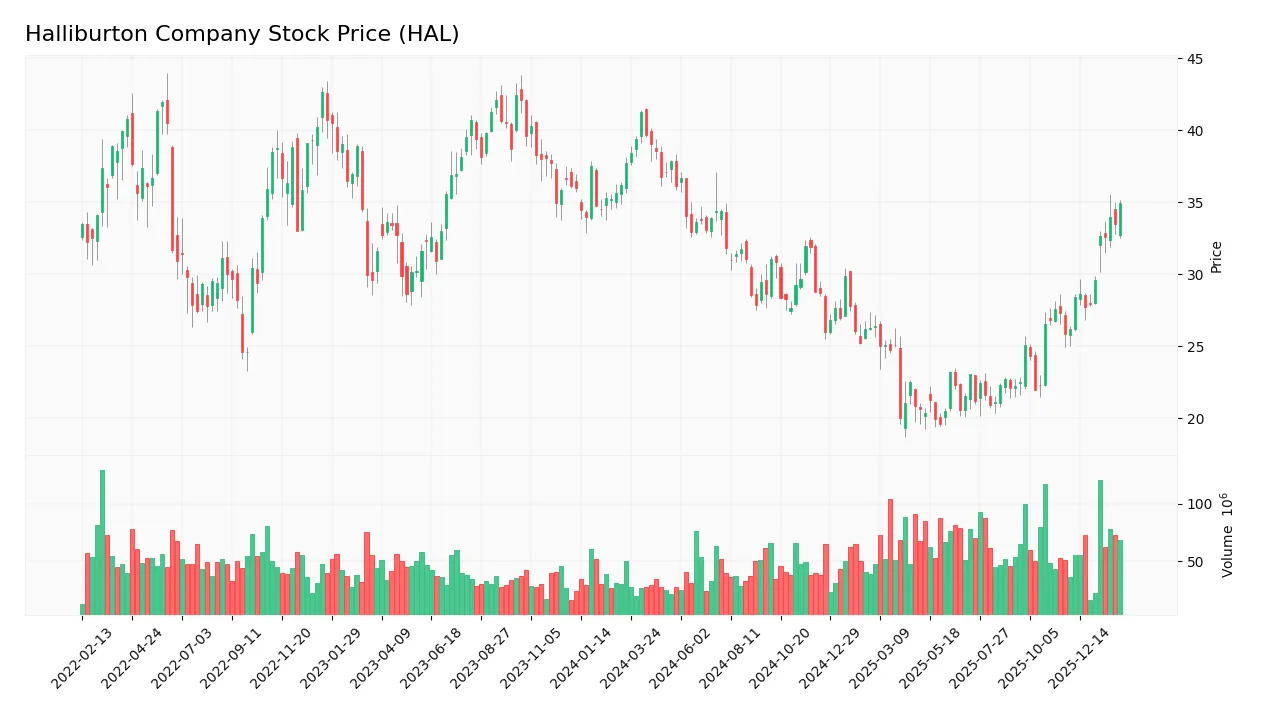
The weekly stock chart highlights Halliburton Company’s price fluctuations and recent momentum over the specified period:
Trend Analysis
Over the past 12 months, HAL’s stock price declined by 7.29%, indicating a bearish trend. The trend shows acceleration with a high volatility level (5.55% std deviation). The stock’s range spanned from a high of 41.24 to a low of 19.59, reflecting significant price swings.
Volume Analysis
In the last three months, trading volumes increased, driven predominantly by buyers. Buyer volume accounted for 63.67%, signaling strong demand and heightened market participation. This buyer dominance suggests growing investor confidence during this period.
Target Prices
Analysts set a target consensus that reflects cautious optimism for Halliburton Company.
| Target Low | Target High | Consensus |
|---|---|---|
| 25 | 40 | 35.23 |
The target range shows moderate upside potential, with analysts expecting shares to trade near the mid-30s, indicating confidence in recovery amid sector volatility.

Don’t Let Luck Decide Your Entry Point
Optimize your entry points with our advanced ProRealTime indicators. You’ll get efficient buy signals with precise price targets for maximum performance. Start outperforming now!
Analyst & Consumer Opinions
This section reviews analyst ratings and consumer feedback to provide a balanced view of Halliburton Company’s market perception.
Stock Grades
Here are the latest verified analyst grades for Halliburton Company from recognized financial institutions:
| Grading Company | Action | New Grade | Date |
|---|---|---|---|
| UBS | Maintain | Neutral | 2026-01-23 |
| Citigroup | Maintain | Buy | 2026-01-23 |
| Stifel | Maintain | Buy | 2026-01-22 |
| Evercore ISI Group | Maintain | In Line | 2026-01-22 |
| Goldman Sachs | Maintain | Buy | 2026-01-22 |
| Susquehanna | Maintain | Positive | 2026-01-22 |
| RBC Capital | Maintain | Outperform | 2026-01-22 |
| JP Morgan | Maintain | Overweight | 2026-01-22 |
| Stifel | Maintain | Buy | 2026-01-21 |
| Piper Sandler | Maintain | Neutral | 2026-01-14 |
The consensus clearly favors a buy stance, with the majority of firms maintaining positive or outperform ratings. Neutral grades appear but do not outweigh the bullish sentiment across top-tier analysts.
Consumer Opinions
Halliburton Company evokes a mix of admiration and critique from its consumer base, reflecting its complex role in the energy sector.
| Positive Reviews | Negative Reviews |
|---|---|
| Reliable service delivery under challenging conditions. | High service costs impacting project budgets. |
| Strong technical expertise and innovation in drilling. | Occasional delays in project timelines. |
| Responsive customer support with knowledgeable staff. | Environmental concerns raised by some clients. |
Overall, consumers praise Halliburton’s technical skills and reliability. However, cost concerns and environmental issues remain notable points of dissatisfaction.
Risk Analysis
Below is a table summarizing Halliburton’s key risks, their likelihood, and potential impact on the company:
| Category | Description | Probability | Impact |
|---|---|---|---|
| Commodity Price Risk | Fluctuations in oil and gas prices can reduce demand for Halliburton’s services and products. | High | High |
| Debt Levels | Relatively moderate debt-to-equity ratio (0.84) but debt coverage remains a concern. | Medium | Medium |
| Market Volatility | Beta of 0.75 indicates less volatility than the market but sector cyclicality persists. | Medium | Medium |
| Technological Disruption | Advances in energy technologies or competitors’ innovations could erode market share. | Medium | High |
| Regulatory Risk | Environmental and safety regulations could increase costs or limit operations. | Medium | High |
Halliburton’s biggest risk lies in commodity price swings that directly influence capital spending by oil companies. Despite a safe Altman Z-Score of 3.53, debt remains a moderate concern given the sector’s capital intensity. Regulatory and technological risks could also significantly impact future earnings.
Should You Buy Halliburton Company?
Halliburton appears to be generating solid value creation with a slightly favorable moat despite a declining ROIC trend. Its leverage profile raises caution, reflected in a very unfavorable debt-to-equity score. Overall, the company suggests a B+ rating with moderate financial strength.
Strength & Efficiency Pillars
Halliburton Company exhibits solid operational efficiency with a net margin of 5.78% and a return on equity (ROE) of 12.21%. Its return on invested capital (ROIC) stands at 9.7%, comfortably above the weighted average cost of capital (WACC) at 6.49%, confirming the company as a clear value creator. Interest coverage at 5.24x and a current ratio of 2.04 further underline prudent financial management. While profitability shows slight decline, Halliburton maintains favorable cost control and asset turnover metrics.
Weaknesses and Drawbacks
The company faces moderate valuation concerns, with a price-to-earnings (P/E) ratio of 18.48 and a price-to-book (P/B) ratio of 2.26, both neutral but edging toward premium territory relative to sector norms. Revenue growth is negative at -3.31% over one year, coupled with a steep 40.53% drop in EBIT and a 47% fall in EPS, signaling operational headwinds. Despite a manageable debt-to-equity ratio of 0.84, the overall bearish 7.29% price trend and recent market volatility suggest caution amid ongoing sector pressures.
Our Final Verdict about Halliburton Company
Halliburton’s fundamental profile could appear attractive due to its value-creating ROIC and solid liquidity. However, the negative recent earnings trends and bearish overall stock momentum suggest a wait-and-see approach might be prudent. While the recent buyer dominance at 63.67% points to improving sentiment, investors may prefer to observe for a clearer recovery signal before committing significant capital.
Disclaimer: This content is for informational purposes only and does not constitute financial, investment, or other professional advice. Investing in financial markets involves a significant risk of loss, and past performance is not indicative of future results.
Additional Resources
- Is Halliburton (HAL) Offering Value After Recent Share Price Strength? – Yahoo Finance (Feb 06, 2026)
- Halliburton Co (NYSE:HAL) Shows Perfect Technical Setup for a Breakout – Chartmill (Feb 06, 2026)
- HALLIBURTON CO SEC 10-K Report – TradingView (Feb 06, 2026)
- Short Interest in Halliburton Company (NYSE:HAL) Increases By 23.6% – MarketBeat (Feb 03, 2026)
- Halliburton Company Stock: Analyst Estimates & Ratings – Barchart.com (Feb 04, 2026)
For more information about Halliburton Company, please visit the official website: halliburton.com