Home > Analyses > Financial Services > Globe Life Inc.
Globe Life Inc. safeguards millions of American families by providing essential life and supplemental health insurance. It commands a strong position in the life insurance sector, known for its reliable whole and term life policies, as well as innovative supplemental health plans. With a reputation for consistent underwriting and disciplined capital allocation, Globe Life shapes financial security for the middle-income market. The key question: does its current valuation reflect sustainable growth in a competitive, evolving insurance landscape?

Table of contents
Business Model & Company Overview
Globe Life Inc., founded in 1979 and headquartered in McKinney, Texas, stands as a prominent player in the Insurance – Life industry. The company crafts an integrated ecosystem of life and supplemental health insurance products, alongside annuities, targeting lower middle to middle-income U.S. households. Its diverse offerings—from whole and term life insurance to Medicare supplements and critical illness plans—form a cohesive mission to provide financial security and peace of mind.
The company’s revenue engine balances multiple streams: life insurance premiums, supplemental health policies, annuities, and investment income. This diversification underpins stable cash flows across varying economic cycles. Globe Life’s strategic footprint spans the U.S., with a focus on expanding its reach in key domestic markets. Its strong competitive advantage lies in deep customer relationships and tailored product design, creating a durable economic moat that shapes the evolving life insurance landscape.
Financial Performance & Fundamental Metrics
I analyze Globe Life Inc.’s income statement, key financial ratios, and dividend payout policy to assess its core financial health and shareholder returns.
Income Statement
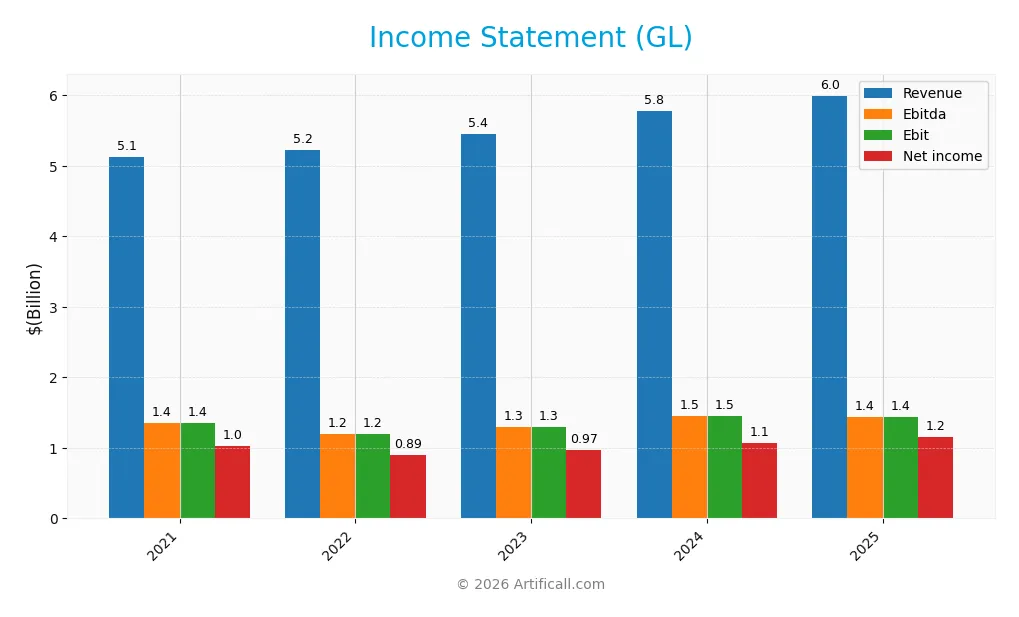
The table below presents Globe Life Inc.’s key income statement figures for fiscal years 2021 through 2025, showing consistent growth in revenue and net income.
| 2021 | 2022 | 2023 | 2024 | 2025 | |
|---|---|---|---|---|---|
| Revenue | 5.12B | 5.23B | 5.45B | 5.78B | 6.00B |
| Cost of Revenue | 3.43B | 3.69B | 3.81B | 3.91B | 3.99B |
| Operating Expenses | 412M | 439M | 446M | 544M | 541M |
| Gross Profit | 1.69B | 1.54B | 1.64B | 1.87B | 2.00B |
| EBITDA | 1.36B | 1.19B | 1.30B | 1.45B | 1.59B |
| EBIT | 1.36B | 1.19B | 1.30B | 1.45B | 1.59B |
| Interest Expense | 83M | 90M | 102M | 127M | 141M |
| Net Income | 1.03B | 894M | 971M | 1.07B | 1.16B |
| EPS | 7.3 | 9.13 | 10.21 | 11.99 | 14.3 |
| Filing Date | 2022-02-24 | 2023-02-23 | 2024-02-28 | 2025-02-26 | 2026-02-25 |
Income Statement Evolution
From 2021 to 2025, Globe Life’s revenue rose 17.13% to $6B, showing steady expansion. Net income grew 12.61% over the same period, reaching $1.16B. Gross and EBIT margins remained favorable at 33.4% and 26.54%, respectively. However, net margin declined slightly by 3.86%, indicating some pressure on profitability.
Is the Income Statement Favorable?
The 2025 income statement reflects solid fundamentals with a net margin of 19.36% and a 4.45% neutral growth in net margin year-over-year. EBIT increased 9.49%, supported by controlled operating expenses and a low interest expense ratio of 2.35%. EPS surged 17.76%, highlighting effective capital allocation and earnings quality. Overall, the income statement is favorable.
Financial Ratios
The table below presents key financial ratios for Globe Life Inc. across fiscal years 2021 to 2025, offering a snapshot of profitability, liquidity, leverage, and valuation metrics:
| Ratios | 2021 | 2022 | 2023 | 2024 | 2025 |
|---|---|---|---|---|---|
| Net Margin | 20.13% | 17.11% | 17.82% | 18.53% | 19.36% |
| ROE | 11.93% | 22.65% | 21.64% | 20.18% | 19.43% |
| ROIC | -87.52% | 8.03% | 5.22% | 14.35% | 45.76% |
| P/E | 9.28 | 13.20 | 11.92 | 8.74 | 9.74 |
| P/B | 1.11 | 2.99 | 2.58 | 1.76 | 1.89 |
| Current Ratio | 0.38 | 0.76 | 0.80 | 0.80 | 4.03 |
| Quick Ratio | 0.38 | 0.76 | 0.80 | 0.80 | 4.03 |
| D/E | 0.23 | 0.53 | 0.47 | 0.52 | 0.05 |
| Debt-to-Assets | 6.81% | 7.99% | 7.54% | 9.42% | 0.99% |
| Interest Coverage | 15.27x | 12.19x | 11.67x | 10.44x | 10.36x |
| Asset Turnover | 0.17 | 0.20 | 0.19 | 0.20 | 0.19 |
| Fixed Asset Turnover | 24.98 | 24.65 | 22.70 | 20.27 | 0 |
| Dividend Yield | 0.84% | 0.68% | 0.73% | 0.91% | 0.75% |
Evolution of Financial Ratios
From 2021 to 2025, Globe Life Inc.’s Return on Equity (ROE) showed a steady increase, rising from 11.93% to 19.43%. The Current Ratio demonstrated significant improvement, surging from 0.38 to 4.03, indicating enhanced liquidity. The Debt-to-Equity Ratio declined markedly, from 0.23 in 2021 to 0.05 in 2025, reflecting reduced leverage and stronger balance sheet stability.
Are the Financial Ratios Fovorable?
In 2025, profitability metrics like net margin (19.36%) and ROE (19.43%) were favorable, supported by a robust ROIC of 45.76% well above the WACC of 6.61%. Liquidity showed mixed signals: a high Current Ratio (4.03) was unfavorable, yet the Quick Ratio was favorable. Leverage ratios were strongly favorable with a low Debt-to-Equity (0.05) and Debt-to-Assets (0.99%). Asset turnover and dividend yield were unfavorable, while valuation multiples like P/E (9.74) were favorable and P/B neutral. Overall, 64% of key ratios were favorable, indicating a generally positive financial profile.
Shareholder Return Policy
Globe Life Inc. maintains a consistent dividend policy with a payout ratio around 7-9% and a dividend yield near 0.7-0.9%. Dividends per share have steadily increased from $0.78 in 2021 to $1.05 in 2025. The dividend payments are well covered by free cash flow, supporting financial sustainability.
The company also engages in share buybacks, complementing its dividend distributions. This balanced approach appears prudent, aligning with sustainable long-term shareholder value creation. Risks related to excessive payout or repurchase levels seem minimal given the strong cash flow coverage.
Score analysis
Below is a radar chart presenting key valuation and financial performance scores for Globe Life Inc.:
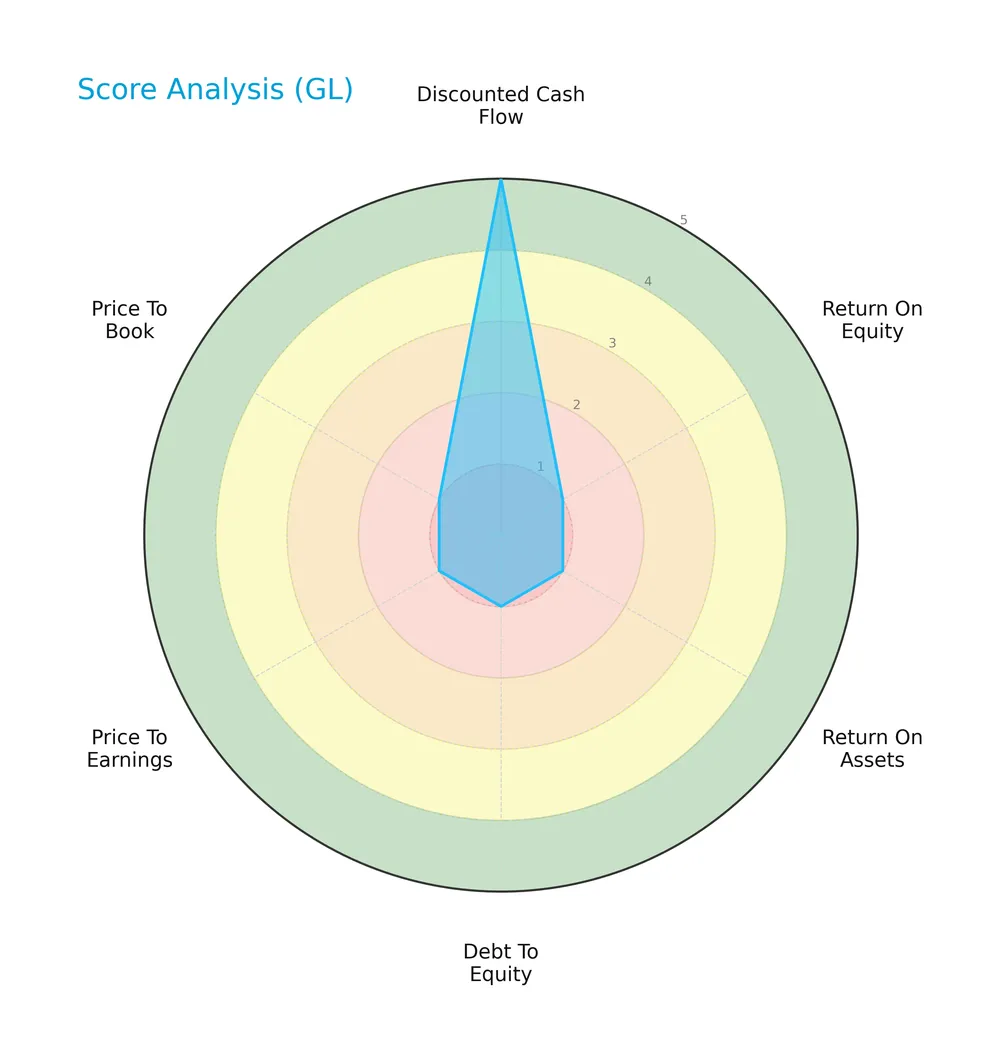
The company shows a very favorable discounted cash flow score of 5 but struggles with profitability and leverage, reflected in very unfavorable scores of 1 for ROE, ROA, debt-to-equity, and price-to-book. The price-to-earnings score is moderate at 3, indicating mixed market valuation signals.
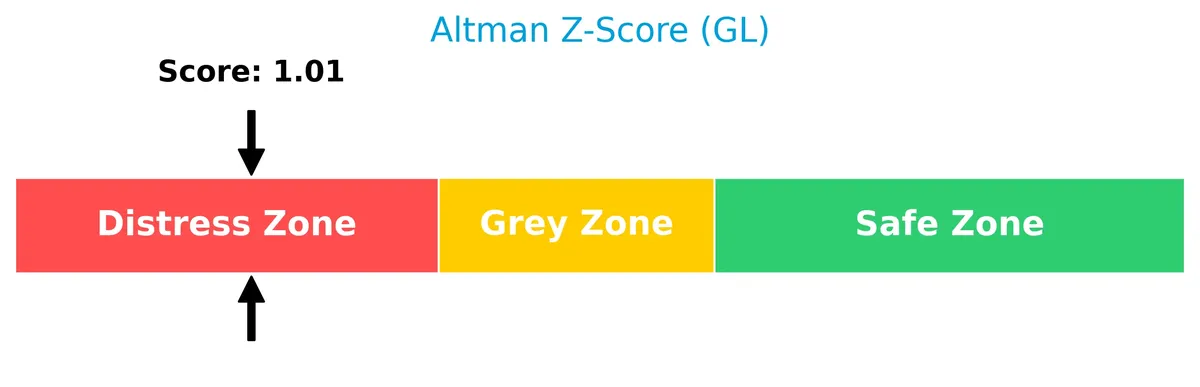
Analysis of the company’s bankruptcy risk
The Altman Z-Score places Globe Life Inc. in the distress zone, signaling a high risk of financial distress and potential bankruptcy:
Is the company in good financial health?
The Piotroski Score diagram illustrates the company’s financial strength based on nine fundamental criteria:
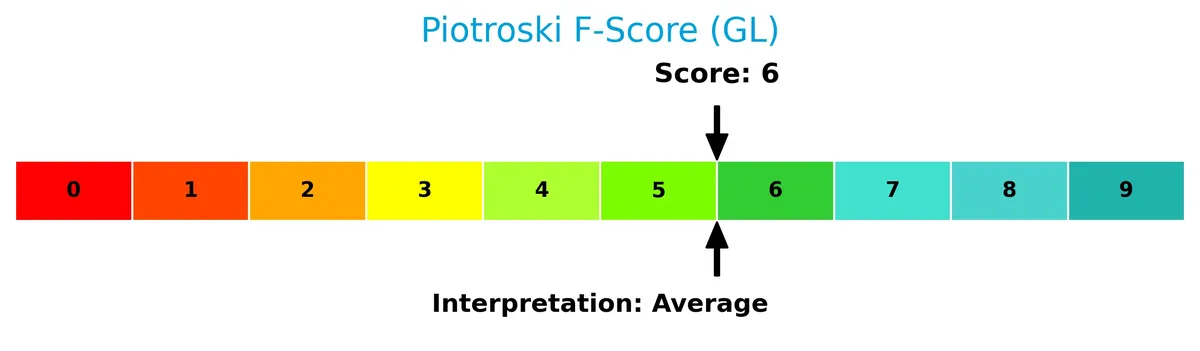
With a strong score of 7, Globe Life demonstrates solid financial health despite risks indicated by other metrics. This suggests effective operational management and resilience in its financial structure.
Competitive Landscape & Sector Positioning
This sector analysis examines Globe Life Inc.’s strategic positioning, revenue breakdown, key products, competitors, and competitive advantages. I will assess whether Globe Life holds a sustainable edge over its main rivals.
Strategic Positioning
Globe Life Inc. concentrates primarily on life insurance, generating over 3.3B in 2025 revenue, supported by growing supplemental health insurance near 1.5B. The company maintains a focused U.S. market presence, with limited diversification into annuities and investments.
Revenue by Segment
This pie chart displays Globe Life Inc.’s revenue distribution by segment for fiscal year 2025, highlighting the primary sources of income within the company.
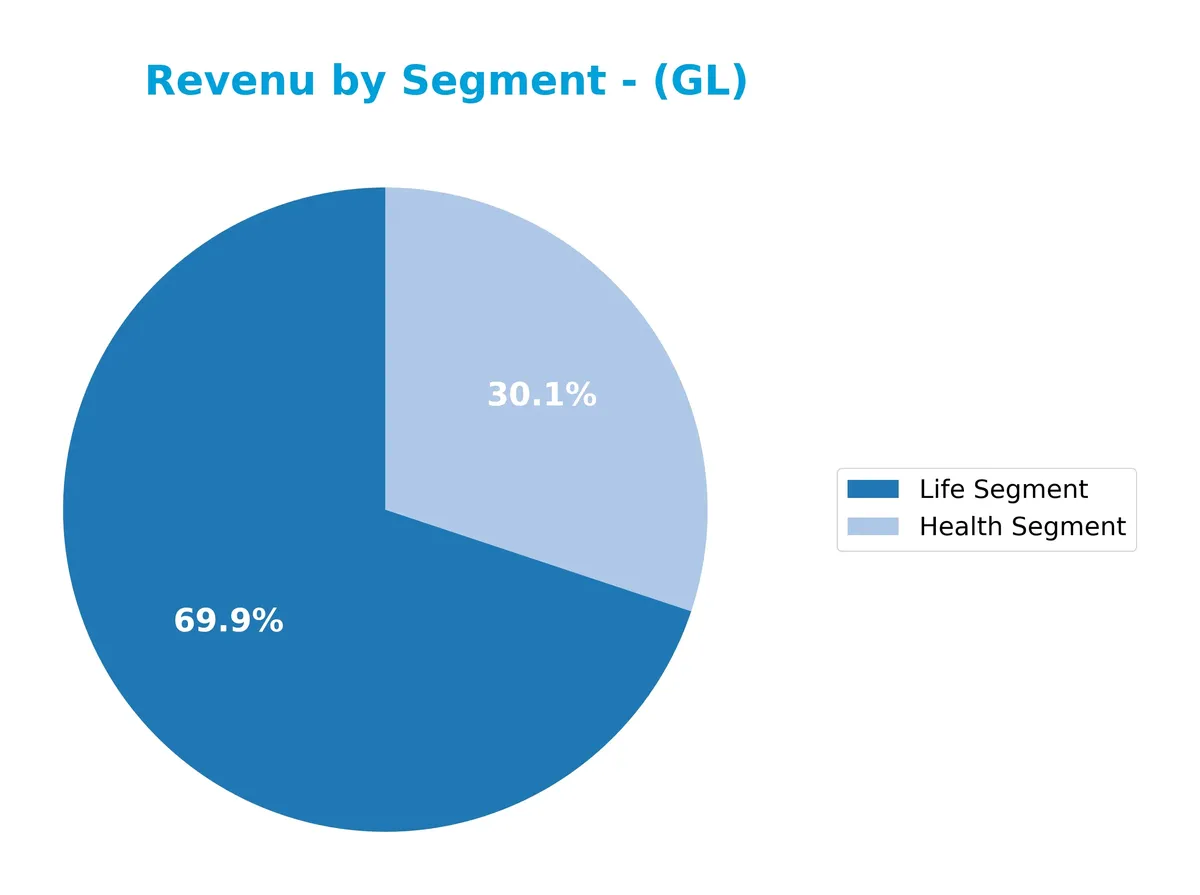
In 2025, Life Segment revenue reached $3.36B, clearly dominating Globe Life’s portfolio. Health Segment contributed $1.53B, showing steady growth over recent years. Life consistently drives the business, while Health’s gradual acceleration reduces concentration risk. Other segments have become negligible or omitted, indicating a focused operational strategy on these two core areas. The trend suggests disciplined capital allocation towards expanding Life and Health revenues.
Key Products & Brands
The following table outlines Globe Life Inc.’s primary products and brands by segment:
| Product | Description |
|---|---|
| Life Insurance | Whole life, term life, and other life insurance products targeting lower middle to middle income households. |
| Supplemental Health Insurance | Medicare supplement plans and supplemental health products, including critical illness and accident coverage. |
| Annuities | Single-premium and flexible-premium deferred annuities. |
| Investments | Investment segment activities supporting the insurance business. |
Globe Life focuses on life and supplemental health insurance products, along with annuities and investment services. Its offerings cater primarily to middle-income American households, reflecting a diversified insurance portfolio.
Main Competitors
The Financial Services sector includes 4 main competitors, with the table listing the top 4 leaders by market capitalization:
| Competitor | Market Cap. |
|---|---|
| Aflac Incorporated | 59.6B |
| MetLife, Inc. | 52.9B |
| Prudential Financial, Inc. | 40.2B |
| Globe Life Inc. | 11.0B |
Globe Life Inc. ranks 4th among its competitors with a market cap just 19% of the sector leader, Aflac. It sits well below both the top 10 average of 41B and the sector median of 46B. The company maintains a significant 250% gap below its nearest rival, Prudential Financial, highlighting a meaningful scale disadvantage.
Comparisons with competitors
Check out how we compare the company to its competitors:
Does Globe Life have a competitive advantage?
Globe Life presents a strong competitive advantage, demonstrated by a very favorable moat rating and a ROIC that exceeds WACC by over 39%. The company efficiently uses invested capital, creating consistent value and sustaining profitability.
Looking ahead, Globe Life’s diverse product portfolio—including life, supplemental health insurance, and annuities—positions it well to capture growth opportunities across middle-income U.S. households. Its expanding return on invested capital suggests continued strength in capital allocation and future earnings potential.
SWOT Analysis
This SWOT analysis highlights Globe Life Inc.’s key internal and external factors shaping its strategic outlook.
Strengths
- strong ROIC well above WACC
- growing profitability trend
- favorable net margin and EBIT margin
Weaknesses
- low Altman Z-Score signals financial distress risk
- weak asset turnover
- low dividend yield
Opportunities
- expanding life and supplemental health insurance markets
- potential to improve asset utilization
- leveraging digital sales channels
Threats
- increasing regulatory scrutiny
- market competition from larger insurers
- economic downturn impacting policy sales
Globe Life’s robust profitability and moat position it well for value creation. However, financial distress signals and operational efficiency gaps require careful risk management. The company should capitalize on market growth while mitigating regulatory and competitive pressures.
Stock Price Action Analysis
The weekly stock chart for Globe Life Inc. (GL) shows price movements over the past 12 months, highlighting key highs and lows:
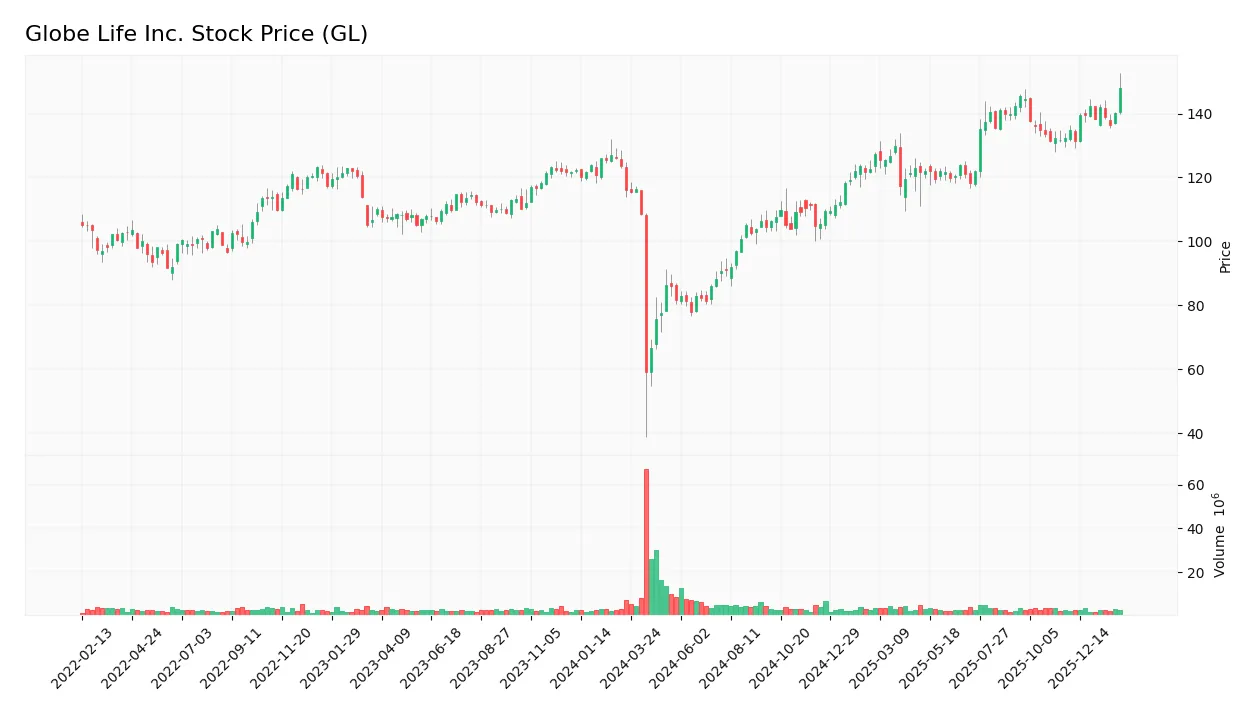
Trend Analysis
Over the past year, GL’s stock gained 32.92%, indicating a bullish trend. The price moved from a low of 59.09 to a high of 146.51, with volatility measured by a 20.69 standard deviation. The trend shows deceleration despite positive gains. Recent three-month gains of 3.36% reflect continued, moderate upward momentum.
Volume Analysis
Trading volume for GL totals 553M shares, with buyer activity at 54.37%, though volume is decreasing overall. In the last three months, buyers dominate with 64.58% of 27.9M shares traded, suggesting strong investor interest but waning market participation. This buyer-driven activity signals cautious optimism.
Target Prices
Analysts set a solid target consensus for Globe Life Inc., reflecting steady confidence in the stock’s near-term prospects.
| Target Low | Target High | Consensus |
|---|---|---|
| 157 | 176 | 164.5 |
The target range suggests moderate upside potential. Analysts expect Globe Life to maintain stable growth within a well-defined valuation band.

Don’t Let Luck Decide Your Entry Point
Optimize your entry points with our advanced ProRealTime indicators. You’ll get efficient buy signals with precise price targets for maximum performance. Start outperforming now!
Analyst & Consumer Opinions
This section reviews analyst ratings and consumer feedback to offer a balanced view of Globe Life Inc.’s standing.
Stock Grades
Here are the latest verified analyst grades for Globe Life Inc. from well-established financial institutions:
| Grading Company | Action | New Grade | Date |
|---|---|---|---|
| Wells Fargo | Maintain | Overweight | 2026-02-25 |
| Evercore ISI Group | Maintain | In Line | 2026-02-18 |
| Truist Securities | Maintain | Buy | 2026-02-06 |
| JP Morgan | Maintain | Overweight | 2026-02-05 |
| TD Cowen | Maintain | Buy | 2025-12-11 |
| Morgan Stanley | Maintain | Overweight | 2025-11-17 |
| Keefe, Bruyette & Woods | Maintain | Outperform | 2025-10-28 |
| Truist Securities | Maintain | Buy | 2025-10-24 |
| Wells Fargo | Maintain | Overweight | 2025-10-24 |
| Wells Fargo | Maintain | Overweight | 2025-10-08 |
The grades reveal a consistent pattern of positive sentiment, with multiple firms maintaining Buy and Overweight ratings. However, the consensus remains cautious with a Hold stance, reflecting some divergence in analyst opinion.
Consumer Opinions
Consumers express mixed feelings about Globe Life Inc., reflecting both satisfaction with service and concerns about pricing.
| Positive Reviews | Negative Reviews |
|---|---|
| “Responsive customer service that resolves claims quickly.” | “Premiums have increased significantly over the past year.” |
| “Simple, straightforward insurance policies.” | “Limited coverage options compared to competitors.” |
| “Reliable payouts when claims are filed.” | “The online portal can be confusing and outdated.” |
Overall, Globe Life earns praise for its dependable claims process and service quality. However, customers frequently cite rising premiums and limited product variety as key drawbacks.
Risk Analysis
Below is a summary table of key risks facing Globe Life Inc., highlighting their likelihood and potential impact:
| Category | Description | Probability | Impact |
|---|---|---|---|
| Financial Distress | Altman Z-Score signals risk of bankruptcy (1.13, distress zone) | High | High |
| Liquidity | Unfavorable current ratio despite strong quick ratio | Moderate | Medium |
| Asset Efficiency | Low asset and fixed asset turnover indicate poor utilization | Moderate | Medium |
| Valuation | Low dividend yield and mixed price multiples | Moderate | Low |
| Leverage | Extremely low debt-to-equity, which may limit growth leverage | Low | Low |
The most pressing risk is financial distress, signaled by the Altman Z-Score well below the safe threshold of 3. This contrasts with a strong Piotroski score of 7, showing operational strength. Low asset turnover and unbalanced liquidity ratios suggest capital inefficiencies that could pressure returns. Investors should closely monitor these risks despite favorable ROIC and WACC metrics.
Should You Buy Globe Life Inc.?
Globe Life Inc. appears to be creating strong value with a durable competitive moat, evidenced by a growing ROIC well above WACC. While profitability is robust, its leverage profile and some financial scores suggest caution. Overall, the rating is a cautious C+.
Strength & Efficiency Pillars
Globe Life Inc. delivers robust operational efficiency, marked by a net margin of 19.36% and a return on equity of 19.43%. Its return on invested capital (45.76%) far exceeds the weighted average cost of capital (6.61%), confirming the company as a clear value creator. I note its gross margin of 33.4% and EBIT margin of 26.54% reinforce strong core profitability. These metrics reflect disciplined capital allocation and a sustainable competitive advantage, underscored by a growing ROIC trend.
Weaknesses and Drawbacks
The company is in financial distress, with an Altman Z-Score of 1.13 signaling a high bankruptcy risk. This solvency concern overshadows other strengths. Additionally, the current ratio stands at a concerning 4.03, flagged as unfavorable despite seeming ample liquidity—suggesting potential asset misallocation. Valuation metrics are mixed; the price-to-earnings ratio of 9.74 is reasonable, but the price-to-book ratio at 1.89 is only neutral. Low asset turnover and a weak dividend yield (0.75%) also highlight operational inefficiencies.
Our Final Verdict about Globe Life Inc.
Despite impressive profitability and value creation, Globe Life’s profile remains highly speculative due to its distressed financial condition. The Altman Z-Score’s distress zone classification demands caution, making the company too risky for conservative capital. Operational strengths may appear promising, but solvency risks dominate the investment thesis, suggesting that risk-averse investors should seek more stable alternatives.
Disclaimer: This content is for informational purposes only and does not constitute financial, investment, or other professional advice. Investing in financial markets involves a significant risk of loss, and past performance is not indicative of future results.
Additional Resources
- Decoding Globe Life Inc (GL): A Strategic SWOT Insight – GuruFocus (Feb 26, 2026)
- GLOBE LIFE INC. SEC 10-K Report – TradingView (Feb 25, 2026)
- Wells Fargo & Company Increases Globe Life (NYSE:GL) Price Target to $171.00 – MarketBeat (Feb 25, 2026)
- Q4 Rundown: Globe Life (NYSE:GL) Vs Other Life Insurance Stocks – Yahoo Finance (Feb 23, 2026)
- GLOBE LIFE INC. REPORTS FOURTH QUARTER 2025 RESULTS – PR Newswire (Feb 04, 2026)
For more information about Globe Life Inc., please visit the official website: globelifeinsurance.com