Home > Analyses > Technology > GLOBALFOUNDRIES Inc.
GLOBALFOUNDRIES powers the invisible engines behind modern life, crafting the semiconductors that drive smartphones, networks, and countless smart devices. As a top-tier foundry, it combines cutting-edge fabrication with a broad portfolio spanning microprocessors to power management units. Its reputation for innovation and scale sets a high bar in the semiconductor industry. Yet, as market dynamics shift rapidly, the key question remains: does GLOBALFOUNDRIES’ financial strength justify its current valuation and growth prospects?
Table of contents
Business Model & Company Overview
GLOBALFOUNDRIES Inc., founded in 2009 and headquartered in Malta, New York, stands as a dominant player in the semiconductor foundry industry. It delivers a cohesive ecosystem of integrated circuits, powering a wide spectrum of electronic devices—from microprocessors to power management units. This comprehensive portfolio supports the backbone of modern electronics worldwide.
The company’s revenue engine balances wafer fabrication services with cutting-edge semiconductor manufacturing. GLOBALFOUNDRIES serves diverse global markets across the Americas, Europe, and Asia, leveraging its scale and technological capabilities. Its competitive advantage lies in advanced manufacturing processes, securing a robust economic moat that shapes the future of semiconductor production.
Financial Performance & Fundamental Metrics
I analyze GLOBALFOUNDRIES Inc.’s income statement, key financial ratios, and dividend payout policy to assess its core financial health and shareholder value.
Income Statement
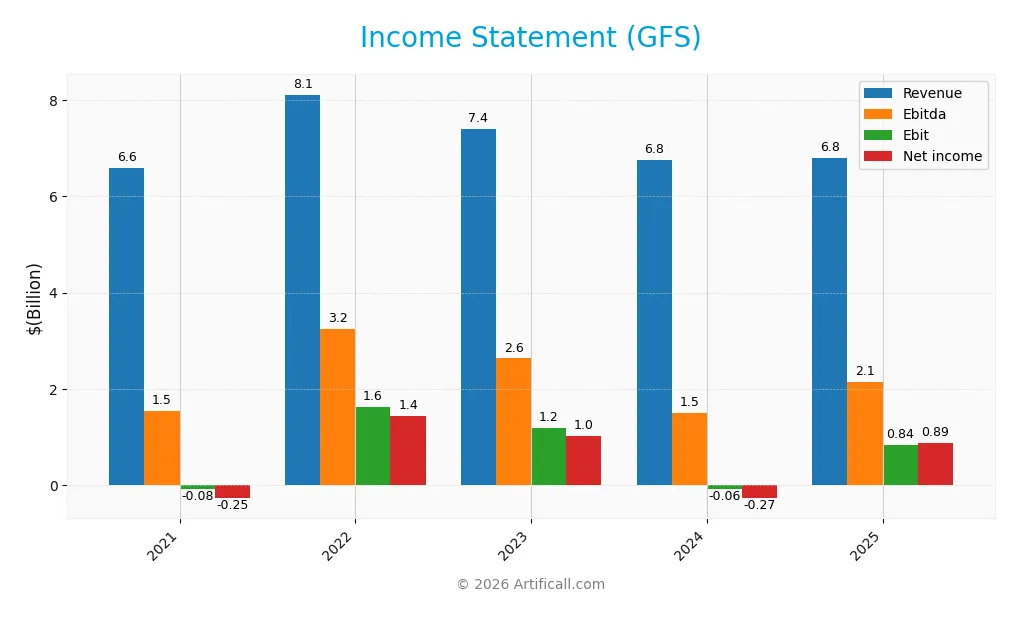
The table below presents GLOBALFOUNDRIES Inc.’s key income statement figures for fiscal years 2021 through 2025 in USD.
| 2021 | 2022 | 2023 | 2024 | 2025 | |
|---|---|---|---|---|---|
| Revenue | 6.59B | 8.11B | 7.39B | 6.75B | 6.79B |
| Cost of Revenue | 5.57B | 5.87B | 5.29B | 5.10B | 5.08B |
| Operating Expenses | 1.07B | 1.07B | 972M | 1.87B | 913M |
| Gross Profit | 1.01B | 2.24B | 2.10B | 1.65B | 1.71B |
| EBITDA | 1.54B | 3.25B | 2.64B | 1.50B | 2.15B |
| EBIT | -77M | 1.62B | 1.19B | -64M | 836M |
| Interest Expense | 114M | 117M | 137M | 145M | 0 |
| Net Income | -250M | 1.45B | 1.02B | -265M | 885M |
| EPS | -0.49 | 2.69 | 1.85 | -0.48 | 1.59 |
| Filing Date | 2022-03-31 | 2023-04-14 | 2024-04-29 | 2025-03-20 | 2026-02-27 |
Income Statement Evolution
From 2021 to 2025, GLOBALFOUNDRIES’ revenue showed moderate overall growth of 3.13%. Net income surged 454%, reflecting a strong recovery from losses in 2021 and 2024. Gross margins remained stable near 25%, while EBIT and net margins improved significantly, indicating enhanced operational efficiency and profitability across the period.
Is the Income Statement Favorable?
The 2025 income statement reveals fundamentally favorable results. Revenue rose slightly by 0.6%, while net income rebounded strongly to $885M, driving a 13% net margin. EBIT margin expanded to 12.3%, supported by zero interest expenses. Operating expenses grew modestly, showing disciplined cost control. Overall, profitability metrics and margin expansion underline solid financial health.
Financial Ratios
The following table presents key financial ratios for GLOBALFOUNDRIES Inc. (GFS) from 2021 through 2025, illustrating profitability, liquidity, leverage, and valuation metrics:
| Ratios | 2021 | 2022 | 2023 | 2024 | 2025 |
|---|---|---|---|---|---|
| Net Margin | -4% | 18% | 14% | -4% | 13% |
| ROE | -3.1% | 14.6% | 9.2% | -2.5% | 7.4% |
| ROIC | -0.5% | 7.5% | 6.8% | -1.5% | 5.2% |
| P/E | -131.4 | 20.1 | 32.8 | -89.5 | 22.0 |
| P/B | 4.12 | 2.93 | 3.01 | 2.20 | 1.63 |
| Current Ratio | 1.67 | 1.73 | 2.04 | 2.11 | 2.62 |
| Quick Ratio | 1.32 | 1.33 | 1.56 | 1.57 | 1.95 |
| D/E | 0.31 | 0.29 | 0.25 | 0.22 | 0.14 |
| Debt-to-Assets | 16.2% | 16.0% | 15.3% | 13.8% | 9.6% |
| Interest Coverage | -0.53 | 9.97 | 8.24 | -1.48 | 0 |
| Asset Turnover | 0.44 | 0.45 | 0.41 | 0.40 | 0.40 |
| Fixed Asset Turnover | 0.76 | 0.77 | 0.73 | 0.82 | 0.87 |
| Dividend Yield | 0% | 0% | 0% | 0% | 0% |
Evolution of Financial Ratios
From 2021 to 2025, GLOBALFOUNDRIES Inc. saw fluctuating profitability with net margins recovering from negative to 13.03%. Return on Equity (ROE) remained volatile, ending at 7.42%, below the cost of capital. The current ratio steadily improved to 2.62, indicating stronger liquidity. Debt-to-equity ratio declined, signaling reduced financial leverage.
Are the Financial Ratios Favorable?
In 2025, profitability showed mixed signals: net margin was favorable, but ROE lagged behind the 10.16% WACC, indicating weak capital efficiency. Liquidity ratios were solid, with current and quick ratios above 1.9. Debt levels remained low and favorable. However, asset turnover and dividend yield were unfavorable. Overall, 43% of ratios were favorable, suggesting a slightly favorable financial position.
Shareholder Return Policy
GLOBALFOUNDRIES Inc. (GFS) does not pay dividends, reflecting a strategic choice to reinvest earnings. The company focuses on growth and capital expenditure, supported by positive free cash flow and no dividend payout ratio.
GFS also does not engage in share buybacks, prioritizing reinvestment over immediate shareholder returns. This approach aligns with long-term value creation, given its stable profitability and reinvestment capacity, but investors should monitor execution risks.
Score analysis
The following radar chart illustrates GLOBALFOUNDRIES Inc.’s key financial scores across valuation and profitability metrics:
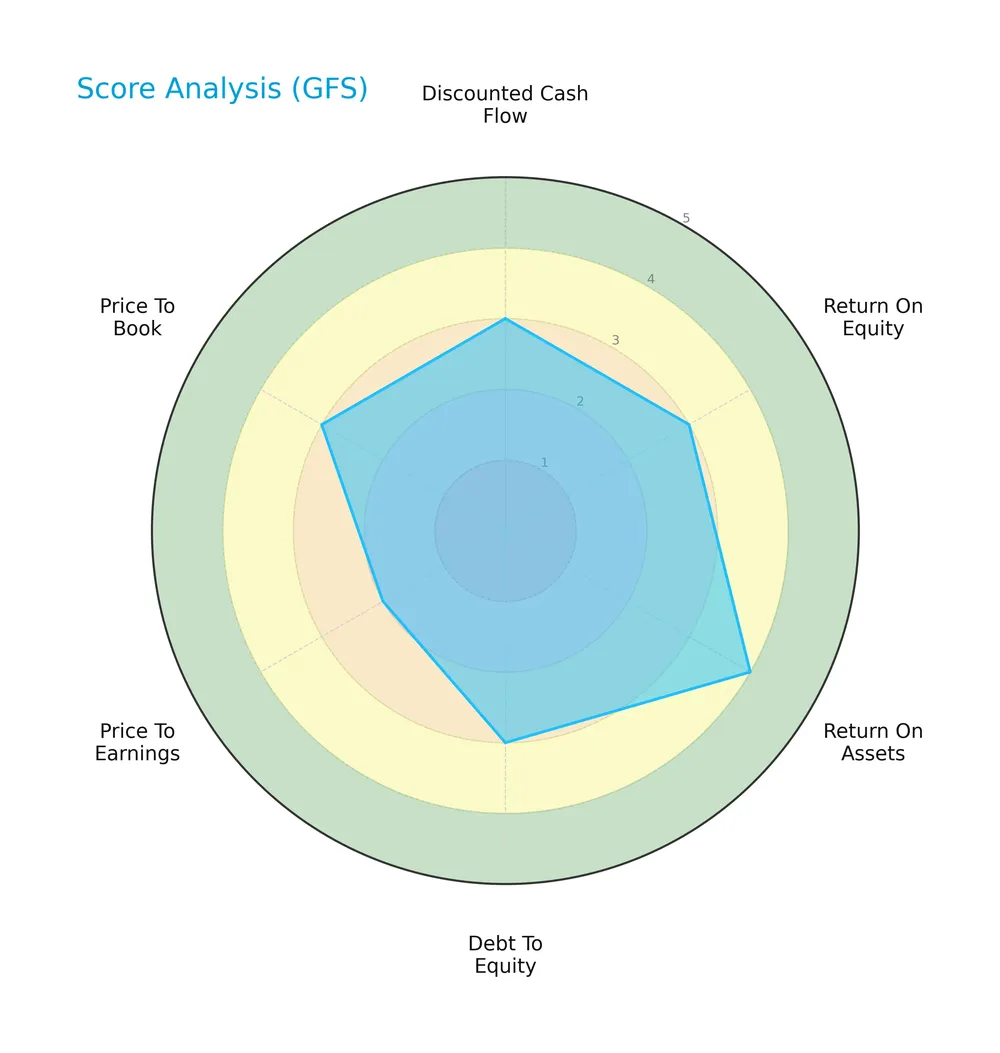
The company scores moderately on discounted cash flow, return on equity, debt to equity, and price to book. Return on assets stands out favorably, while price to earnings remains unfavorable, indicating mixed valuation signals.
Analysis of the company’s bankruptcy risk
GLOBALFOUNDRIES Inc. falls into the Altman Z-Score grey zone, indicating a moderate risk of bankruptcy that warrants close monitoring:

Is the company in good financial health?
The Piotroski Score diagram highlights the company’s financial strength based on profitability, leverage, and efficiency metrics:
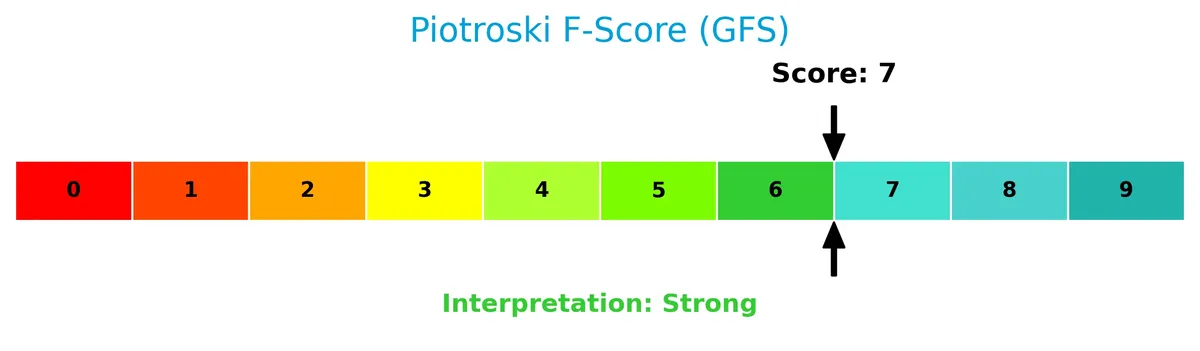
With a strong score of 7, GLOBALFOUNDRIES shows solid financial health, suggesting resilience despite some valuation challenges.
Competitive Landscape & Sector Positioning
This sector analysis will explore GLOBALFOUNDRIES Inc.’s strategic positioning, revenue streams, key products, and main competitors. I will evaluate whether the company holds a competitive advantage within the semiconductors industry.
Strategic Positioning
GLOBALFOUNDRIES concentrates on semiconductor wafer fabrication, generating over 6B in fabrication revenue annually. It complements this with under 1B in engineering services. Geographically, it balances exposure across the US (3.4B in 2025), EMEA (1.7B), and other regions (1.7B), showing moderate international diversification.
Revenue by Segment
This pie chart illustrates GLOBALFOUNDRIES Inc.’s revenue distribution by product segment for the fiscal year 2025, highlighting the contribution of key business lines.
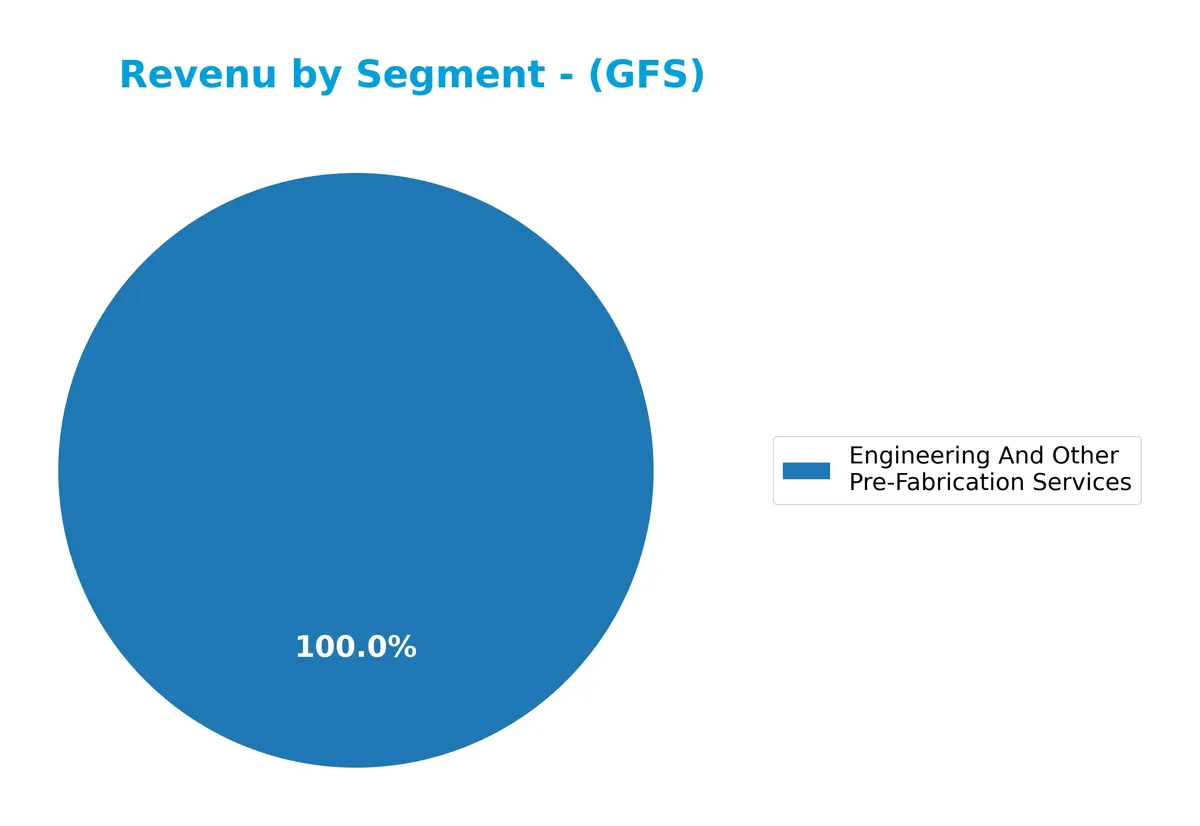
Water Fabrication dominated GLOBALFOUNDRIES’ revenue from 2021 to 2024, peaking at 7.63B in 2022 before declining to 6.10B in 2024. Engineering and Other Pre-Fabrication Services showed steady growth, reaching 769M in 2025 despite Water Fabrication’s absence that year. The 2025 data suggests a possible strategic shift or reporting change, emphasizing diversification risks and the need to monitor segment dynamics closely.
Key Products & Brands
GLOBALFOUNDRIES’ key offerings and related services include the following:
| Product | Description |
|---|---|
| Wafer Fabrication | Mainstream semiconductor wafer fabrication services, producing integrated circuits for various electronics. |
| Engineering And Other Pre-Fabrication Services | Engineering support and other preparatory services related to semiconductor manufacturing processes. |
GLOBALFOUNDRIES primarily generates revenue from wafer fabrication, supplemented by engineering and related pre-fabrication services. This combination supports a broad semiconductor foundry business essential to multiple electronic device markets.
Main Competitors
There are 38 competitors in the semiconductor industry; below is a table of the top 10 leaders by market capitalization:
| Competitor | Market Cap. |
|---|---|
| NVIDIA Corporation | 4.6T |
| Broadcom Inc. | 1.6T |
| Taiwan Semiconductor Manufacturing Company Limited | 1.6T |
| ASML Holding N.V. | 415B |
| Advanced Micro Devices, Inc. | 363B |
| Micron Technology, Inc. | 353B |
| Lam Research Corporation | 232B |
| Applied Materials, Inc. | 214B |
| QUALCOMM Incorporated | 185B |
| Intel Corporation | 173B |
GLOBALFOUNDRIES Inc. ranks 23rd among 38 competitors, with a market cap just 0.6% of the leader’s size. It sits below both the average market cap of the top 10 (975B) and the sector median (31B). The company is about 16.5% smaller than its closest competitor above, highlighting a moderate gap at its current scale.
Comparisons with competitors
Check out how we compare the company to its competitors:
Does GLOBALFOUNDRIES Inc. have a competitive advantage?
GLOBALFOUNDRIES currently lacks a clear competitive advantage, as its ROIC falls below WACC, indicating value destruction despite growing profitability. Its semiconductor manufacturing delivers favorable margins but faces challenges in sustaining economic profits.
Looking ahead, the company targets expanding wafer fabrication technologies and semiconductor device offerings across global markets. Growth opportunities arise from demand in Europe, the Middle East, and other regions beyond a sizable U.S. base.
SWOT Analysis
This analysis highlights GLOBALFOUNDRIES Inc.’s core competitive position and challenges to guide strategic decisions.
Strengths
- strong net margin at 13%
- low debt-to-assets at 9.6%
- robust liquidity with current ratio 2.62
Weaknesses
- ROIC below WACC, indicating value destruction
- unfavorable revenue growth recently
- weak asset turnover ratios
Opportunities
- expanding demand in Europe and EMEA markets
- growing microprocessor and mobile processor segments
- improving ROIC trend signals operational gains
Threats
- intense competition in semiconductor foundry
- geopolitical risks impacting supply chain
- rapid tech changes requiring heavy capex
GLOBALFOUNDRIES shows solid profitability and financial stability but struggles to generate returns above capital costs. The company must leverage growth in emerging markets and technology while managing competitive and geopolitical risks carefully.
Stock Price Action Analysis
The weekly stock chart below illustrates GLOBALFOUNDRIES Inc.’s price movements over the past 12 months, highlighting key support and resistance levels:
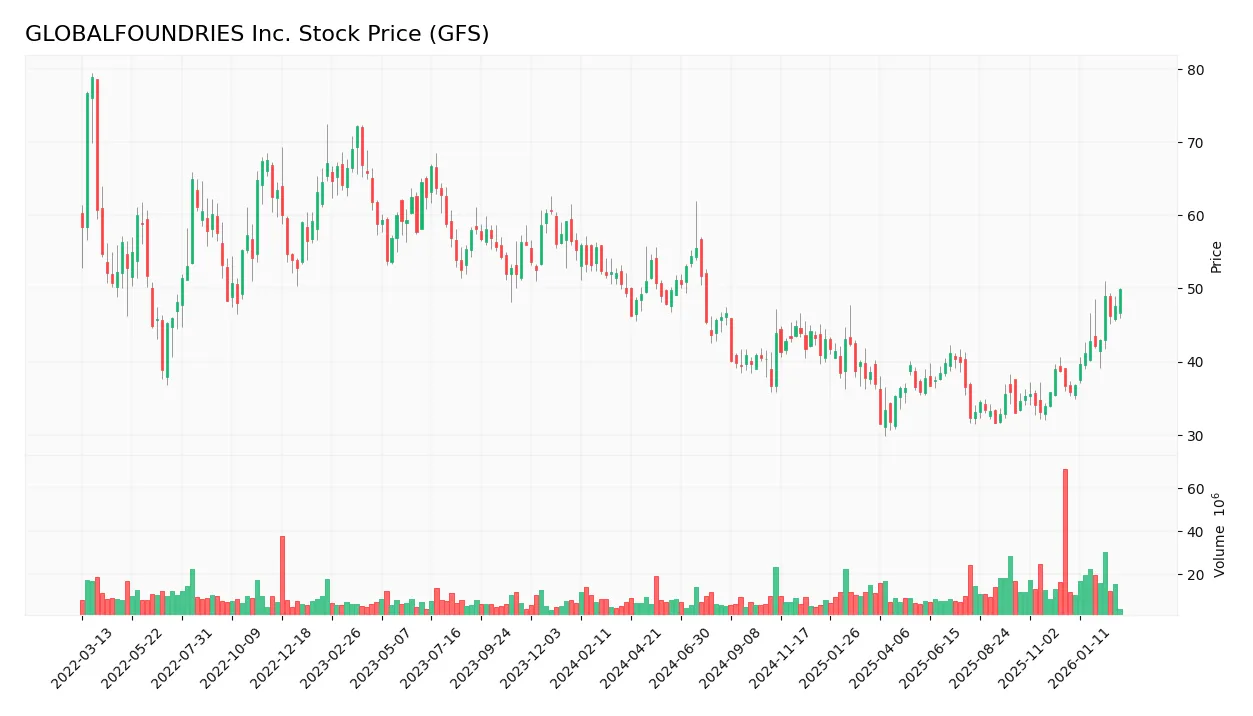
Trend Analysis
Over the past 12 months, GFS’s stock price rose by 0.99%, indicating a bullish trend with price acceleration. The stock reached a high of 55.5 and a low of 31.54. Volatility, measured by a 5.88 standard deviation, remains moderate, suggesting steady upward momentum.
Volume Analysis
Trading volume increased over the last three months, with buyer volume at 133M versus seller volume at 112M, reflecting a slightly buyer-dominant market. This rising volume trend signals growing investor interest and cautious optimism in the stock’s near-term prospects.
Target Prices
Analysts set a clear target consensus for GLOBALFOUNDRIES Inc. (GFS).
| Target Low | Target High | Consensus |
|---|---|---|
| 46 | 60 | 51.14 |
The price targets suggest moderate upside potential, reflecting cautious optimism amid industry volatility.

Don’t Let Luck Decide Your Entry Point
Optimize your entry points with our advanced ProRealTime indicators. You’ll get efficient buy signals with precise price targets for maximum performance. Start outperforming now!
Analyst & Consumer Opinions
This section examines the latest grades and consumer feedback related to GLOBALFOUNDRIES Inc. (GFS).
Stock Grades
Here are the latest verified grades for GLOBALFOUNDRIES Inc. from major financial institutions:
| Grading Company | Action | New Grade | Date |
|---|---|---|---|
| Goldman Sachs | Maintain | Neutral | 2026-02-12 |
| Wedbush | Maintain | Neutral | 2026-02-12 |
| Baird | Maintain | Outperform | 2026-02-12 |
| Citigroup | Maintain | Neutral | 2026-02-12 |
| Needham | Maintain | Buy | 2026-02-12 |
| Citigroup | Maintain | Neutral | 2026-01-15 |
| Wedbush | Downgrade | Neutral | 2025-12-31 |
| B of A Securities | Maintain | Underperform | 2025-12-04 |
| JP Morgan | Maintain | Neutral | 2025-11-13 |
| Evercore ISI Group | Maintain | Outperform | 2025-11-13 |
The consensus shows a balance between Neutral and Buy ratings, with a slight tilt toward caution amid some downgrades. Outperform ratings persist but are less frequent, indicating mixed but generally stable sentiment.
Consumer Opinions
GLOBALFOUNDRIES sparks mixed reactions from consumers, reflecting its complex position in the semiconductor industry.
| Positive Reviews | Negative Reviews |
|---|---|
| High-quality chip manufacturing meeting specs | Supply chain delays impacting deliveries |
| Strong innovation pipeline in advanced nodes | Customer service response times lagging |
| Competitive pricing compared to peers | Occasional yield issues reported |
Consumers praise GLOBALFOUNDRIES for technical excellence and pricing. However, persistent supply chain and service challenges temper overall satisfaction.
Risk Analysis
Below is a summary table of key risks facing GLOBALFOUNDRIES Inc. in 2026:
| Category | Description | Probability | Impact |
|---|---|---|---|
| Financial Health | Altman Z-Score in grey zone indicates moderate bankruptcy risk. | Moderate | High |
| Profitability | ROE (7.42%) below WACC (10.16%) signals value destruction. | High | High |
| Market Volatility | Beta of 1.47 increases stock price sensitivity to market swings. | High | Moderate |
| Operational | Low asset turnover (0.4) suggests underutilized assets. | Moderate | Moderate |
| Dividend Policy | No dividend yield limits income appeal to income-focused investors. | High | Low |
The company’s Altman Z-Score of 2.89 places it in the grey zone, signaling moderate financial distress risk. The most pressing concern is the ROE lagging behind WACC, indicating capital is not generating sufficient returns. This structural profitability weakness could pressure the stock in economic downturns. Meanwhile, a high beta exposes investors to amplified market fluctuations. Operational inefficiencies and lack of dividends add further cautionary notes for risk-conscious investors.
Should You Buy GLOBALFOUNDRIES Inc.?
GLOBALFOUNDRIES appears to have improving profitability with growing ROIC, yet it still sheds value relative to WACC, suggesting a slightly unfavorable competitive moat. Its leverage profile seems manageable, supporting a very favorable B+ overall rating.
Strength & Efficiency Pillars
GLOBALFOUNDRIES Inc. delivers solid operational profitability with a net margin of 13.03% and an EBIT margin of 12.31%. The company’s ROIC stands at 5.23%, showing growth, but it remains below its WACC of 10.16%, indicating the firm is not yet a value creator. Despite this, a strong Piotroski score of 7 underscores financial strength. Its low debt-to-equity ratio (0.14) and robust liquidity ratios (current ratio 2.62, quick ratio 1.95) reflect efficient capital management and operational stability.
Weaknesses and Drawbacks
GLOBALFOUNDRIES is in the Altman Z-Score grey zone with a value of 2.89, signaling moderate bankruptcy risk. The company’s ROE is low at 7.42%, which may disappoint investors seeking high returns. Valuation metrics remain neutral, with a P/E of 21.96 and a P/B of 1.63, suggesting fair market pricing but limited upside. Asset turnover ratios are weak (0.40), indicating less efficient asset use. The lack of dividend yield also limits income appeal, and moderate seller volume in recent periods tempers short-term momentum.
Our Final Verdict about GLOBALFOUNDRIES Inc.
GLOBALFOUNDRIES exhibits a fundamentally stable profile with improving profitability and controlled leverage. However, the Altman Z-Score in the grey zone advises caution due to moderate solvency risk. Despite a bullish stock trend and slight buyer dominance recently, the valuation and operational efficiency challenges suggest the stock may appear suitable for patient investors who can tolerate some risk. A wait-and-see approach might be prudent before committing significant capital.
Disclaimer: This content is for informational purposes only and does not constitute financial, investment, or other professional advice. Investing in financial markets involves a significant risk of loss, and past performance is not indicative of future results.
Additional Resources
- Rafferty Asset Management LLC Increases Stock Holdings in GlobalFoundries Inc. $GFS – MarketBeat (Mar 02, 2026)
- How Do Investors Really Feel About GLOBALFOUNDRIES Inc? – Benzinga (Mar 02, 2026)
- GLOBALFOUNDRIES (GFS) Price Target Increased by 24.81% to 51.74 – Nasdaq (Feb 25, 2026)
- GlobalFoundries to Acquire MIPS to Accelerate AI and Compute Capabilities – GlobalFoundries (Jul 08, 2025)
- GFS PE Ratio & Valuation, Is GFS Overvalued – Intellectia AI (Mar 02, 2026)
For more information about GLOBALFOUNDRIES Inc., please visit the official website: globalfoundries.com