Home > Analyses > Industrials > Global Payments Inc.
Global Payments Inc. powers billions of daily transactions, connecting consumers and businesses worldwide with seamless payment technology. As a dominant force in specialty business services, it leads through innovative platforms spanning merchant processing, issuer solutions, and consumer financial products. Its reputation for reliability and cutting-edge software fuels strong industry influence. The key question now: does Global Payments’ current financial strength and market position justify its valuation and promise sustainable growth in a rapidly evolving payments landscape?

Table of contents
Business Model & Company Overview
Global Payments Inc., founded in 1967 and based in Atlanta, dominates the specialty business services industry. Its core business integrates payment technology and software solutions, spanning card, electronic, check, and digital payments. The company operates through three synergistic segments—Merchant, Issuer, and Business & Consumer Solutions—forming a seamless ecosystem that supports a wide range of vertical markets worldwide.
The company’s revenue engine balances transaction-based fees from Merchant Solutions with recurring software licenses and value-added services. Its strategic footprint covers the Americas, Europe, and Asia-Pacific, ensuring global reach. This multi-segment approach cultivates a robust competitive advantage, positioning Global Payments as a pivotal force shaping the future of payment technologies.
Financial Performance & Fundamental Metrics
I will analyze Global Payments Inc.’s income statement, key financial ratios, and dividend payout policy to assess its core financial health and shareholder value.
Income Statement
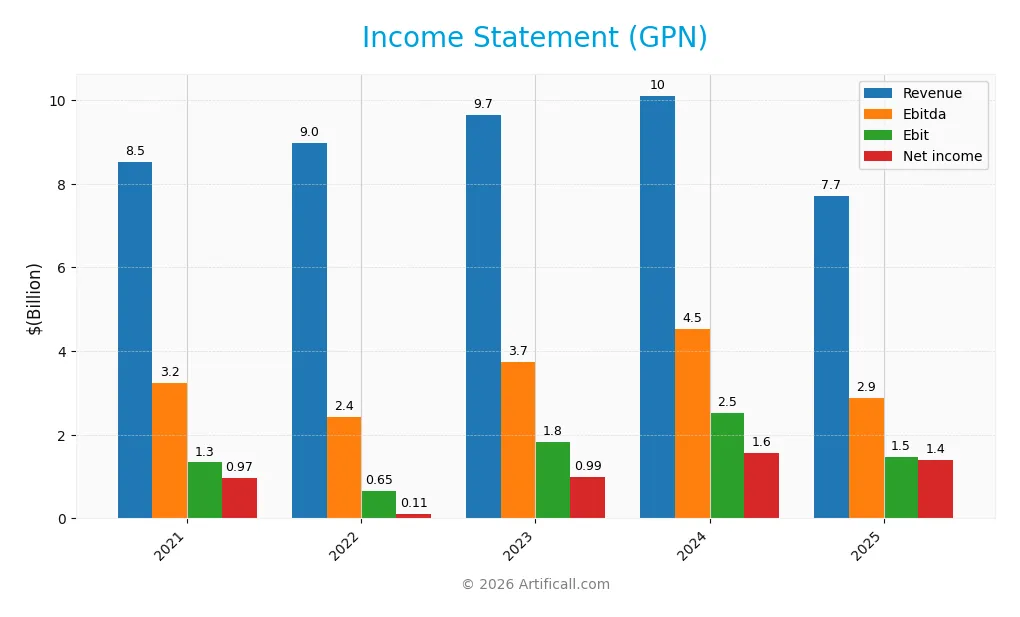
The table below presents Global Payments Inc.’s income statement highlights for fiscal years 2021 through 2025, reflecting key profitability metrics and earnings per share.
| 2021 | 2022 | 2023 | 2024 | 2025 | |
|---|---|---|---|---|---|
| Revenue | 8.52B | 8.98B | 9.65B | 10.11B | 7.71B |
| Cost of Revenue | 3.77B | 3.78B | 3.73B | 3.76B | 2.11B |
| Operating Expenses | 2.99B | 3.22B | 3.71B | 4.06B | 4.12B |
| Gross Profit | 4.75B | 5.20B | 5.93B | 6.35B | 5.59B |
| EBITDA | 3.23B | 2.43B | 3.74B | 4.52B | 2.89B |
| EBIT | 1.34B | 0.65B | 1.83B | 2.51B | 1.47B |
| Interest Expense | 334M | 449M | 660M | 634M | 650M |
| Net Income | 965M | 111M | 986M | 1.57B | 1.40B |
| EPS | 3.30 | 0.41 | 3.78 | 6.18 | 5.84 |
| Filing Date | 2022-02-18 | 2023-02-17 | 2024-02-14 | 2025-02-14 | 2026-02-20 |
Income Statement Evolution
Global Payments Inc. experienced a revenue decline of 23.75% from 2024 to 2025, continuing a downward trend over five years. Despite this, net income rose 45% overall, driven by a 60% improvement in net margin. Gross profit and operating expenses both fell, contributing to a 41% drop in EBIT, signaling margin pressures but sustained profitability.
Is the Income Statement Favorable?
In 2025, GPN’s fundamentals show mixed signals. The 72.6% gross margin and 19.1% EBIT margin remain strong, supporting an 18.2% net margin. Interest expense at 8.4% of revenue is neutral, reflecting manageable debt costs. However, the sharp revenue and EBIT contractions caution against complacency. Overall, the income statement presents a favorable but cautious outlook.
Financial Ratios
The following table summarizes key financial ratios for Global Payments Inc. (GPN) across the fiscal years 2021 to 2025:
| Ratios | 2021 | 2022 | 2023 | 2024 | 2025 |
|---|---|---|---|---|---|
| Net Margin | 11.3% | 1.2% | 10.2% | 15.5% | 18.2% |
| ROE | 3.8% | 0.5% | 4.3% | 7.0% | 6.1% |
| ROIC | 3.6% | 2.3% | 4.2% | 4.6% | 2.5% |
| P/E | 41.0 | 245.1 | 33.6 | 18.1 | 13.3 |
| P/B | 1.54 | 1.23 | 1.44 | 1.28 | 0.81 |
| Current Ratio | 1.06 | 0.92 | 0.99 | 0.97 | 1.69 |
| Quick Ratio | 1.06 | 0.92 | 0.99 | 0.97 | 1.69 |
| D/E | 0.47 | 0.64 | 0.76 | 0.75 | 0.95 |
| Debt-to-Assets | 26.7% | 31.9% | 34.4% | 35.9% | 40.9% |
| Interest Coverage | 5.3x | 4.4x | 3.4x | 3.6x | 2.3x |
| Asset Turnover | 0.19 | 0.20 | 0.19 | 0.22 | 0.14 |
| Fixed Asset Turnover | 5.05 | 4.88 | 4.41 | 4.44 | 5.13 |
| Dividend Yield | 0.66% | 1.00% | 0.79% | 0.89% | 1.29% |
Evolution of Financial Ratios
From 2021 to 2025, Global Payments Inc.’s Return on Equity (ROE) fluctuated, peaking in 2024 before declining to 6.12% in 2025. The Current Ratio improved notably in 2025, reaching 1.69, signaling enhanced liquidity. Debt-to-Equity Ratio increased modestly, stabilizing near 0.95 in 2025. Profitability showed mixed trends, with net margins rising to 18.17% in 2025 after earlier volatility.
Are the Financial Ratios Favorable?
In 2025, profitability ratios like net margin (18.17%) and price-to-earnings ratio (13.26) are favorable, reflecting solid earnings quality. Liquidity is strong, with current and quick ratios at 1.69. Leverage ratios, including debt-to-equity (0.95) and interest coverage (2.27), remain neutral, indicating balanced risk. Asset turnover is unfavorable at 0.14, limiting operational efficiency. Overall, the financial ratios are slightly favorable, with half rated positively.
Shareholder Return Policy
Global Payments Inc. maintains a consistent dividend payout ratio around 16-27%, with a stable dividend per share near $0.99 and a modest yield near 1.3%. The payout is well covered by free cash flow, supporting balanced distributions alongside capital expenditures.
The company also engages in share buybacks, complementing dividends to return capital. This dual approach indicates a disciplined capital allocation strategy aimed at sustainable long-term shareholder value creation without overextending cash resources.
Score analysis
The following radar chart illustrates Global Payments Inc.’s key financial scores across multiple valuation and profitability metrics:
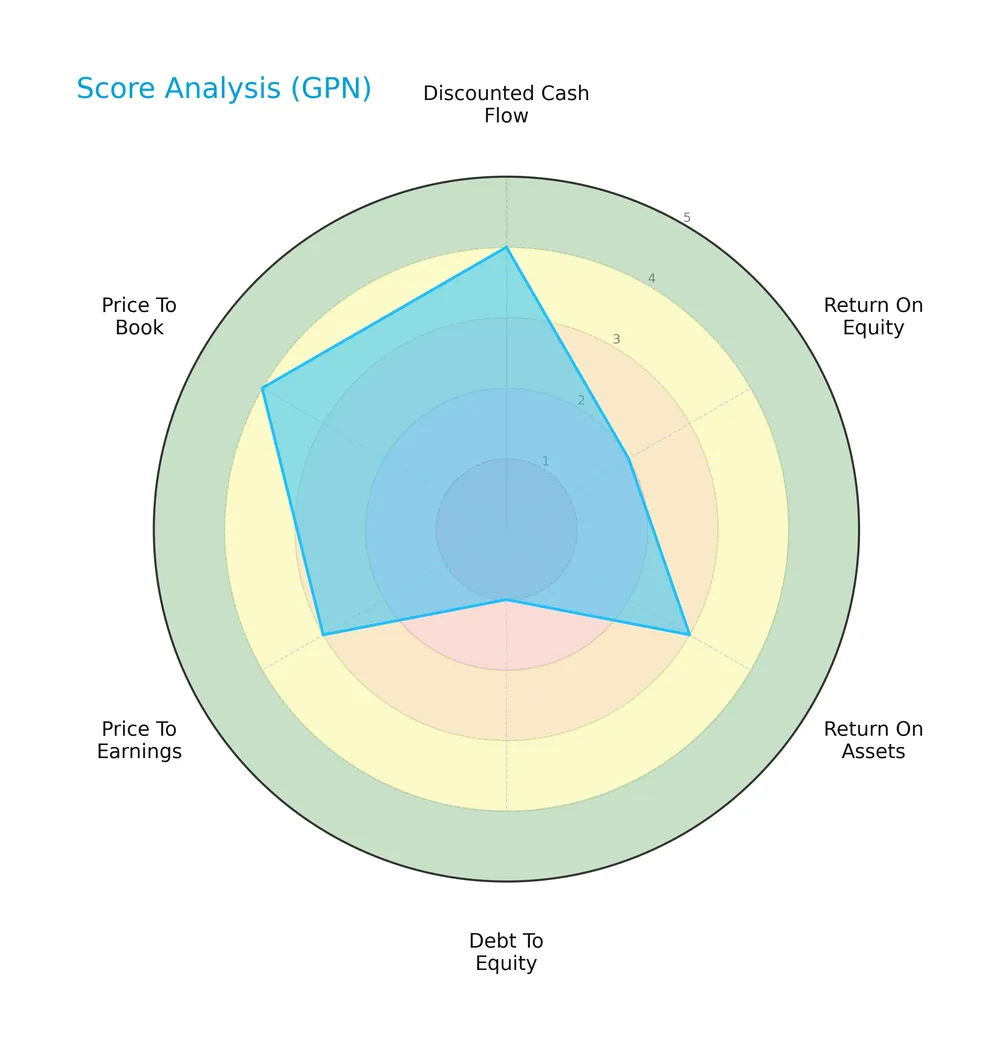
The company scores favorably in discounted cash flow (4) and price to book (4), but shows weakness in debt to equity (1) and return on equity (2). Other metrics including return on assets (3) and price to earnings (3) reflect moderate performance.
Analysis of the company’s bankruptcy risk
Global Payments Inc. currently falls in the distress zone with an Altman Z-Score below 1.8, indicating a significant risk of financial distress and potential bankruptcy:

Is the company in good financial health?
The Piotroski Score diagram below highlights the company’s financial strength based on nine specific accounting criteria:

With a Piotroski Score of 7, Global Payments Inc. demonstrates strong financial health, suggesting robust profitability, leverage, and liquidity metrics despite some risks evidenced elsewhere.
Competitive Landscape & Sector Positioning
This analysis explores Global Payments Inc.’s strategic positioning, revenue segments, key products, and main competitors. I will assess whether Global Payments holds a competitive advantage within its specialty business services sector.
Strategic Positioning
Global Payments Inc. maintains a diversified product portfolio across Merchant, Issuer, and Business & Consumer Solutions segments. Geographically, it has a strong North American presence, supplemented by growing operations in Europe and Asia-Pacific, reflecting a balanced yet Americas-focused international footprint.
Revenue by Segment
This pie chart illustrates Global Payments Inc.’s revenue distribution by business segment for the fiscal year 2025, highlighting the relative contributions of each segment.
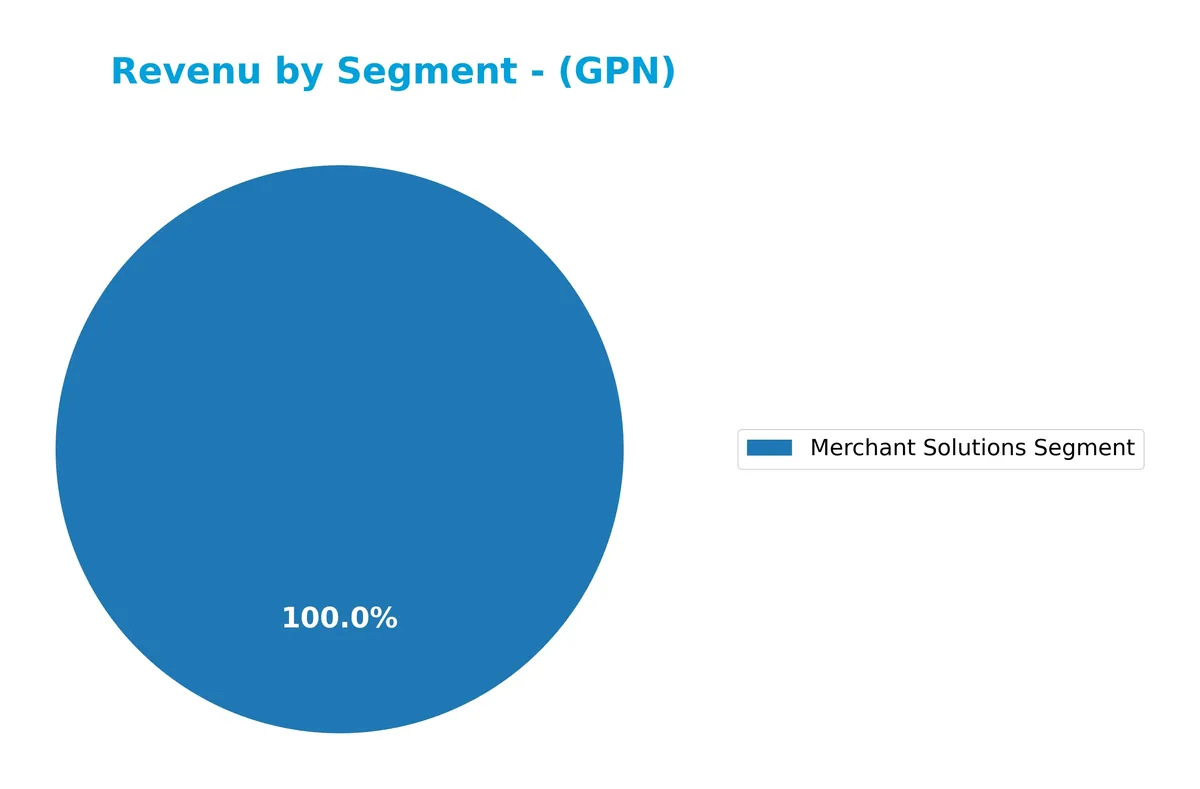
Merchant Solutions Segment dominates with $7.7B in revenue for 2025, continuing its steady growth from $7.15B in 2023. Issuer Solutions, last reported in 2024 at $2.48B, remains a significant secondary contributor. Business and Consumer Solutions revenue has diminished, absent from 2025 figures, signaling a strategic focus on core segments. The concentration risk leans heavily on Merchant Solutions, which drives the company’s top line.
Key Products & Brands
The following table outlines Global Payments Inc.’s main products and brands across its operating segments:
| Product | Description |
|---|---|
| Merchant Solutions Segment | Offers payment authorization, settlement, funding, customer support, chargeback resolution, terminal rental, and payment security services. Includes enterprise software and value-added services like point-of-sale solutions, analytics, payroll, and human capital management. |
| Issuer Solutions Segment | Provides platforms for financial institutions and retailers to manage card portfolios, commercial payments, and ePayables solutions for businesses and governments. |
| Business and Consumer Solutions Segment | Supplies general-purpose reloadable prepaid debit and payroll cards, demand deposit accounts, and financial services targeting underbanked consumers and businesses, marketed under the Netspend brand. |
Global Payments Inc. delivers diversified payment technology and software solutions through three distinct segments. Merchant Solutions remains the largest revenue contributor, supported by Issuer and Business and Consumer Solutions targeting different client needs.
Main Competitors
There are 3 main competitors in the Industrials sector, with the table listing the top 3 leaders by market capitalization:
| Competitor | Market Cap. |
|---|---|
| Cintas Corporation | 74.5B |
| Thomson Reuters Corporation | 59.4B |
| Global Payments Inc. | 18.5B |
Global Payments Inc. ranks 3rd among its competitors, with a market cap at 26.2% of the leader, Cintas Corporation. It sits below both the average market cap of the top 10 competitors (50.8B) and the sector median (59.4B). The company is 204.18% smaller than its nearest rival, Thomson Reuters Corporation, highlighting a significant scale gap.
Comparisons with competitors
Check out how we compare the company to its competitors:
Does GPN have a competitive advantage?
Global Payments Inc. currently does not present a competitive advantage. Its return on invested capital (ROIC) falls below its weighted average cost of capital (WACC), indicating value destruction and declining profitability.
Looking ahead, the company operates across multiple segments and regions, offering payment technology and software solutions. Opportunities may arise from new products and expanding markets in the Americas, Europe, and Asia-Pacific.
SWOT Analysis
This SWOT analysis highlights Global Payments Inc.’s key internal and external factors to inform strategic decisions.
Strengths
- strong gross margin at 72.6%
- favorable net margin at 18.2%
- diversified payment technology portfolio
Weaknesses
- declining revenue growth -23.8% over 1 year
- ROIC below WACC indicating value destruction
- moderate financial distress risk (Altman Z-score 0.95)
Opportunities
- expanding digital payment adoption globally
- growth potential in underbanked markets
- cross-selling enterprise software solutions
Threats
- intense competition in payment processing
- regulatory changes in financial services
- economic slowdown reducing transaction volumes
Global Payments shows solid profitability but faces growth and value creation challenges. The strategy must focus on reversing declining returns and capitalizing on digital payment trends while managing competitive and regulatory risks.
Stock Price Action Analysis
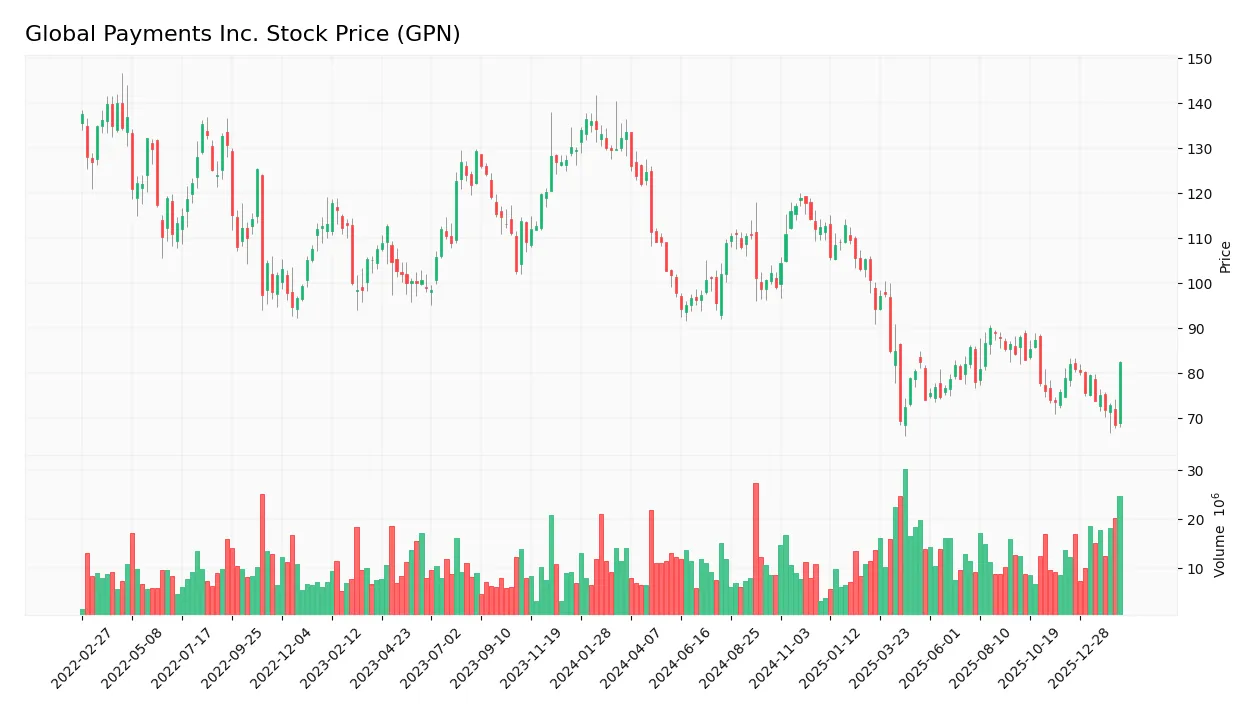
The upcoming weekly chart captures Global Payments Inc. stock price movements over the past 12 months, highlighting significant volatility and trend shifts:
Trend Analysis
Over the past 12 months, GPN’s stock price fell by 38.3%, indicating a clear bearish trend. The price decelerated after reaching a high of 133.66 and a low of 68.48, with volatility reflected by a 15.65 standard deviation. Recent months show a 4.59% gain but with a negative slope, signaling a subtle pullback within the broader downtrend.
Volume Analysis
Trading volumes over the last three months show a slightly buyer-dominant pattern, with buyer volume at 105M versus seller volume at 82M. Total volume is increasing, reflecting growing market participation and cautious investor optimism despite the overall bearish context.
Target Prices
Analysts project a target price consensus for Global Payments Inc. (GPN) reflecting moderate upside potential.
| Target Low | Target High | Consensus |
|---|---|---|
| 80 | 109 | 93.25 |
The target range suggests cautious optimism, with analysts expecting the stock to trade between $80 and $109, centering near $93.25.

Don’t Let Luck Decide Your Entry Point
Optimize your entry points with our advanced ProRealTime indicators. You’ll get efficient buy signals with precise price targets for maximum performance. Start outperforming now!
Analyst & Consumer Opinions
This section examines analyst ratings and consumer feedback to provide a balanced view of Global Payments Inc. (GPN).
Stock Grades
Below is the latest consensus of stock grades for Global Payments Inc. from reputable financial firms:
| Grading Company | Action | New Grade | Date |
|---|---|---|---|
| RBC Capital | Maintain | Sector Perform | 2026-02-19 |
| Keefe, Bruyette & Woods | Maintain | Market Perform | 2026-02-19 |
| Wells Fargo | Maintain | Overweight | 2026-02-19 |
| UBS | Maintain | Neutral | 2026-02-19 |
| JP Morgan | Maintain | Neutral | 2026-02-12 |
| Seaport Global | Upgrade | Buy | 2026-01-14 |
| Truist Securities | Maintain | Hold | 2025-11-13 |
| RBC Capital | Maintain | Sector Perform | 2025-11-05 |
| TD Cowen | Maintain | Hold | 2025-11-05 |
| Keybanc | Downgrade | Sector Weight | 2025-10-22 |
The majority of firms maintain a neutral or hold stance, with a recent upgrade to buy from Seaport Global standing out. Overall, grades suggest a cautious but generally positive outlook on Global Payments Inc.
Consumer Opinions
Consumer sentiment around Global Payments Inc. (GPN) reflects a mix of satisfaction with service quality and concerns about pricing transparency.
| Positive Reviews | Negative Reviews |
|---|---|
| “Reliable transaction processing with minimal downtime.” | “Customer support response times can be slow during peak hours.” |
| “User-friendly platform that integrates well with existing systems.” | “Fees are not always clearly communicated upfront.” |
| “Strong security features provide peace of mind for payments.” | “Occasional glitches during software updates disrupt operations.” |
Overall, consumers praise Global Payments for reliability and security but express frustration with inconsistent customer support and unclear fee structures. These issues could impact client retention if unaddressed.
Risk Analysis
The table below outlines key risks facing Global Payments Inc., highlighting their likelihood and potential impact:
| Category | Description | Probability | Impact |
|---|---|---|---|
| Financial Health | Altman Z-Score at 0.95 signals high bankruptcy risk, indicating financial distress. | High | Severe |
| Profitability | Low ROE (6.12%) and ROIC (2.5%) below WACC (4.88%) suggest weak capital efficiency. | Medium | Moderate |
| Leverage | Debt-to-equity ratio near 1.0 and interest coverage at 2.27 raise concerns over debt burden. | Medium | Moderate |
| Operational Efficiency | Poor asset turnover (0.14) indicates inefficient asset use, limiting revenue growth. | Medium | Moderate |
| Market Volatility | Beta of 0.75 implies lower sensitivity to market swings but limits upside in bull markets. | Low | Low |
I consider the bankruptcy risk the most critical red flag. The Altman Z-Score well below 1.8 places GPN firmly in distress territory. Despite a strong Piotroski score of 7, this financial fragility demands caution. The company’s weak returns on equity and capital, coupled with moderate leverage, further amplify risk. Investors must weigh these risks against the slightly favorable valuation metrics before committing capital.
Should You Buy Global Payments Inc.?
Global Payments Inc. appears to be facing declining profitability and a very unfavorable moat, suggesting value destruction. Despite a manageable liquidity profile, its leverage remains substantial. Supported by a moderate B rating, this analytical interpretation signals operational challenges amid financial risks.
Strength & Efficiency Pillars
Global Payments Inc. posts a solid net margin of 18.17%, reflecting operational discipline in a challenging environment. The company maintains an EBIT margin of 19.1%, underscoring effective cost management. However, its return on invested capital (ROIC) at 2.5% trails the weighted average cost of capital (WACC) of 4.88%, indicating value erosion rather than creation. While margins are favorable, the low ROIC signals inefficiencies in capital allocation and a lack of competitive advantage in generating returns above its cost of capital.
Weaknesses and Drawbacks
Global Payments is firmly in the financial distress zone with an Altman Z-Score of 0.95, signaling a high bankruptcy risk that overshadows other financial metrics. Despite a moderate debt-to-equity ratio of 0.95, the company’s solvency concerns dominate. Declining revenue (-23.75%) and gross profit (-11.87%) growth add to the risk profile. The bearish stock trend with a -38.3% price drop over the period and decelerating momentum heighten market pressure. These factors create a precarious investment environment despite some valuation appeal (P/E 13.26, P/B 0.81).
Our Final Verdict about Global Payments Inc.
Despite operational margin strengths, Global Payments’ Altman Z-Score of 0.95 places it in the distress zone, making the investment profile highly speculative. This solvency risk outweighs favorable profit metrics and growth in net income over the longer term. Investors with conservative capital should exercise extreme caution. The company’s financial instability suggests it may be too risky for a stable portfolio at this time.
Disclaimer: This content is for informational purposes only and does not constitute financial, investment, or other professional advice. Investing in financial markets involves a significant risk of loss, and past performance is not indicative of future results.
Additional Resources
- Global Payments: Result Reaction Underpins Low Expectations Thesis (NYSE:GPN) – Seeking Alpha (Feb 18, 2026)
- Global Payments Q4 Earnings Call Highlights – Yahoo Finance (Feb 18, 2026)
- Why Global Payments Stock Blasted Nearly 17% Higher on Wednesday – The Motley Fool (Feb 18, 2026)
- Global Payments Inc. stock outperforms competitors on strong trading day – MarketWatch (Feb 18, 2026)
- Global Payments Q4 Earnings Meet on Merchant Solutions Strength – Zacks Investment Research (Feb 18, 2026)
For more information about Global Payments Inc., please visit the official website: globalpaymentsinc.com