Home > Analyses > Consumer Cyclical > Genuine Parts Company
Genuine Parts Company powers the global automotive and industrial aftermarket with essential replacement parts and services. It stands as a pillar in specialty retail, distributing parts for everything from hybrid vehicles to heavy-duty industrial equipment. Renowned for reliability and broad market reach, GPC supports millions of repair shops and manufacturers worldwide. As the sector evolves with electrification and automation, I ask: Does GPC’s resilient business model still offer compelling growth and value?

Table of contents
Business Model & Company Overview
Genuine Parts Company, founded in 1928 and headquartered in Atlanta, Georgia, commands a leading position in the specialty retail sector. It operates a comprehensive ecosystem distributing automotive and industrial replacement parts across diverse vehicle types and industries. This core business spans everything from hybrid cars to heavy-duty equipment, serving repair shops, dealers, and industrial clients with a broad range of products and services.
The company generates revenue through a balanced mix of parts distribution and value-added repair services, with a strategic footprint across the Americas, Europe, and Asia. Its global reach includes key markets such as the US, Canada, Germany, and Singapore. Genuine Parts Company’s economic moat lies in its vast distribution network and deep customer relationships, securing its pivotal role in shaping the aftermarket industry’s future.
Financial Performance & Fundamental Metrics
I will analyze Genuine Parts Company’s income statement, key financial ratios, and dividend payout policy to assess its core financial health and shareholder value.
Income Statement
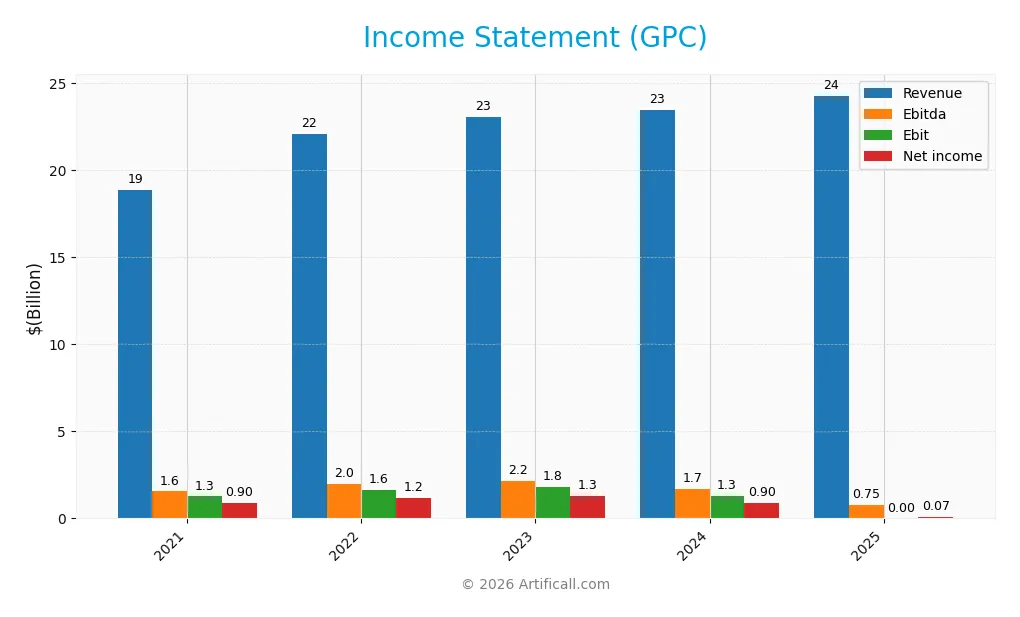
This table summarizes Genuine Parts Company’s key income statement figures over the past five fiscal years, showing trends in profitability and expense management.
| 2021 | 2022 | 2023 | 2024 | 2025 | |
|---|---|---|---|---|---|
| Revenue | 18.9B | 22.1B | 23.1B | 23.5B | 24.3B |
| Cost of Revenue | 12.2B | 14.4B | 14.8B | 15.0B | 15.9B |
| Operating Expenses | 5.5B | 6.1B | 6.5B | 7.1B | 7.2B |
| Gross Profit | 6.6B | 7.7B | 8.3B | 8.5B | 8.4B |
| EBITDA | 1.6B | 2.0B | 2.2B | 1.7B | 1.8B |
| EBIT | 1.3B | 1.6B | 1.8B | 1.3B | 1.2B |
| Interest Expense | 62M | 74M | 64M | 97M | 164M |
| Net Income | 899M | 1.2B | 1.3B | 904M | 66M |
| EPS | 6.27 | 8.36 | 9.38 | 6.49 | 0.47 |
| Filing Date | 2022-02-17 | 2023-02-23 | 2024-02-22 | 2025-02-21 | 2026-02-20 |
Income Statement Evolution
Genuine Parts Company’s revenue rose 3.5% in 2025, continuing a 28.8% growth trend since 2021. However, gross profit declined 1.4% last year, compressing the gross margin slightly to 34.6%. EBIT fell 4.6%, reflecting margin pressures, while net income plunged 93%, slashing net margin to 0.27%. These shifts suggest margin erosion despite steady top-line expansion.
Is the Income Statement Favorable?
In 2025, the company’s fundamentals show mixed signals. The gross margin remains favorable at 34.6%, supported by controlled interest expense of 0.67% of revenue. Yet, EBIT margin holds neutral at 5%, and net margin is weak at 0.27%, marking a sharp profitability decline. Overall, half the income statement metrics indicate unfavorable trends, highlighting operational challenges.
Financial Ratios
The following table presents key financial ratios for Genuine Parts Company (GPC) from 2021 to 2025, providing insight into profitability, liquidity, leverage, and market valuation:
| Ratios | 2021 | 2022 | 2023 | 2024 | 2025 |
|---|---|---|---|---|---|
| Net Margin | 4.8% | 5.4% | 5.7% | 3.8% | 0.3% |
| ROE | 25.7% | 31.2% | 29.9% | 20.8% | 1.5% |
| ROIC | 11.2% | 13.4% | 12.6% | 9.8% | 9.9% |
| P/E | 22.4 | 20.8 | 14.8 | 18.0 | 259.1 |
| P/B | 5.8 | 6.5 | 4.4 | 3.7 | 3.9 |
| Current Ratio | 1.18 | 1.15 | 1.23 | 1.16 | 1.08 |
| Quick Ratio | 0.59 | 0.57 | 0.63 | 0.51 | 0.46 |
| D/E | 0.92 | 1.10 | 1.11 | 1.32 | 1.87 |
| Debt-to-Assets | 22.3% | 25.2% | 27.2% | 29.8% | 39.8% |
| Interest Coverage | 18.7 | 21.8 | 27.1 | 14.9 | 7.4 |
| Asset Turnover | 1.31 | 1.34 | 1.29 | 1.22 | 1.17 |
| Fixed Asset Turnover | 8.25 | 9.09 | 8.00 | 6.31 | 5.71 |
| Dividend Yield | 2.3% | 2.0% | 2.7% | 3.4% | 3.3% |
Evolution of Financial Ratios
From 2021 to 2025, GPC’s Return on Equity sharply declined from 25.7% to 1.49%. The Current Ratio trended downward from 1.18 to 1.08, indicating slightly reduced liquidity. Debt-to-Equity Ratio rose from 0.92 to 1.87, signaling increased financial leverage. Profitability notably deteriorated, with net margins collapsing to 0.27% in 2025.
Are the Financial Ratios Favorable?
In 2025, GPC shows mixed financial health. Profitability ratios like ROE and net margin are unfavorable. Liquidity is neutral with a current ratio near 1.1 but a weak quick ratio at 0.46. Leverage is high, reflected by a debt-to-equity ratio of 1.87. Efficiency metrics such as asset and fixed asset turnover are favorable. Dividend yield at 3.3% also supports a positive market valuation. Overall, the ratios lean slightly unfavorable.
Shareholder Return Policy
Genuine Parts Company maintains a consistent dividend payout ratio around 40-60%, with dividends per share rising steadily from $3.25 in 2021 to $4.06 in 2025. The annual dividend yield hovers near 3.3%, supported by moderate free cash flow coverage and occasional share buybacks.
This disciplined approach balances rewarding shareholders with preserving cash for capital expenditures and debt servicing. The dividend policy, combined with buybacks, reflects a sustainable long-term value strategy, although the relatively low net profit margins suggest investors should monitor operational efficiency closely.
Score analysis
Here is a radar chart summarizing Genuine Parts Company’s key financial scores across multiple valuation and profitability metrics:
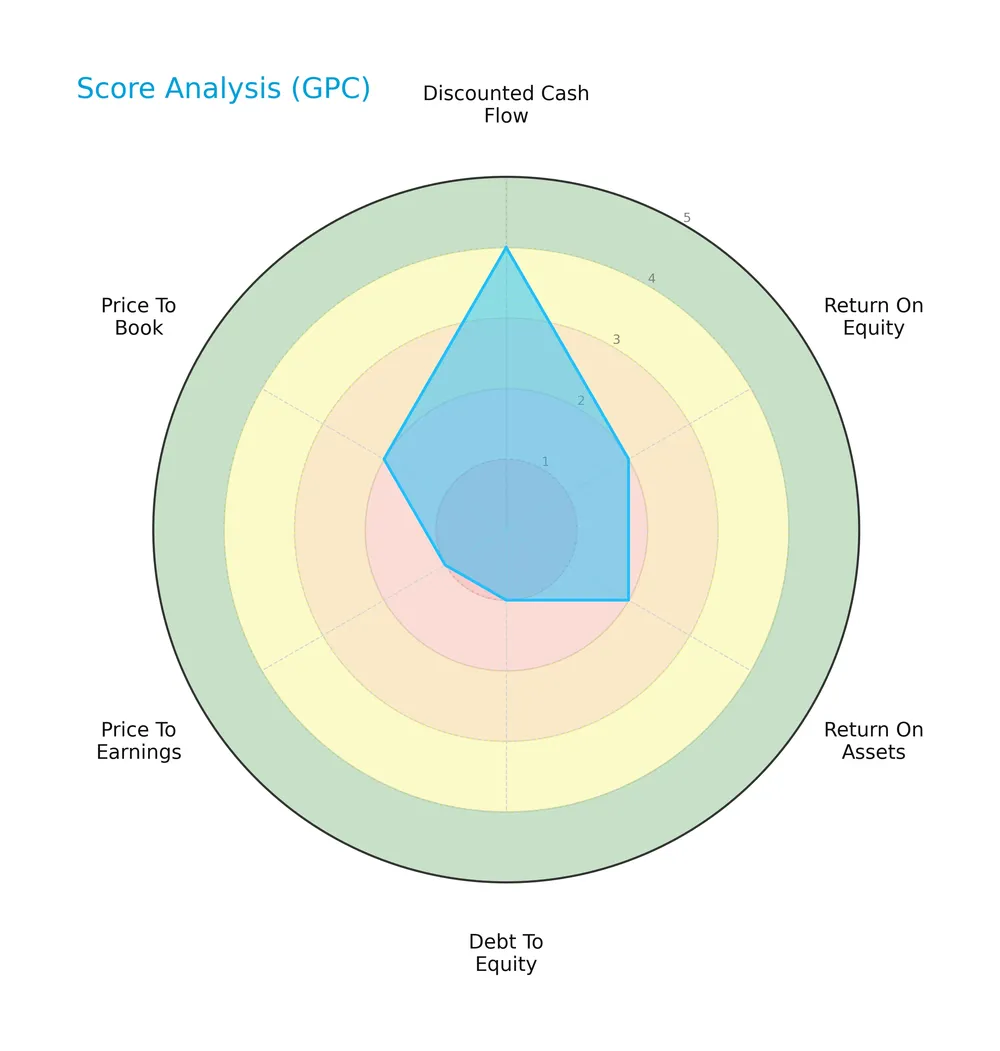
Genuine Parts Company scores well on discounted cash flow (4) but poorly on leverage and valuation metrics. Return on equity (2), return on assets (2), debt to equity (1), price to earnings (1), and price to book (2) all indicate below-average performance relative to benchmarks.
Analysis of the company’s bankruptcy risk
The Altman Z-Score places the company in the grey zone, signaling a moderate risk of financial distress and potential bankruptcy:

Is the company in good financial health?
The Piotroski Score diagram highlights the company’s average financial strength based on profitability, leverage, liquidity, and efficiency:

With a Piotroski Score of 4, Genuine Parts Company shows mixed signals of financial health, neither distinctly strong nor weak, indicating room for improvement in operational and financial fundamentals.
Competitive Landscape & Sector Positioning
This sector analysis examines Genuine Parts Company’s strategic positioning, revenue segments, products, and competitors. I will evaluate whether Genuine Parts Company holds a competitive advantage over its main rivals.
Strategic Positioning
Genuine Parts Company maintains a diversified product portfolio with nearly equal revenue split between Automotive Parts ($9.5B) and Industrial Parts ($8.4B) in 2025. Its geographic exposure spans the U.S. ($15.8B), Europe ($4B), Canada ($2B), and Australasia ($2.4B), reflecting broad international reach.
Revenue by Segment
This pie chart displays Genuine Parts Company’s revenue distribution by segment for the fiscal year 2025, highlighting the contributions of key business divisions.
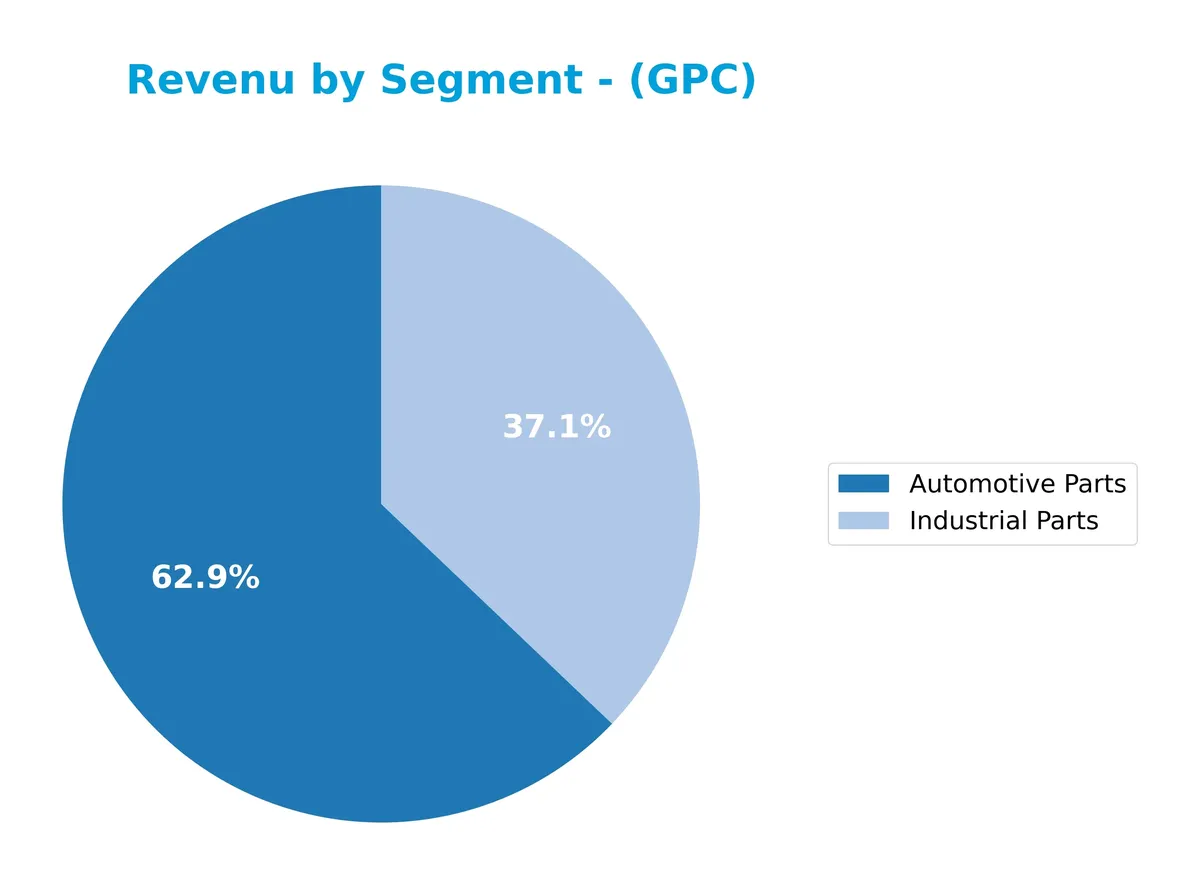
Automotive Parts and Industrial Parts dominate Genuine Parts’ revenue, with $9.5B and $8.4B respectively in 2025. Automotive Parts, historically the growth engine, shows a notable decline from $14.8B in 2024, signaling potential headwinds or strategic shifts. Industrial Parts remains stable but less dynamic. The recent deceleration in Automotive revenue demands scrutiny for concentration risk and long-term sustainability.
Key Products & Brands
Genuine Parts Company’s main products and brands are distributed across two primary segments:
| Product | Description |
|---|---|
| Automotive Parts | Replacement parts for hybrid, electric vehicles, trucks, SUVs, motorcycles, farm and marine equipment, and heavy-duty vehicles. Serves repair shops, dealers, fleet operators, and individual customers. |
| Industrial Parts | Bearings, power transmission products, automation and robotics components, hoses, hydraulic and pneumatic parts, safety supplies, and material handling products for diverse industries including manufacturing, energy, and transportation. |
Genuine Parts Company focuses on automotive and industrial replacement parts, serving a broad range of vehicle types and industrial customers with extensive product lines. The company’s diversified portfolio supports both aftermarket automotive repair and industrial maintenance sectors globally.
Main Competitors
The Consumer Cyclical Specialty Retail sector includes 10 main competitors; below is a table of the top 10 leaders by market capitalization:
| Competitor | Market Cap. |
|---|---|
| Amazon.com, Inc. | 2.42T |
| Alibaba Group Holding Limited | 340B |
| PDD Holdings Inc. | 159B |
| MercadoLibre, Inc. | 102B |
| eBay Inc. | 39.4B |
| Ulta Beauty, Inc. | 27.8B |
| Tractor Supply Company | 26.9B |
| Williams-Sonoma, Inc. | 23.0B |
| Genuine Parts Company | 17.2B |
| Best Buy Co., Inc. | 14.5B |
Genuine Parts Company ranks 9th among its peers, with a market cap just 0.68% of Amazon’s massive 2.42T valuation. It stands below both the top 10 average of 317B and the sector median of 33.6B. The company maintains a 40% market cap gap to the next competitor above, highlighting a significant scale difference in this competitive landscape.
Comparisons with competitors
Check out how we compare the company to its competitors:
Does GPC have a competitive advantage?
Genuine Parts Company demonstrates a competitive advantage by creating value with a ROIC exceeding its WACC by 4.17%, indicating efficient capital use despite a declining profitability trend. Its broad geographic footprint across the US, Europe, Canada, and Australasia supports market resilience and diversified revenue streams.
Looking ahead, GPC’s distribution of automotive and industrial parts, including for hybrid and electric vehicles, positions it to capture growth in evolving automotive markets. Expansion opportunities in service and repair offerings across multiple industries may also enhance its competitive stance.
SWOT Analysis
This analysis highlights Genuine Parts Company’s core strategic factors influencing its market position and growth potential.
Strengths
- Diverse global footprint with strong U.S. presence
- Favorable gross margin at 34.58%
- Stable dividend yield at 3.3%
Weaknesses
- Declining ROIC trend indicating weakening profitability
- High debt-to-equity ratio of 1.87 raises financial risk
- Very high P/E ratio (259) signals overvaluation concerns
Opportunities
- Expansion in electric and hybrid vehicle parts market
- Growing industrial automation and robotics demand
- Increasing aftermarket services and repairs
Threats
- Intense competition in specialty retail sector
- Margin pressure from rising costs and supply chain issues
- Economic cycles impacting industrial and automotive spending
Genuine Parts Company leverages its global scale and solid margins but faces profitability erosion and valuation risks. Strategic focus should target operational efficiency and growth in emerging automotive technologies to counteract financial vulnerabilities.
Stock Price Action Analysis
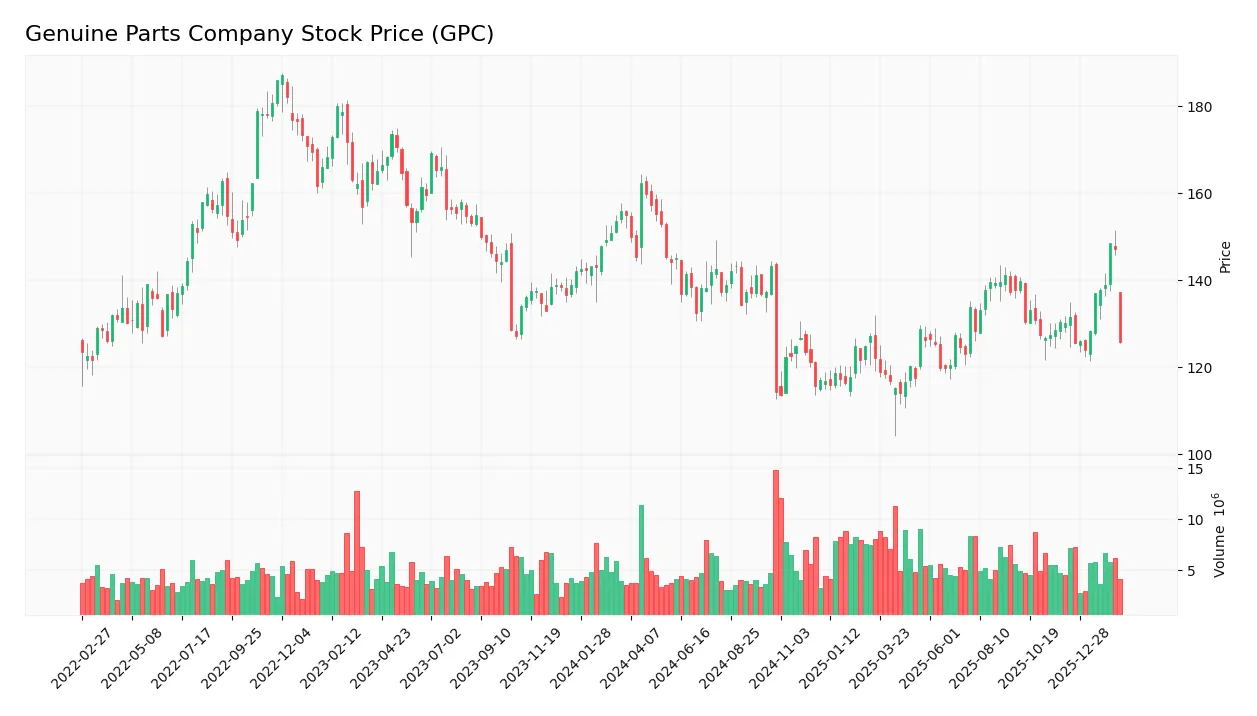
The weekly stock chart below illustrates Genuine Parts Company’s price movements over the past 12 months, highlighting key volatility and trend shifts:
Trend Analysis
GPC’s stock declined by 23.8% over the past year, confirming a bearish trend with accelerating downward momentum. The price fluctuated between a high of 162.39 and a low of 113.61, reflecting elevated volatility (std. dev. 11.46). Recent months show a further 9.35% drop but with a slight trend slope of 0.99, indicating possible deceleration.
Volume Analysis
Trading volume has increased recently, totaling 681M shares annually. Buyer volume slightly lags seller volume overall (49% buyers). However, the last three months show buyer dominance at 54%, suggesting cautious buying interest and moderate market participation.
Target Prices
Analysts set a confident target consensus for Genuine Parts Company, reflecting steady growth potential.
| Target Low | Target High | Consensus |
|---|---|---|
| 127 | 160 | 141 |
The target range signals a moderate upside from current levels. Analysts expect Genuine Parts to perform solidly within its sector.

Don’t Let Luck Decide Your Entry Point
Optimize your entry points with our advanced ProRealTime indicators. You’ll get efficient buy signals with precise price targets for maximum performance. Start outperforming now!
Analyst & Consumer Opinions
This section reviews Genuine Parts Company (GPC) grades and consumer feedback to assess market perception and satisfaction.
Stock Grades
Here are the latest verified ratings from reputable financial institutions for Genuine Parts Company (GPC):
| Grading Company | Action | New Grade | Date |
|---|---|---|---|
| UBS | Maintain | Neutral | 2026-02-18 |
| Truist Securities | Downgrade | Hold | 2026-02-18 |
| Truist Securities | Maintain | Buy | 2026-02-12 |
| Evercore ISI Group | Maintain | Outperform | 2026-02-11 |
| Evercore ISI Group | Maintain | Outperform | 2026-02-10 |
| Goldman Sachs | Upgrade | Neutral | 2025-11-13 |
| JP Morgan | Maintain | Overweight | 2025-10-23 |
| Truist Securities | Maintain | Buy | 2025-10-22 |
| UBS | Maintain | Neutral | 2025-10-10 |
| Evercore ISI Group | Maintain | Outperform | 2025-10-01 |
The consensus leans toward a Hold rating, reflecting mixed views among analysts. Notably, Evercore consistently rates GPC as Outperform, while Truist has recently softened its stance from Buy to Hold.
Consumer Opinions
Genuine Parts Company (GPC) enjoys a generally favorable reputation among consumers, with praise focused on product availability and service quality.
| Positive Reviews | Negative Reviews |
|---|---|
| Reliable product availability | Occasional delays in shipping |
| Knowledgeable and helpful staff | Higher pricing compared to competitors |
| Consistently good customer support | Limited online shopping options |
Overall, consumers appreciate GPC’s dependable inventory and strong customer service. However, some express frustration over shipping delays and pricing, signaling areas for operational improvement.
Risk Analysis
Below is a table summarizing key risks facing Genuine Parts Company (GPC) and their likelihood and potential impact:
| Category | Description | Probability | Impact |
|---|---|---|---|
| Financial Health | Altman Z-Score of 2.28 places GPC in the “grey zone,” indicating moderate bankruptcy risk. | Medium | High |
| Profitability | Low net margin (0.27%) and ROE (1.49%) signal weak profitability and return on equity. | High | Medium |
| Leverage | Debt-to-equity ratio at 1.87 is high, raising concerns about financial risk and interest burden. | High | Medium |
| Valuation | Extremely high P/E ratio of 259 suggests overvaluation relative to sector benchmarks. | High | High |
| Liquidity | Quick ratio of 0.46 indicates potential short-term liquidity stress despite a neutral current ratio. | Medium | Medium |
| Market Volatility | Beta of 0.73 implies below-average volatility but exposes GPC to cyclical retail sector risks. | Medium | Medium |
The most pressing risks are GPC’s stretched valuation and moderate financial distress indicated by its Altman Z-Score. The high debt level compounds these concerns, especially in a sector sensitive to economic cycles. Investors should closely monitor profitability trends and liquidity metrics for signs of further deterioration.
Should You Buy Genuine Parts Company?
Genuine Parts Company appears to be creating value with a slightly favorable moat despite declining profitability. Its leverage profile is substantial, reflecting elevated debt levels. While the overall rating suggests caution, the analytical interpretation indicates moderate operational efficiency and financial risk.
Strength & Efficiency Pillars
Genuine Parts Company posts a gross margin of 34.58%, reflecting solid operational efficiency. Its ROIC stands at 9.87%, comfortably above the WACC of 5.7%, confirming the company as a value creator. The interest expense ratio of 0.67% indicates manageable financing costs, while asset turnover at 1.17 and fixed asset turnover at 5.71 highlight efficient asset utilization. Despite a modest net margin of 0.27%, these metrics suggest that Genuine Parts maintains operational resilience amid sector challenges.
Weaknesses and Drawbacks
The company sits in the Altman Z-Score grey zone with a score of 2.28, signaling moderate bankruptcy risk. Its valuation appears stretched, with an extremely high P/E ratio of 259.07 and a P/B ratio of 3.86, indicating potential overvaluation. Leverage concerns persist, evidenced by a debt-to-equity ratio of 1.87 and a weak quick ratio of 0.46, raising liquidity red flags. These factors, combined with a bearish overall stock trend (-23.8%), pose significant headwinds for investors.
Our Final Verdict about Genuine Parts Company
Genuine Parts Company’s long-term profile might appear mixed. The firm creates value operationally, yet its moderate solvency risk and stretched valuation suggest caution. Despite a recent slight buyer dominance (54.04%) and operational efficiency, the bearish market trend and financial leverage could warrant a wait-and-see approach before committing new capital.
Disclaimer: This content is for informational purposes only and does not constitute financial, investment, or other professional advice. Investing in financial markets involves a significant risk of loss, and past performance is not indicative of future results.
Additional Resources
- Genuine Parts Company Announces Plan to Separate Automotive and Industrial Businesses Into Two Industry-Leading Public Companies – PR Newswire (Feb 17, 2026)
- NAPA Owner Genuine Parts Plans to Split Into Two Companies – The Wall Street Journal (Feb 17, 2026)
- Genuine Parts Company Plans Automotive-Industrial Business Split – The BRAKE Report (Feb 17, 2026)
- Genuine Parts to split into industrial and auto businesses; sees weak FY26 profit – CNBC (Feb 17, 2026)
- Genuine Parts Company makes plans to separate into two companies – Seeking Alpha (Feb 17, 2026)
For more information about Genuine Parts Company, please visit the official website: genpt.com