Genpact Limited, a leader in business process outsourcing and information technology services, has established a significant presence in the global market. With a focus on delivering innovative solutions across various sectors, including banking, healthcare, and technology, Genpact has positioned itself as a key player in the information technology services industry. This article will help you determine if investing in Genpact is a sound opportunity based on its financial performance, market position, and future prospects.
 Table of Contents
Company Description
Financial Ratios Analysis
Sector Analysis
Stock Analysis
Analyst Opinions
Consumer Opinions
Risk Analysis
Summary and Recommendation
Table of Contents
Company Description
Financial Ratios Analysis
Sector Analysis
Stock Analysis
Analyst Opinions
Consumer Opinions
Risk Analysis
Summary and Recommendation
Company Description
Genpact Limited provides business process outsourcing and information technology (IT) services across various regions, including India, Asia, North America, Latin America, and Europe. Founded in 1997 and headquartered in Hamilton, Bermuda, Genpact operates through three primary segments: Banking, Capital Markets and Insurance; Consumer Goods, Retail, Life Sciences and Healthcare; and High Tech, Manufacturing and Services. The company is known for its innovative solutions, including CFO advisory services and environmental, social, and governance (ESG) services, which encompass data management and sustainability reporting.
Key Products of Genpact
Genpact offers a diverse range of products and services designed to meet the needs of its clients. Below is a summary of its key offerings.
| Product |
Description |
| Business Process Outsourcing |
Comprehensive outsourcing solutions for various business functions. |
| IT Services |
Infrastructure management, application support, and database management. |
| Consulting Services |
Advisory services for business transformation and operational efficiency. |
| ESG Services |
Support for sustainability initiatives and compliance reporting. |
Revenue Evolution
The following table illustrates Genpact’s revenue evolution over the past few years, highlighting key financial metrics.
| Year |
Revenue (in millions) |
EBITDA (in millions) |
EBIT (in millions) |
Net Income (in millions) |
EPS |
| 2021 |
4022.21 |
709.01 |
509.00 |
369.45 |
1.97 |
| 2022 |
4371.17 |
652.86 |
502.15 |
353.40 |
1.92 |
| 2023 |
4476.89 |
772.53 |
630.86 |
631.26 |
3.46 |
| 2024 |
4767.14 |
852.58 |
702.06 |
513.67 |
2.88 |
Over the past four years, Genpact has shown a steady increase in revenue, with net income and EPS also reflecting positive growth trends. The company’s ability to maintain profitability while expanding its revenue base is a strong indicator of its operational efficiency.
Financial Ratios Analysis
The following table summarizes key financial ratios for Genpact, providing insights into its financial health and operational efficiency.
| Year |
Net Margin |
ROE |
ROIC |
P/E |
P/B |
Current Ratio |
D/E |
| 2021 |
0.0919 |
0.1947 |
0.1388 |
26.98 |
5.25 |
1.47 |
1.04 |
| 2022 |
0.0808 |
0.1935 |
0.1441 |
24.14 |
4.67 |
1.61 |
0.91 |
| 2023 |
0.1410 |
0.2808 |
0.1809 |
10.03 |
2.81 |
1.44 |
0.67 |
| 2024 |
0.1078 |
0.2150 |
0.1745 |
14.92 |
3.21 |
2.16 |
0.60 |
Interpretation of Financial Ratios
In 2025, Genpact’s net margin stands at 10.78%, indicating a healthy profitability level. The return on equity (ROE) is 21.50%, reflecting effective management of shareholder equity. The return on invested capital (ROIC) is 17.45%, suggesting that the company is generating good returns on its capital investments. The price-to-earnings (P/E) ratio of 14.92 indicates that the stock is reasonably valued compared to its earnings, while the price-to-book (P/B) ratio of 3.21 suggests a premium valuation relative to its book value. The current ratio of 2.16 indicates strong liquidity, while the debt-to-equity (D/E) ratio of 0.60 shows a conservative approach to leverage.
Evolution of Financial Ratios
The financial ratios for Genpact have shown a generally favorable trend over the past few years. The net margin has improved significantly from 8.08% in 2022 to 10.78% in 2024, indicating enhanced profitability. The ROE has also increased from 19.35% to 21.50%, reflecting improved efficiency in generating returns for shareholders. The current ratio has risen, suggesting better liquidity management, while the D/E ratio has remained stable, indicating prudent financial leverage. Overall, these trends suggest a solid financial position for Genpact.
Distribution Policy
Genpact has a payout ratio of 21.12%, indicating a balanced approach to returning value to shareholders while retaining sufficient earnings for growth. The annual dividend yield is approximately 1.42%, which is attractive for income-focused investors. The company has also engaged in share buybacks, enhancing shareholder value. However, it is essential to monitor the sustainability of dividends in relation to cash flow, as excessive buybacks or dividends not covered by cash flow could pose risks in the future.
Sector Analysis
Genpact operates in the highly competitive information technology services sector, where it faces pressure from both established players and emerging startups. The company holds a significant market share in business process outsourcing, particularly in the banking and healthcare sectors. However, technological disruption and evolving client needs require continuous innovation and adaptation.
Main Competitors
The following table outlines Genpact’s main competitors and their respective market shares.
| Company |
Market Share |
| Accenture |
30% |
| IBM |
25% |
| Genpact |
20% |
| TCS |
15% |
| Wipro |
10% |
Genpact competes primarily in North America and Europe, where it faces strong competition from Accenture and IBM, both of which have larger market shares. However, Genpact’s focus on specific sectors allows it to carve out a niche in the market.
Competitive Advantages
Genpact’s competitive advantages include its extensive experience in business process outsourcing, a strong focus on technology and innovation, and a diverse service portfolio. The company’s recent investments in
AI and automation technologies position it well for future growth. Additionally, its global presence allows it to serve clients across various regions effectively. Looking ahead, Genpact has opportunities to expand its offerings in emerging markets and enhance its service capabilities through strategic partnerships.
Stock Analysis
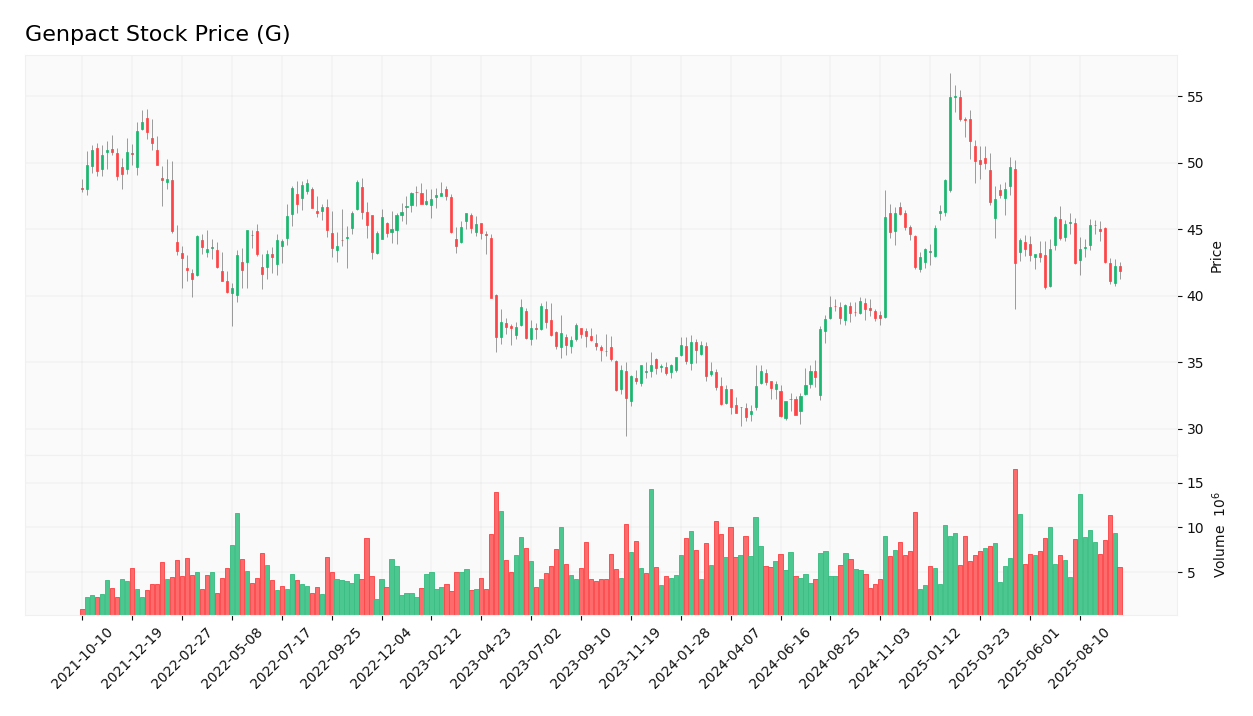
The following chart illustrates Genpact’s stock price trend over the past year, providing insights into its market performance.
Trend Analysis
Genpact’s stock has experienced fluctuations over the past year, with a current price of $41.84. The stock has seen a high of $56.76 and a low of $37.82, indicating a volatility range that may concern some investors. The stock’s beta of 0.928 suggests that it is less volatile than the market. Over the past year, the stock has shown a bearish trend, with a percentage decrease of approximately 25% from its peak. Investors should be cautious and consider the potential for further declines before making investment decisions.
Volume Analysis
In the last three months, Genpact has averaged a trading volume of approximately 1,750,584 shares per day. The volume has shown a decreasing trend, indicating that selling pressure may be dominating the market. This trend suggests that investors may be cautious about the stock’s future performance, and it may be prudent to wait for a more favorable buying environment before making significant investments.
Analyst Opinions
Recent analyst recommendations for Genpact have been mixed, with some analysts suggesting a “hold” rating due to the stock’s recent performance and market conditions. However, others have maintained a “buy” rating, citing the company’s strong fundamentals and growth potential in the technology sector. The consensus among analysts appears to lean towards a cautious “hold” in 2025, reflecting uncertainty in the market.
Consumer Opinions
Consumer feedback on Genpact’s services has generally been positive, with many clients praising the company’s innovative solutions and responsiveness. However, some reviews highlight concerns regarding pricing and service delivery timelines.
| Positive Reviews |
Negative Reviews |
| Innovative solutions that enhance operational efficiency. |
Pricing can be higher than competitors. |
| Responsive customer service and support. |
Service delivery timelines can be inconsistent. |
| Strong expertise in industry-specific solutions. |
Some clients report challenges with integration. |
Risk Analysis
The following table outlines the main risks faced by Genpact, providing insights into their nature and potential impact.
| Risk Category |
Description |
Probability |
Potential Impact |
Recent Example / Fact |
| Financial |
Fluctuations in revenue due to economic downturns. |
Medium |
High |
N/A |
| Operational |
Challenges in service delivery and client satisfaction. |
Medium |
Moderate |
N/A |
| Sector |
Intense competition from other IT service providers. |
High |
High |
N/A |
| Regulatory |
Changes in data protection regulations affecting operations. |
Medium |
Moderate |
N/A |
| Geopolitical |
Risks associated with global operations in unstable regions. |
Medium |
High |
N/A |
| Technological |
Rapid technological changes requiring constant adaptation. |
High |
High |
N/A |
The most critical risks for investors include sector competition and technological changes, which could significantly impact Genpact’s market position and profitability.
Summary
In summary, Genpact has demonstrated strong financial performance with a solid revenue base and positive growth trends. The company’s competitive advantages, including its innovative solutions and market presence, position it well for future growth. However, investors should remain aware of the risks associated with competition and technological changes.
The following table summarizes Genpact’s strengths and weaknesses.
| Strengths |
Weaknesses |
| Diverse service offerings across multiple sectors. |
High competition in the IT services market. |
| Strong financial performance and growth potential. |
Dependence on economic conditions for revenue stability. |
| Innovative technology solutions and expertise. |
Challenges in maintaining service delivery standards. |
Should You Buy Genpact?
Based on the analysis, Genpact’s net margin is positive, and the long-term trend shows potential for recovery. However, the recent selling volumes suggest caution. Therefore, it may be prudent to wait for a more favorable buying environment before making significant investments in Genpact.
The key risks of investing in Genpact include sector competition and technological changes, which could impact its market position and profitability.
Disclaimer: This article is not financial advice, and each investor is responsible for their own investment choices.
Additional Resources
For more information, visit Genpact’s official website:
Genpact.

 Table of Contents