Home > Analyses > Consumer Defensive > General Mills, Inc.
General Mills, Inc. shapes daily life through its iconic brands that fill breakfast tables and pantry shelves worldwide. As a powerhouse in the packaged foods industry, it boasts a diverse portfolio including Cheerios, Häagen-Dazs, and Blue Buffalo, renowned for quality and innovation. With deep market influence and a broad global footprint, General Mills continues to evolve. The key question for investors in 2026 is whether its solid fundamentals and strategic initiatives still justify its market valuation and growth prospects.
Table of contents
Business Model & Company Overview
General Mills, Inc., founded in 1866 and headquartered in Minneapolis, Minnesota, stands as a leading force in the packaged foods industry. With a rich portfolio that includes iconic brands like Cheerios, Häagen-Dazs, and Betty Crocker, the company delivers a cohesive ecosystem of consumer food products spanning ready-to-eat cereals, frozen dough, snacks, and pet foods. Its global footprint is organized into five segments covering North America, Europe, Asia, Latin America, and pet products, reflecting a comprehensive approach to consumer needs.
The company’s revenue engine balances branded food products with pet food offerings, leveraging a mix of direct sales and broad distribution channels, including grocery and mass merchandisers, foodservice, and e-commerce platforms. This multi-channel strategy fuels its presence across the Americas, Europe, and Asia, supporting a market cap of $23.8B. General Mills’ competitive advantage lies in its enduring brand portfolio and diversified global reach, securing its role in shaping the future of consumer food markets.
Financial Performance & Fundamental Metrics
This section analyzes General Mills, Inc.’s income statement, key financial ratios, and dividend payout policy to assess its overall financial health and investment potential.
Income Statement
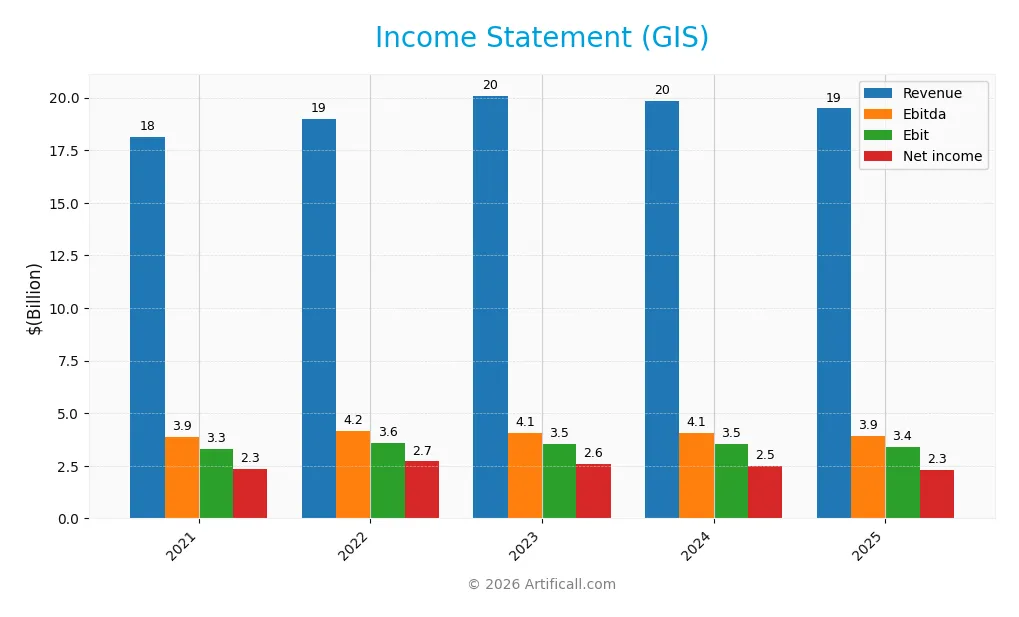
The table below summarizes General Mills, Inc.’s key income statement figures over the last five fiscal years, reflecting its financial performance in USD.
| 2021 | 2022 | 2023 | 2024 | 2025 | |
|---|---|---|---|---|---|
| Revenue | 18.13B | 18.99B | 20.09B | 19.86B | 19.49B |
| Cost of Revenue | 11.68B | 12.59B | 13.55B | 12.93B | 12.75B |
| Operating Expenses | 3.30B | 2.93B | 3.11B | 3.50B | 3.43B |
| Gross Profit | 6.45B | 6.40B | 6.55B | 6.93B | 6.73B |
| EBITDA | 3.89B | 4.16B | 4.08B | 4.08B | 3.92B |
| EBIT | 3.29B | 3.59B | 3.54B | 3.53B | 3.38B |
| Interest Expense | 418M | 377M | 393M | 503M | 549M |
| Net Income | 2.34B | 2.71B | 2.59B | 2.50B | 2.30B |
| EPS | 3.81 | 4.46 | 4.36 | 4.34 | 4.12 |
| Filing Date | 2021-06-30 | 2022-06-30 | 2023-06-28 | 2024-06-26 | 2025-06-26 |
Income Statement Evolution
From 2021 to 2025, General Mills’ revenue showed a modest overall growth of 7.5%, but declined by 1.87% in the latest year, indicating a slowdown. Net income decreased by 1.91% over the period and dropped 6.32% in the last year, reflecting pressure on profitability. Margins, particularly gross and EBIT, remained favorable, though net margin contracted overall.
Is the Income Statement Favorable?
In fiscal 2025, General Mills reported a revenue of $19.49B and net income of $2.29B, with a net margin of 11.78%, all considered favorable metrics. However, the year saw declines in revenue, gross profit, EBIT, net margin, and EPS growth rates, signaling some operational headwinds. Overall, the income statement presents a mixed picture with robust margins but recent earnings and revenue softness, leading to an unfavorable global evaluation.
Financial Ratios
The table below presents key financial ratios for General Mills, Inc. over the fiscal years 2021 to 2025, illustrating profitability, valuation, liquidity, leverage, efficiency, and dividend metrics:
| Ratios | 2021 | 2022 | 2023 | 2024 | 2025 |
|---|---|---|---|---|---|
| Net Margin | 13% | 14% | 13% | 13% | 12% |
| ROE | 25% | 26% | 25% | 27% | 25% |
| ROIC | 9% | 11% | 11% | 11% | 10% |
| P/E | 16.5 | 15.7 | 19.3 | 15.7 | 12.9 |
| P/B | 4.08 | 4.03 | 4.79 | 4.18 | 3.22 |
| Current Ratio | 0.70 | 0.63 | 0.69 | 0.65 | 0.67 |
| Quick Ratio | 0.48 | 0.40 | 0.40 | 0.38 | 0.43 |
| D/E | 1.37 | 1.14 | 1.15 | 1.42 | 1.66 |
| Debt-to-Assets | 41% | 38% | 38% | 42% | 46% |
| Interest Coverage | 7.5 | 9.2 | 8.7 | 6.8 | 6.0 |
| Asset Turnover | 0.57 | 0.61 | 0.64 | 0.63 | 0.59 |
| Fixed Asset Turnover | 4.55 | 5.09 | 5.05 | 4.69 | 4.83 |
| Dividend Yield | 3.2% | 2.9% | 2.6% | 3.5% | 4.5% |
Evolution of Financial Ratios
Over the recent years, General Mills, Inc. exhibited a modest decline in Return on Equity (ROE), from 26.57% in 2024 to 24.95% in 2025, signaling a slight decrease in profitability efficiency. The Current Ratio remained consistently below 1, around 0.67 in 2025, indicating ongoing liquidity constraints. Meanwhile, the Debt-to-Equity Ratio rose steadily, reaching 1.66 in 2025, reflecting an increased reliance on debt financing.
Are the Financial Ratios Favorable?
In 2025, General Mills showed favorable profitability with a net margin of 11.78% and a strong ROE of 24.95%. Liquidity ratios such as the Current Ratio (0.67) and Quick Ratio (0.43) were unfavorable, suggesting limited short-term asset coverage. The Debt-to-Equity ratio (1.66) was also unfavorable, but interest coverage remained favorable at 6.16. Market valuation metrics were mixed; the price-to-earnings ratio was favorable at 12.9, whereas the price-to-book ratio was unfavorable at 3.22. Overall, the company’s financial ratios present a slightly favorable profile.
Shareholder Return Policy
General Mills, Inc. maintains a consistent dividend payment with a payout ratio around 58%, a dividend yield near 4.5%, and a steady increase in dividend per share over recent years, supported by free cash flow coverage. The company also pursues share buybacks, balancing distributions with capital expenditures.
This policy indicates a commitment to returning value while managing cash flow prudently. The payout ratio and dividend coverage suggest distributions are sustainable, but ongoing monitoring of debt and cash flow metrics remains key to assessing long-term shareholder value support.
Score analysis
Here is an overview of General Mills, Inc.’s key financial scores presented in a radar chart for clarity:
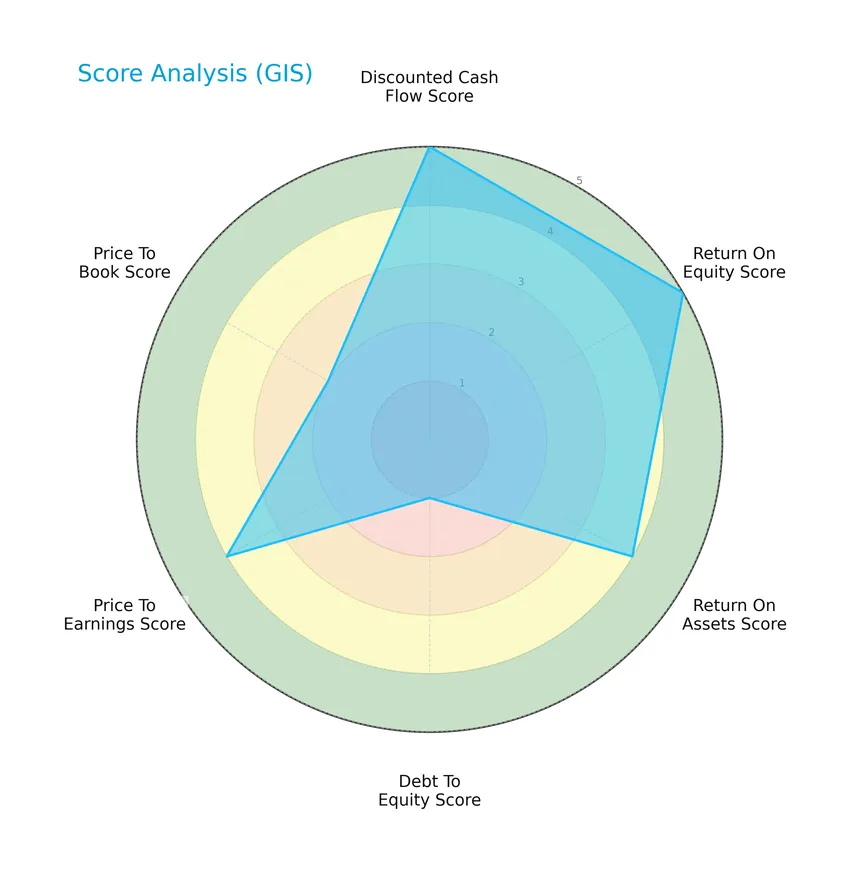
The company shows very favorable scores in discounted cash flow and return on equity, favorable returns on assets and price-to-earnings, but a very unfavorable debt-to-equity ratio and a moderate price-to-book score, indicating mixed financial metrics.
Analysis of the company’s bankruptcy risk
General Mills’ Altman Z-Score places it in the grey zone, suggesting a moderate risk of bankruptcy and some financial caution is warranted:

Is the company in good financial health?
The following Piotroski diagram illustrates General Mills’ financial health based on its score:

With a Piotroski Score of 6, the company is considered to have average financial strength, reflecting moderate profitability and efficiency without signaling strong or weak financial health.
Competitive Landscape & Sector Positioning
This sector analysis will explore General Mills, Inc.’s strategic positioning, revenue by segment, key products, main competitors, competitive advantages, and SWOT analysis. I will also evaluate whether General Mills holds a competitive advantage over its rivals.
Strategic Positioning
General Mills, Inc. maintains a diversified product portfolio spanning cereals, snacks, pet food, convenient meals, and super-premium ice cream, with notable revenue of $15.8B in the U.S. and $3.7B internationally. The company operates across multiple segments and geographic regions, reflecting broad market exposure.
Revenue by Segment
This pie chart illustrates General Mills, Inc.’s revenue distribution across its product segments for the fiscal year 2025.
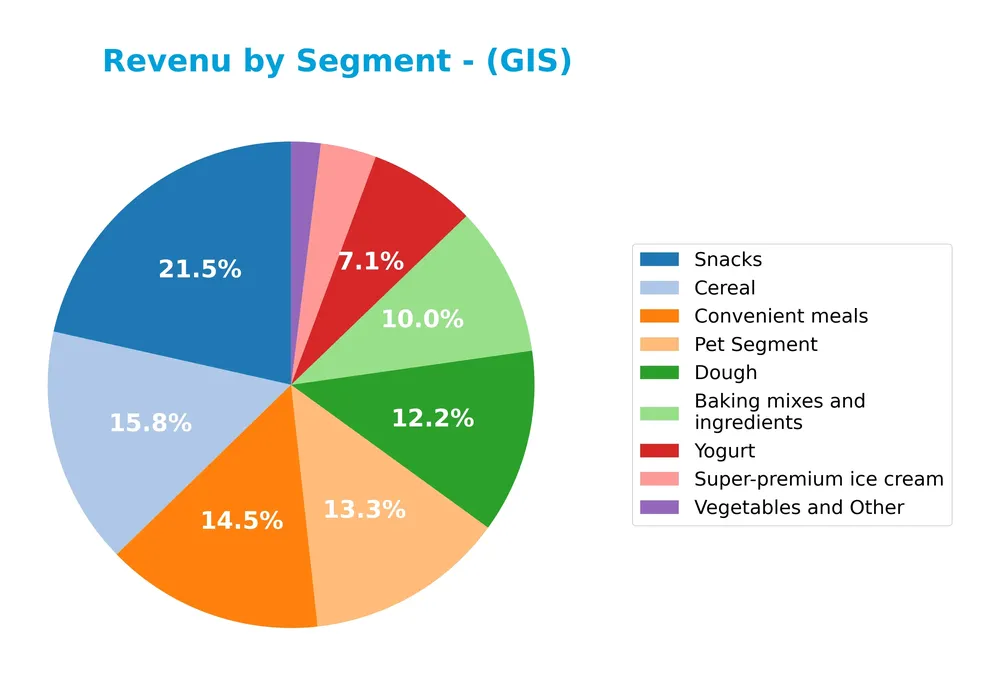
In 2025, Snacks led General Mills’ revenue with $4.2B, followed by Cereal at $3.1B and Convenient Meals at $2.8B. Pet Segment and Dough also contributed significantly, around $2.6B and $2.4B respectively. Baking Mixes and Yogurt showed moderate revenue, while Super-premium Ice Cream and Vegetables and Other were smaller contributors. The data suggests a diversified portfolio with a strong concentration in Snacks and Cereal, indicating these segments remain key growth drivers.
Key Products & Brands
The following table summarizes the key products and brands of General Mills, Inc., along with their descriptions:
| Product | Description |
|---|---|
| Baking mixes and ingredients | Includes dessert and baking mixes, bakery flour, and related baking ingredients. |
| Cereal | Ready-to-eat cereals such as Cheerios, Cinnamon Toast Crunch, Cocoa Puffs, Lucky Charms, and Trix. |
| Convenient meals | Meal kits, soups, refrigerated and frozen dough products, and frozen pizza and pizza snacks. |
| Dough | Refrigerated and frozen dough products for baking and cooking. |
| Pet Segment | Branded pet food products including dog and cat food under Blue Buffalo and related brands. |
| Snacks | Snack bars, fruit and salty snacks, nutrition bars, savory and grain snacks, and wellness beverages. |
| Super-premium ice cream | Premium ice cream products marketed under brands like Häagen-Dazs. |
| Vegetables and Other | Organic frozen and shelf-stable vegetables and various other food products. |
| Yogurt | Refrigerated yogurt products including brands like Yoplait and Oui. |
General Mills operates a diverse portfolio of food and pet products across multiple categories, combining well-known brands with a broad product range to serve global consumer needs.
Main Competitors
There are 11 competitors in the Packaged Foods industry, with the table below listing the top 10 leaders by market capitalization:
| Competitor | Market Cap. |
|---|---|
| JBS N.V. | 32B |
| The Kraft Heinz Company | 29B |
| General Mills, Inc. | 25B |
| McCormick & Company, Incorporated | 18B |
| Hormel Foods Corporation | 13B |
| The J. M. Smucker Company | 10B |
| The Magnum Ice Cream Company N.V. | 9.7B |
| Pilgrim’s Pride Corporation | 9.3B |
| Conagra Brands, Inc. | 8.3B |
| Campbell Soup Company | 8.3B |
General Mills, Inc. ranks 3rd among its 11 competitors, with a market cap approximately 74% that of the top player, JBS N.V. It stands above both the average market cap of the top 10 competitors (16.2B) and the sector median (10.3B). The company maintains a 21.42% market cap lead over its nearest competitor below, The Kraft Heinz Company, indicating a solid positioning within its peer group.
Comparisons with competitors
Check out how we compare the company to its competitors:
Does GIS have a competitive advantage?
General Mills, Inc. demonstrates a durable competitive advantage, supported by a very favorable moat status with a ROIC exceeding its WACC by 5.49% and a positive ROIC growth trend of 2.87%, indicating efficient capital use and value creation. Despite some recent declines in revenue and net margin, the company maintains strong profitability with favorable gross and EBIT margins around 34.55% and 17.36%, respectively.
Looking ahead, General Mills operates across diverse geographic markets including North America and international segments, offering a broad portfolio of branded consumer foods and pet products. The company’s continued focus on expanding its organic and wellness product lines, along with its presence in emerging markets such as Asia and Latin America, offers potential opportunities for growth in evolving food and pet care categories.
SWOT Analysis
This SWOT analysis highlights General Mills, Inc.’s key internal strengths and weaknesses alongside external opportunities and threats to inform strategic investment decisions.
Strengths
- Strong brand portfolio
- Favorable net margin of 11.78%
- Durable competitive advantage with growing ROIC
Weaknesses
- Declining revenue and profit growth
- High debt-to-equity ratio of 1.66
- Low liquidity ratios (current ratio 0.67)
Opportunities
- Expansion in international markets
- Growing demand for organic and health foods
- E-commerce and direct-to-consumer sales growth
Threats
- Intense industry competition
- Commodity price volatility
- Changing consumer preferences and health trends
Overall, General Mills demonstrates solid profitability and a strong market position but faces challenges in growth and financial leverage. Strategic focus should balance leveraging brand strength and innovation while managing debt and adapting to evolving consumer demands.
Stock Price Action Analysis
The following weekly stock chart illustrates General Mills, Inc. (GIS) price movements over the past 12 months:
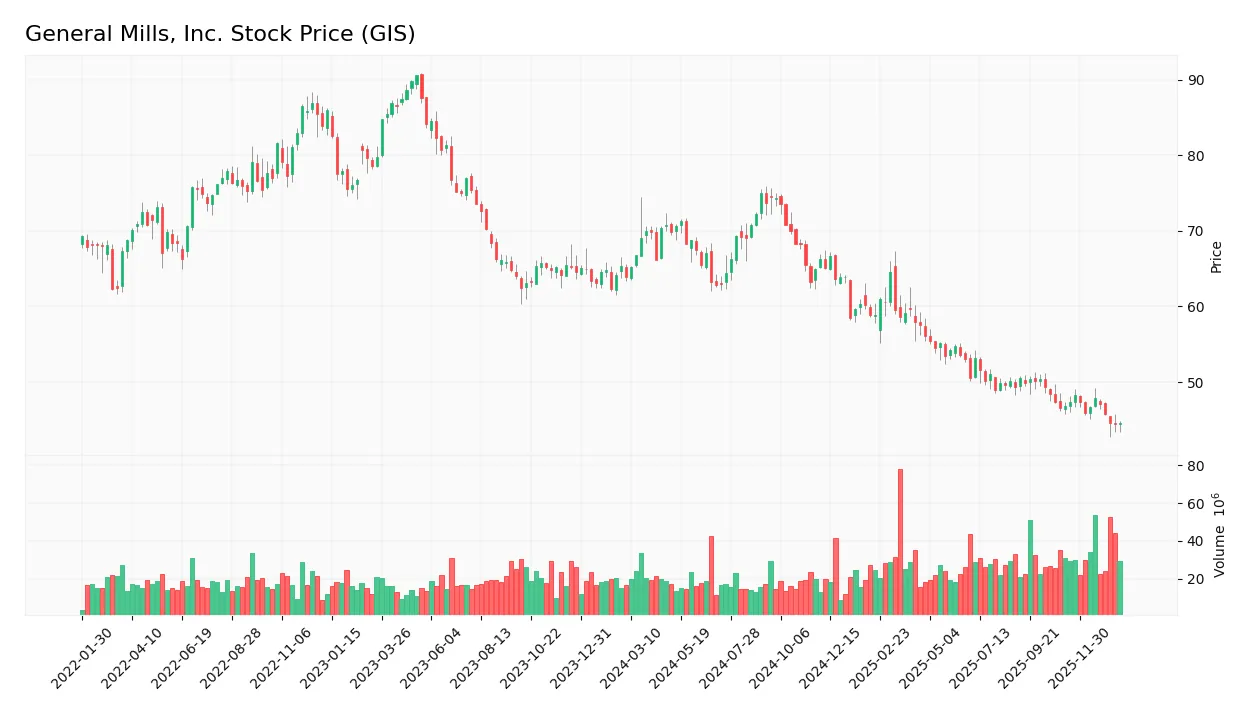
Trend Analysis
Over the past 12 months, GIS stock declined by 30.31%, indicating a bearish trend with accelerating downward momentum. The price fluctuated between a high of 75.06 and a low of 44.51, with a volatility measured by a standard deviation of 8.93. Recent weeks show a moderate continuation of this decline.
Volume Analysis
In the last three months, trading volume has increased, with buyers accounting for 51.53% of activity, suggesting balanced investor interest. Buyer behavior remains neutral, reflecting steady market participation amid modest shifts in sentiment between buyers and sellers.
Target Prices
Analysts present a moderate target price consensus for General Mills, Inc., reflecting steady expectations.
| Target High | Target Low | Consensus |
|---|---|---|
| 63 | 47 | 52.2 |
The target prices suggest a moderate upside potential, with analysts generally expecting the stock to trade around the low 50s in the near term.

Don’t Let Luck Decide Your Entry Point
Optimize your entry points with our advanced ProRealTime indicators. You’ll get efficient buy signals with precise price targets for maximum performance. Start outperforming now!
Analyst & Consumer Opinions
This section examines recent analyst ratings and consumer feedback on General Mills, Inc. (GIS) to gauge market sentiment.
Stock Grades
Here is the latest summary of stock grades for General Mills, Inc. from several well-known financial institutions:
| Grading Company | Action | New Grade | Date |
|---|---|---|---|
| Wells Fargo | Maintain | Equal Weight | 2026-01-05 |
| Morgan Stanley | Maintain | Underweight | 2025-12-22 |
| Wells Fargo | Maintain | Equal Weight | 2025-12-18 |
| Bernstein | Maintain | Market Perform | 2025-12-18 |
| TD Cowen | Maintain | Hold | 2025-12-18 |
| TD Cowen | Maintain | Hold | 2025-12-15 |
| Wells Fargo | Maintain | Equal Weight | 2025-12-12 |
| Stifel | Maintain | Buy | 2025-12-11 |
| Jefferies | Maintain | Hold | 2025-12-11 |
| Mizuho | Maintain | Neutral | 2025-09-19 |
The consensus among analysts leans mostly toward holding the stock, with a notable presence of buy ratings but also some underweight and sell opinions. This distribution reflects a cautious but mixed sentiment on General Mills’ near-term prospects.
Consumer Opinions
Consumer sentiment around General Mills, Inc. (GIS) reflects a mix of appreciation for product quality and concerns over pricing and packaging.
| Positive Reviews | Negative Reviews |
|---|---|
| “Consistently fresh and tasty cereals.” | “Prices have increased noticeably in recent years.” |
| “Wide variety of healthy options available.” | “Packaging is not very eco-friendly.” |
| “Reliable brand with great customer service.” | “Some products contain more sugar than expected.” |
Overall, consumers praise General Mills for product quality and variety but often point out rising prices and sustainability issues as areas for improvement.
Risk Analysis
Below is a concise overview of key risks facing General Mills, Inc., categorized by type, along with their probability and potential impact:
| Category | Description | Probability | Impact |
|---|---|---|---|
| Financial Health | Moderate risk due to Altman Z-Score in grey zone (2.35), indicating some bankruptcy risk. | Medium | High |
| Debt Levels | Elevated debt-to-equity ratio (1.66) signals higher financial leverage and refinancing risk. | High | Medium |
| Liquidity | Low current (0.67) and quick ratios (0.43) imply potential short-term liquidity constraints. | Medium | Medium |
| Market Valuation | Price-to-book ratio (3.22) is unfavorable; stock might be overvalued relative to book value. | Medium | Medium |
| Competitive Market | Intense competition in packaged foods could pressure margins and growth. | High | High |
The most impactful risks are tied to General Mills’ financial leverage and competitive pressures. The company’s moderate Altman Z-Score warns of some financial distress risk, while high debt levels could constrain flexibility. Investors should monitor these factors carefully alongside stable dividend yield and decent profitability.
Should You Buy General Mills, Inc.?
General Mills, Inc. appears to be characterized by improving profitability and a durable competitive moat supported by growing ROIC. Despite a substantial leverage profile, its overall rating could be seen as very favorable, suggesting a balanced but cautious investment profile.
Strength & Efficiency Pillars
General Mills, Inc. exhibits solid profitability with a net margin of 11.78% and a return on equity (ROE) of 24.95%, underscoring efficient capital use. The company is a clear value creator, as its return on invested capital (ROIC) stands at 9.62%, comfortably above the weighted average cost of capital (WACC) at 4.13%. Financial health indicators are mixed but stable: the Altman Z-score at 2.35 places it in the grey zone, suggesting moderate bankruptcy risk, while a Piotroski score of 6 reflects average financial strength. Notably, the firm’s dividend yield of 4.52% adds to its appeal for income-focused investors.
Weaknesses and Drawbacks
Despite favorable profitability metrics, General Mills faces several headwinds. Its price-to-book (P/B) ratio of 3.22 is unfavorable, indicating potentially overvalued equity relative to book value. The company’s leverage is a concern, with a debt-to-equity (D/E) ratio of 1.66 and tight liquidity evidenced by a current ratio of 0.67 and quick ratio of 0.43, both unfavorable. Market-wise, the stock has suffered a 30.31% decline over the longer term with a bearish trend and accelerating downward momentum, reflecting seller dominance and investor caution despite a recent neutral buyer-seller balance.
Our Verdict about General Mills, Inc.
The long-term fundamental profile of General Mills appears favorable due to robust profitability and clear value creation. However, the ongoing bearish price trend and liquidity constraints suggest caution. Despite long-term strength, recent market pressures and valuation concerns might suggest a wait-and-see approach for a better entry point, especially given the company’s moderate financial distress signals. Investors could consider the company’s income potential and moat but should remain vigilant on its leverage and market volatility.
Disclaimer: This content is for informational purposes only and does not constitute financial, investment, or other professional advice. Investing in financial markets involves a significant risk of loss, and past performance is not indicative of future results.
Additional Resources
- TrueMark Investments LLC Buys 23,446 Shares of General Mills, Inc. $GIS – MarketBeat (Jan 24, 2026)
- What you need to know ahead of General Mills’ earnings release – MSN (Jan 23, 2026)
- General Mills: Buy This Turnaround While It’s Undervalued (NYSE:GIS) – Seeking Alpha (Jan 18, 2026)
- Deutsche Bank Keeps a Hold Rating on General Mills, Inc. (GIS) – Yahoo Finance (Jan 14, 2026)
- Rakuten Investment Management Inc. Buys New Holdings in General Mills, Inc. $GIS – MarketBeat (Jan 23, 2026)
For more information about General Mills, Inc., please visit the official website: generalmills.com