Home > Analyses > Industrials > General Dynamics Corporation
General Dynamics shapes national security and global aerospace through cutting-edge defense systems and business jets. Its leadership spans nuclear submarines, armored combat vehicles, and advanced IT mission solutions. Renowned for innovation and reliability, the company commands a vital role in defense modernization and aerospace excellence. As geopolitical tensions evolve, I question whether General Dynamics’ robust fundamentals still justify its premium valuation and growth outlook in 2026.

Table of contents
Business Model & Company Overview
General Dynamics Corporation, founded in 1899 and headquartered in Reston, Virginia, stands as a titan in the Aerospace & Defense sector. With 110K employees, it operates through four integrated segments—Aerospace, Marine Systems, Combat Systems, and Technologies—that together form a cohesive ecosystem delivering advanced defense and aerospace solutions worldwide.
Its revenue engine balances high-value hardware like nuclear submarines and combat vehicles with cutting-edge software and recurring services such as IT mission support and cloud computing. Serving global markets across the Americas, Europe, and Asia, General Dynamics leverages its competitive advantage in innovation and lifecycle support. This solidifies its economic moat and shapes the future of defense technology.
Financial Performance & Fundamental Metrics
I analyze General Dynamics Corporation’s income statement, key financial ratios, and dividend payout policy to assess its underlying financial health and shareholder returns.
Income Statement
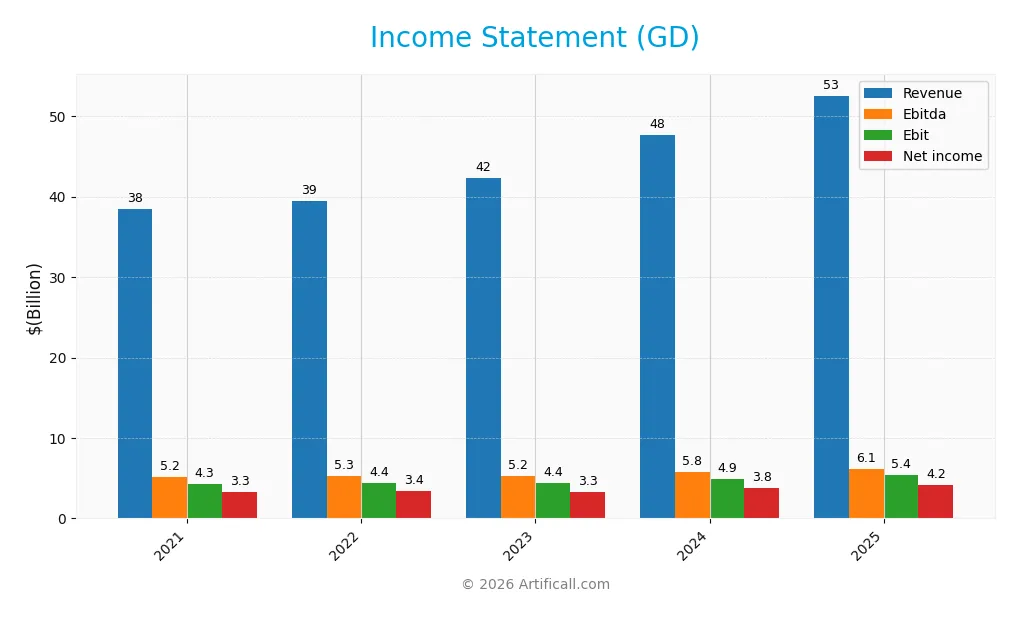
The table below summarizes General Dynamics Corporation’s key income statement figures for the fiscal years 2021 through 2025, expressed in USD.
| 2021 | 2022 | 2023 | 2024 | 2025 | |
|---|---|---|---|---|---|
| Revenue | 38.5B | 39.4B | 42.3B | 47.7B | 52.6B |
| Cost of Revenue | 32.1B | 32.8B | 35.6B | 40.4B | 44.6B |
| Operating Expenses | 2.2B | 2.4B | 2.4B | 2.6B | 2.6B |
| Gross Profit | 6.4B | 6.6B | 6.7B | 7.4B | 7.9B |
| EBITDA | 5.2B | 5.3B | 5.2B | 5.8B | 6.1B |
| EBIT | 4.3B | 4.4B | 4.4B | 4.9B | 5.4B |
| Interest Expense | 431M | 391M | 399M | 393M | 314M |
| Net Income | 3.3B | 3.4B | 3.3B | 3.8B | 4.2B |
| EPS | 11.61 | 12.31 | 12.14 | 13.81 | 15.64 |
| Filing Date | 2022-02-09 | 2023-02-07 | 2024-02-08 | 2025-02-07 | 2026-01-30 |
Income Statement Evolution
General Dynamics’ revenue rose steadily from $38.5B in 2021 to $52.6B in 2025, a 36.6% increase. Net income followed with a 29.3% gain to $4.2B. Gross margin remained stable near 15%, while EBIT and net margins improved, reflecting better operational efficiency despite a slight decline in net margin over the full period.
Is the Income Statement Favorable?
In 2025, fundamentals appear favorable. Revenue grew 10.1%, supported by a 7.97% gross profit increase. EBIT margin expanded to 10.3%, and interest expense was well controlled at 0.6% of revenue. Net margin rose modestly to 8.0%, with EPS jumping 13.4%, signaling solid profitability and effective cost management amidst rising operating expenses.
Financial Ratios
The table below presents key financial ratios for General Dynamics Corporation (GD) over the fiscal years 2021 to 2025, facilitating year-over-year performance comparison:
| Ratios | 2021 | 2022 | 2023 | 2024 | 2025 |
|---|---|---|---|---|---|
| Net Margin | 8.47% | 8.60% | 7.84% | 7.93% | 8.01% |
| ROE | 18.46% | 18.26% | 15.56% | 17.14% | 16.43% |
| ROIC | 9.35% | 9.36% | 9.01% | 10.02% | 10.66% |
| P/E | 18.0 | 20.1 | 21.4 | 19.3 | 21.6 |
| P/B | 3.31 | 3.68 | 3.33 | 3.31 | 3.55 |
| Current Ratio | 1.43 | 1.37 | 1.44 | 1.37 | 1.44 |
| Quick Ratio | 1.05 | 0.96 | 0.92 | 0.82 | 0.89 |
| D/E | 0.75 | 0.65 | 0.52 | 0.48 | 0.31 |
| Debt-to-Assets | 26.3% | 23.5% | 20.2% | 19.1% | 14.0% |
| Interest Coverage | 9.66 | 10.8 | 10.6 | 12.2 | 17.1 |
| Asset Turnover | 0.77 | 0.76 | 0.77 | 0.85 | 0.92 |
| Fixed Asset Turnover | 7.10 | 6.68 | 6.82 | 7.38 | 6.98 |
| Dividend Yield | 2.25% | 2.00% | 2.01% | 2.09% | 1.75% |
Evolution of Financial Ratios
General Dynamics’ Return on Equity (ROE) showed a slight decline from 18.5% in 2021 to 16.4% in 2025, indicating stable but modestly reduced profitability. The Current Ratio remained in a narrow range around 1.37 to 1.44, reflecting consistent liquidity. Debt-to-Equity Ratio improved significantly from 0.75 to 0.31, signaling stronger balance sheet leverage management.
Are the Financial Ratios Favorable?
In 2025, profitability ratios like ROE (16.4%) and ROIC (10.7%) remain favorable, exceeding the company’s 5.5% WACC comfortably. Liquidity ratios (Current Ratio 1.44, Quick Ratio 0.89) are neutral, suggesting adequate short-term financial health. Debt levels are favorable, with a low Debt-to-Equity of 0.31 and strong interest coverage at 17.3x. Market valuation ratios show mixed signals, with a neutral P/E of 21.6 but unfavorable Price-to-Book at 3.55. Overall, the financial ratios are slightly favorable.
Shareholder Return Policy
General Dynamics pays consistent dividends with a payout ratio near 38%, yielding around 1.75% annually. Dividend coverage by free cash flow remains healthy, supporting steady distributions without risking cash flow strain. The dividend per share shows a gradual increase over recent years.
The company also repurchases shares, complementing dividends to return capital. This balanced approach reflects prudent capital allocation. Overall, the policy supports sustainable long-term shareholder value while maintaining financial flexibility.
Score analysis
The following radar chart illustrates General Dynamics Corporation’s key financial scores across multiple valuation and profitability metrics:
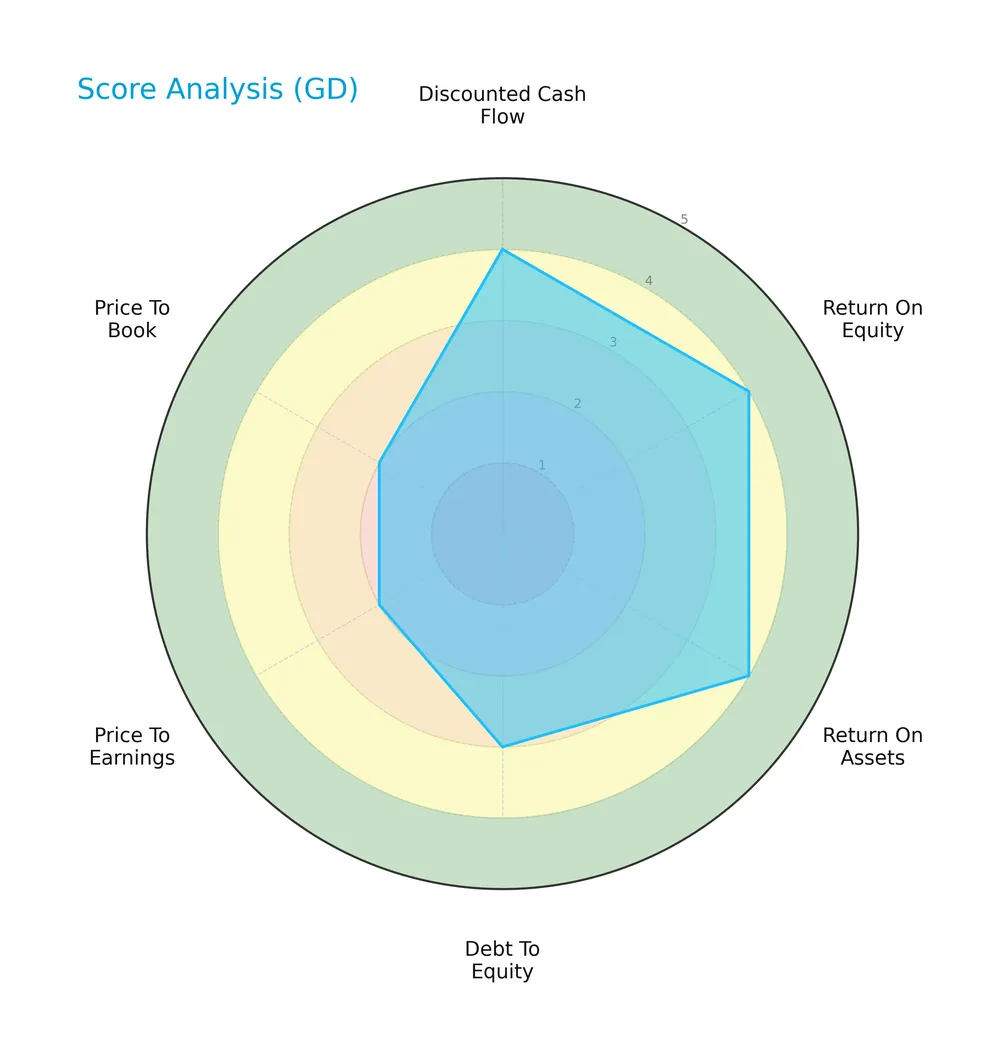
General Dynamics scores favorably on discounted cash flow, return on equity, and return on assets, each rated 4. Debt-to-equity holds a moderate score of 3, while price-to-earnings and price-to-book valuations sit lower at 2, indicating some valuation caution.
Analysis of the company’s bankruptcy risk
General Dynamics’ Altman Z-Score places it firmly in the safe zone, signaling a low risk of bankruptcy based on its financial health metrics:

Is the company in good financial health?
This Piotroski Score diagram highlights the company’s strong financial health and operational efficiency:

With a very strong Piotroski Score of 8, General Dynamics demonstrates robust profitability, solid leverage management, and efficient asset use, underscoring its sound financial position.
Competitive Landscape & Sector Positioning
This analysis explores General Dynamics Corporation’s strategic positioning within the aerospace and defense industry. It examines revenue by segment, key products, and main competitors shaping the sector. I will assess whether General Dynamics holds a sustainable competitive advantage over its peers.
Strategic Positioning
General Dynamics maintains a diversified portfolio across Aerospace, Marine Systems, Combat Systems, and Technologies, with significant revenue concentration in North America, particularly the US. This balanced exposure across segments and geographies supports resilience amid defense sector cycles.
Revenue by Segment
This pie chart illustrates General Dynamics Corporation’s revenue distribution by segment for the fiscal year 2025, detailing the core business units and their relative contributions.
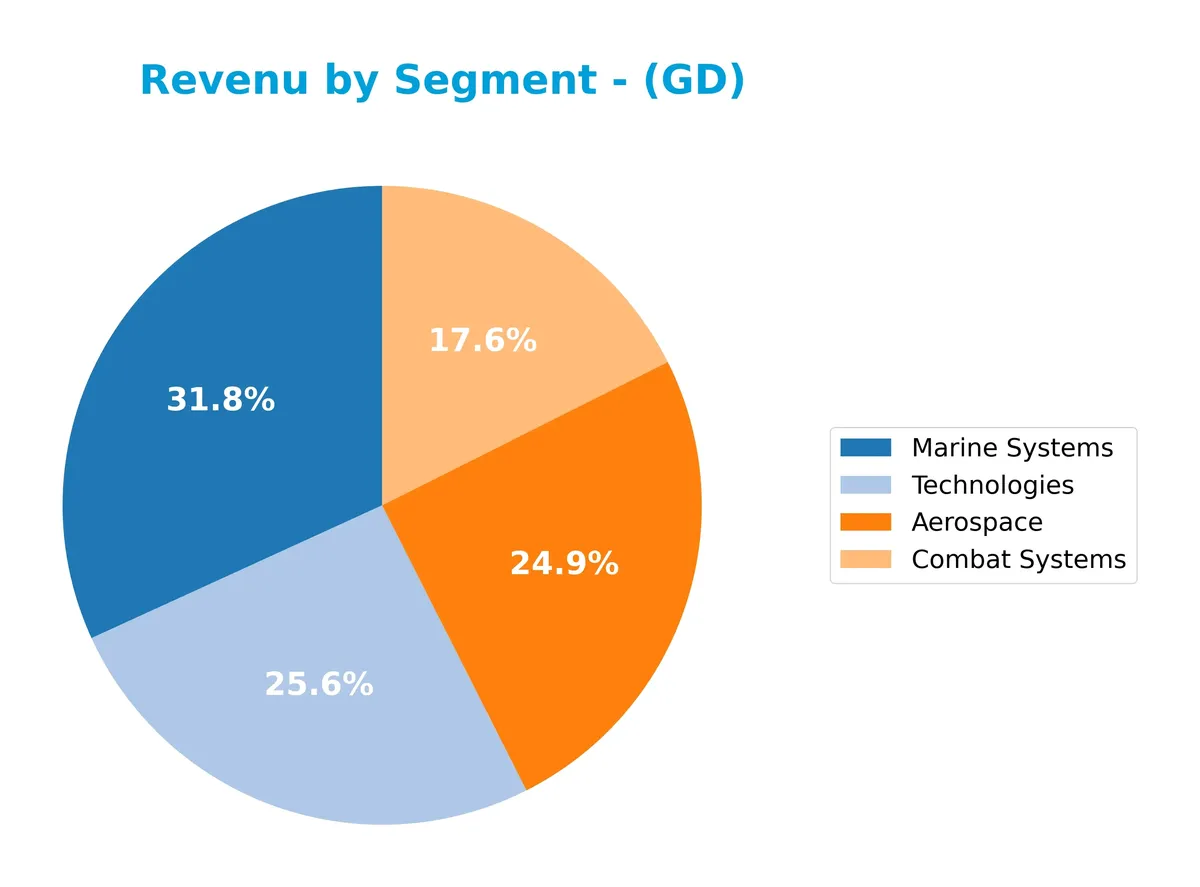
In 2025, Marine Systems leads with $16.7B, followed by Technologies at $13.5B and Aerospace at $13.1B. Combat Systems contributes $9.2B. The data reveals steady growth across all segments, particularly in Marine Systems and Aerospace. The concentration in Marine Systems signals a robust defense sector demand, while balanced growth in other divisions reduces concentration risk. This broad-based revenue expansion reflects solid strategic positioning.
Key Products & Brands
General Dynamics operates through four main segments with diverse aerospace and defense products and services:
| Product | Description |
|---|---|
| Aerospace | Designs and manufactures business jets; offers aircraft maintenance, repair, management, charter, and fixed-base operator services. |
| Marine Systems | Builds nuclear submarines, surface combatants, auxiliary ships for the U.S. Navy, commercial Jones Act ships, tankers, and cargo vessels; provides maintenance and modernization services. |
| Combat Systems | Produces wheeled and tracked combat vehicles, weapons systems, munitions, and armored vehicles; offers modernization and sustainment services. |
| Technologies | Provides IT solutions, mission support, mobile communications, command-and-control systems, intelligence and surveillance; delivers cloud computing, AI, and software-defined networks. |
General Dynamics covers critical defense sectors with strong product diversity and integrated service offerings supporting military and commercial clients globally.
Main Competitors
General Dynamics Corporation faces 12 competitors, with the table below listing the top 10 leaders by market capitalization:
| Competitor | Market Cap. |
|---|---|
| GE Aerospace | 338B |
| RTX Corporation | 251B |
| The Boeing Company | 171B |
| Lockheed Martin Corporation | 116B |
| General Dynamics Corporation | 93B |
| Northrop Grumman Corporation | 84B |
| TransDigm Group Incorporated | 77B |
| L3Harris Technologies, Inc. | 57B |
| Axon Enterprise, Inc. | 44B |
| BWX Technologies, Inc. | 17B |
General Dynamics ranks 5th among these competitors. Its market cap is 28.24% of the leader, GE Aerospace. The company sits below the average market cap of the top 10 (124.8B) but above the sector median (80B). It holds a 21.76% gap from the next competitor above, Lockheed Martin, indicating a moderate distance in scale.
Comparisons with competitors
Check out how we compare the company to its competitors:
Does GD have a competitive advantage?
General Dynamics demonstrates a very favorable competitive advantage, creating value with a ROIC exceeding WACC by 5.18%, and a strong upward ROIC trend of nearly 14% over 2021-2025. These metrics signal efficient capital use and sustainable profitability in aerospace and defense sectors.
The company’s global footprint, especially its dominant North American market, supports growth. Opportunities include expanding advanced technologies like AI, cloud computing, and unmanned vehicles, alongside ongoing naval and combat systems modernization programs.
SWOT Analysis
This SWOT analysis highlights General Dynamics Corporation’s key strategic factors to guide investment decisions.
Strengths
- Strong ROIC well above WACC
- Diverse product segments in aerospace and defense
- Solid revenue growth and favorable margins
Weaknesses
- Moderate current and quick ratios indicating liquidity caution
- Relatively high price-to-book ratio
- Net margin growth slightly declining over period
Opportunities
- Expansion in international defense markets
- Growth in IT and AI capabilities within Technologies segment
- Increasing demand for naval and combat systems modernization
Threats
- Geopolitical risks affecting defense budgets
- Intense competition in aerospace and defense
- Potential supply chain disruptions impacting production
General Dynamics shows a robust competitive moat with growing profitability and solid financial health. The company should leverage its technology and global expansion opportunities while managing liquidity and geopolitical risks prudently.
Stock Price Action Analysis
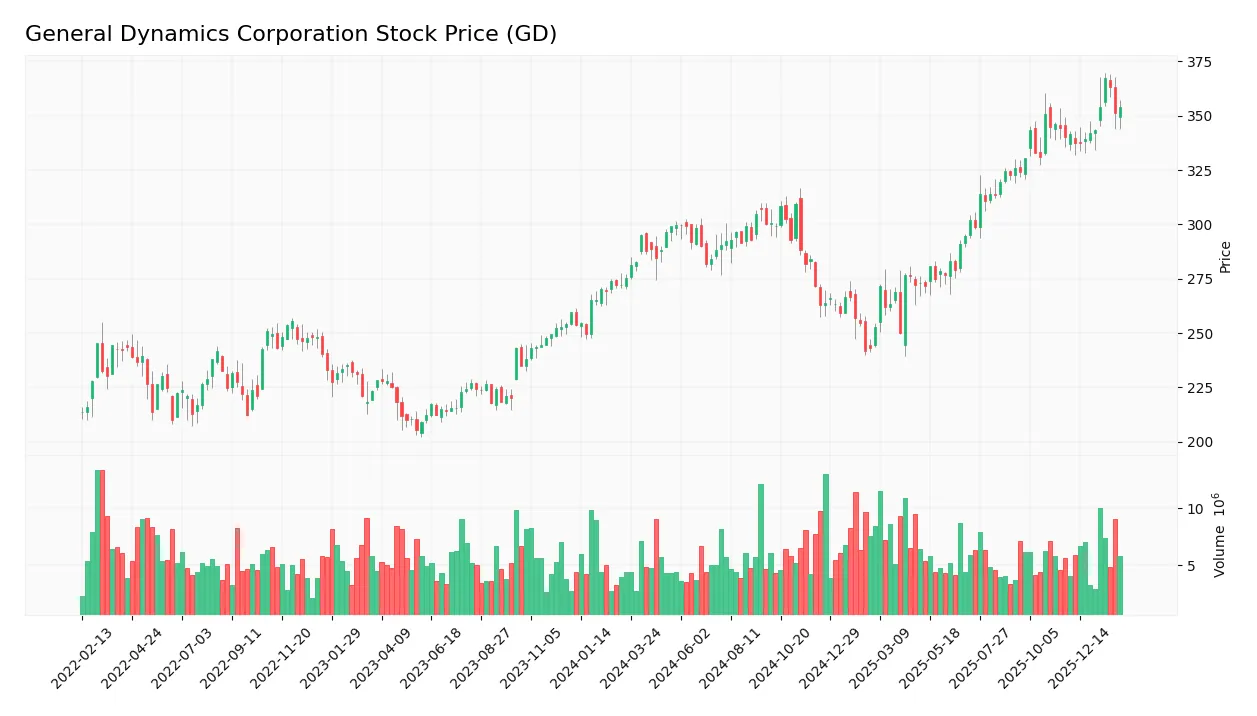
The weekly stock chart below illustrates General Dynamics Corporation’s price movements over the last 12 months, highlighting key highs and lows:
Trend Analysis
Over the past year, GD’s stock price rose 28.61%, confirming a bullish trend with accelerating momentum. The price ranged between 241.94 and 367.38, showing high volatility with a 29.2 standard deviation. The recent 3.99% gain since November 2025 also supports continued upward slope momentum.
Volume Analysis
Trading volumes increased noticeably, with buyers accounting for 59.08% of total activity, indicating buyer-driven demand. In the recent three-month span, buyer dominance strengthened to 64.97%, signaling growing investor confidence and higher market participation favoring upward price pressure.
Target Prices
I observe a confident consensus on General Dynamics Corporation’s target prices from reliable analysts.
| Target Low | Target High | Consensus |
|---|---|---|
| 385 | 444 | 404.22 |
Analysts expect GD shares to trade between $385 and $444, with a consensus target near $404, signaling moderate upside potential.

Don’t Let Luck Decide Your Entry Point
Optimize your entry points with our advanced ProRealTime indicators. You’ll get efficient buy signals with precise price targets for maximum performance. Start outperforming now!
Analyst & Consumer Opinions
This section reviews General Dynamics Corporation’s analyst ratings and consumer feedback to gauge market sentiment and reputation.
Stock Grades
Here are the latest verified analyst grades for General Dynamics Corporation from established firms:
| Grading Company | Action | New Grade | Date |
|---|---|---|---|
| Jefferies | Maintain | Hold | 2026-02-02 |
| B of A Securities | Maintain | Buy | 2026-01-30 |
| UBS | Maintain | Neutral | 2026-01-15 |
| Citigroup | Maintain | Neutral | 2026-01-13 |
| JP Morgan | Maintain | Overweight | 2025-12-19 |
| Morgan Stanley | Upgrade | Overweight | 2025-12-16 |
| Bernstein | Maintain | Market Perform | 2025-10-28 |
| JP Morgan | Maintain | Overweight | 2025-10-28 |
| B of A Securities | Maintain | Buy | 2025-10-28 |
| JP Morgan | Maintain | Overweight | 2025-10-27 |
The grades show a stable outlook with most firms maintaining Buy or Overweight ratings. Morgan Stanley notably upgraded its rating recently, indicating growing confidence in the stock’s prospects.
Consumer Opinions
General Dynamics Corporation receives mixed but insightful feedback from its consumer base. Here’s a snapshot of the prevailing sentiments:
| Positive Reviews | Negative Reviews |
|---|---|
| Reliable product quality and robust engineering | Customer service response times lag |
| Strong commitment to innovation in defense tech | Pricing perceived as high by some clients |
| Consistent delivery on contracts | Limited transparency on project updates |
| Solid reputation in aerospace and defense | Occasional delays in project timelines |
Overall, consumers praise General Dynamics for its engineering excellence and innovation. However, concerns about customer service speed and pricing recur, signaling areas for operational improvement.
Risk Analysis
Below is a table summarizing key risks facing General Dynamics Corporation and their likelihood and potential impact:
| Category | Description | Probability | Impact |
|---|---|---|---|
| Defense Budget Cuts | Reduced U.S. or allied defense spending could lower contract awards and revenue growth. | Medium | High |
| Supply Chain Disruptions | Delays or cost increases in raw materials and components may affect production schedules. | Medium | Medium |
| Regulatory Risk | Changes in government regulations or export controls could restrict business operations. | Low | Medium |
| Technological Obsolescence | Failure to innovate in defense tech or aerospace may erode competitive advantage. | Medium | High |
| Geopolitical Tensions | Escalating global conflicts could increase demand but also operational risks and costs. | Medium | Medium |
| Currency Fluctuations | Exchange rate volatility may impact international contract profitability and reporting. | Low | Low |
The most pressing risks for GD stem from defense budget volatility and technological obsolescence. Historically in aerospace and defense, budgets fluctuate with political cycles, directly impacting order flow. GD’s strong innovation focus mitigates tech risks, but failure to maintain this edge would harm its moat. Its Altman Z-Score of 4.26 confirms financial resilience amid these challenges.
Should You Buy General Dynamics Corporation?
General Dynamics appears to be a robust value creator with a very favorable moat, demonstrating growing ROIC above WACC. Despite moderate leverage, its strong operational efficiency supports a B+ rating, suggesting a financially sound profile with prudent risk management.
Strength & Efficiency Pillars
General Dynamics Corporation exhibits solid profitability and financial health. The company posts a favorable return on equity of 16.43% and a return on invested capital (ROIC) of 10.66%, comfortably above its weighted average cost of capital (WACC) at 5.48%, confirming it as a clear value creator. Its Altman Z-score of 4.26 places it firmly in the safe zone, indicating strong financial stability. Additionally, a Piotroski score of 8 signals very strong fundamentals and efficient capital allocation.
Weaknesses and Drawbacks
The valuation metrics present caution. General Dynamics trades at a price-to-book ratio of 3.55, flagged as unfavorable, suggesting a relatively high premium on net assets. The price-to-earnings ratio sits at a neutral 21.58, which while not excessive, demands continued earnings growth to justify. Liquidity ratios remain neutral but not robust, with a current ratio of 1.44 and quick ratio of 0.89. These figures warrant monitoring for potential short-term liquidity pressure, although leverage appears controlled with a debt-to-equity ratio of 0.31.
Our Verdict about General Dynamics Corporation
The company’s long-term fundamental profile is favorable, supported by strong profitability and financial health. The bullish overall stock trend and recent buyer dominance strengthen the outlook. This profile may appear attractive for long-term exposure, especially given the value-creating ROIC exceeding WACC. However, investors should remain mindful of valuation premiums and liquidity metrics as part of a prudent risk management approach.
Disclaimer: This content is for informational purposes only and does not constitute financial, investment, or other professional advice. Investing in financial markets involves a significant risk of loss, and past performance is not indicative of future results.
Additional Resources
- Cullen Capital Management LLC Sells 20,968 Shares of General Dynamics Corporation $GD – MarketBeat (Feb 05, 2026)
- General Dynamics Corporation (GD): A Bull Case Theory – Yahoo Finance (Feb 03, 2026)
- General Dynamics Corporation (NYSE:GD) Just Reported Annual Earnings: Have Analysts Changed Their Mind On The Stock? – simplywall.st (Feb 03, 2026)
- Analysts Have Made A Financial Statement On General Dynamics Corporation’s (NYSE:GD) Yearly Report – Yahoo Finance (Feb 03, 2026)
- Equity Investment Corp Reduces Stake in General Dynamics Corporation $GD – MarketBeat (Feb 04, 2026)
For more information about General Dynamics Corporation, please visit the official website: gd.com