Home > Analyses > Industrials > Generac Holdings Inc.
Generac Holdings Inc. powers millions of homes and businesses, ensuring uninterrupted energy in moments that matter most. It dominates the industrial machinery sector with its robust lineup of standby generators, portable power solutions, and clean energy systems. Known for innovation and quality, Generac shapes the future of energy resilience worldwide. As the energy landscape evolves, I ask: does Generac’s current valuation reflect its growth potential and operational strength?

Table of contents
Business Model & Company Overview
Generac Holdings Inc., founded in 1959 and headquartered in Waukesha, Wisconsin, leads the industrial machinery sector with its comprehensive power generation ecosystem. It integrates engines, alternators, batteries, and control systems into solutions ranging from residential standby generators to industrial emergency backup units. This cohesive product suite addresses diverse markets, from homes to healthcare and manufacturing, reinforcing its dominant industry position.
Generac’s revenue engine balances hardware sales with growing software and energy storage services, including its Mobile Link remote monitoring system and clean energy brands PWRcell and PWRview. Its global footprint spans the Americas, Europe, and Asia, leveraging broad distribution channels from dealers to e-commerce. I see its economic moat rooted in this integrated portfolio and strategic market reach, positioning it as a vital player shaping power resilience worldwide.
Financial Performance & Fundamental Metrics
I analyze Generac Holdings Inc.’s income statement, key financial ratios, and dividend payout policy to assess its profitability and capital efficiency.
Income Statement
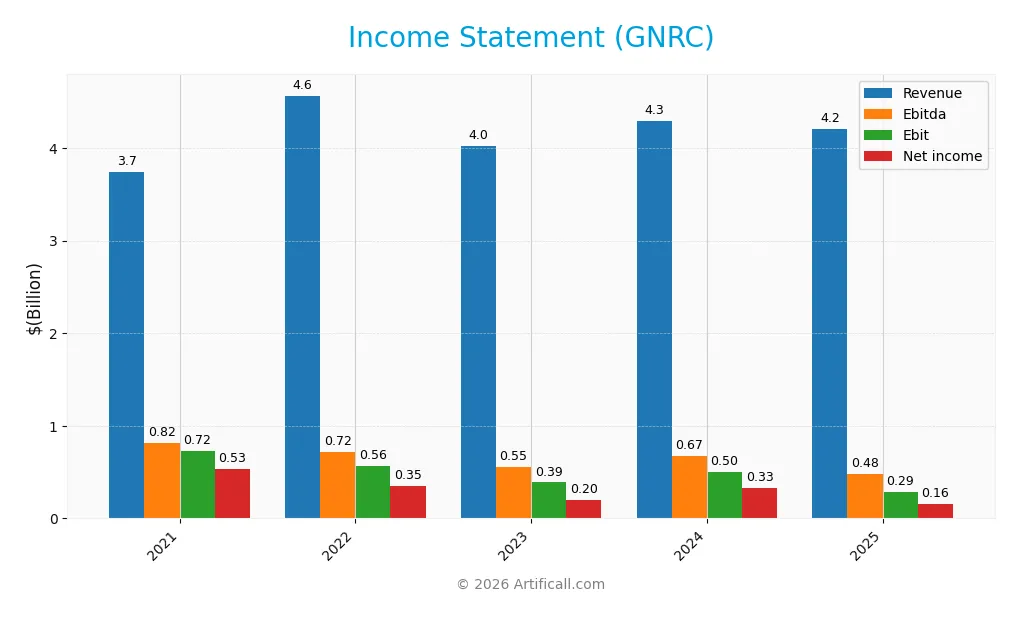
Below is the Income Statement for Generac Holdings Inc. (GNRC) showing key financial metrics for the past five fiscal years.
| 2021 | 2022 | 2023 | 2024 | 2025 | |
|---|---|---|---|---|---|
| Revenue | 3.74B | 4.56B | 4.02B | 4.30B | 4.21B |
| Cost of Revenue | 2.38B | 3.04B | 2.66B | 2.63B | 2.60B |
| Operating Expenses | 639M | 956M | 979M | 1.13B | 1.32B |
| Gross Profit | 1.36B | 1.52B | 1.37B | 1.67B | 1.61B |
| EBITDA | 817M | 719M | 555M | 671M | 484M |
| EBIT | 724M | 563M | 388M | 499M | 289M |
| Interest Expense | 33M | 55M | 98M | 90M | 71M |
| Net Income | 533M | 350M | 203M | 325M | 160M |
| EPS | 8.51 | 5.55 | 3.31 | 5.46 | 2.73 |
| Filing Date | 2022-02-22 | 2023-02-22 | 2024-02-21 | 2025-02-19 | 2026-02-18 |
Income Statement Evolution
From 2021 to 2025, revenue increased 12.6%, but net income declined sharply by 70.1%. The latest year saw a 2% revenue drop and a 50% net income plunge. Gross margin remained relatively stable and favorable at 38.3%, while net margin contracted significantly, reflecting deteriorating profitability and margin compression over the period.
Is the Income Statement Favorable?
In 2025, fundamentals appear unfavorable. EBIT margin stayed neutral at 6.9%, but EBIT fell 42% year-over-year. Interest expense improved favorably at 1.7% of revenue, yet net margin and EPS dropped nearly 50%. Operating expenses declined in line with revenue, but overall earnings weakness and margin erosion raise concerns about underlying operational challenges.
Financial Ratios
The table below summarizes key financial ratios for Generac Holdings Inc. (GNRC) over the last five fiscal years, providing a snapshot of profitability, liquidity, valuation, and leverage:
| Ratios | 2021 | 2022 | 2023 | 2024 | 2025 |
|---|---|---|---|---|---|
| Net Margin | 14.3% | 7.7% | 5.0% | 7.6% | 3.8% |
| ROE | 24.1% | 15.5% | 8.7% | 13.0% | 6.1% |
| ROIC | 15.3% | 10.7% | 6.7% | 9.9% | 5.3% |
| P/E | 41.4 | 18.1 | 39.0 | 28.4 | 50.0 |
| P/B | 10.0 | 2.8 | 3.4 | 3.7 | 3.0 |
| Current Ratio | 1.60 | 2.20 | 2.27 | 1.97 | 2.03 |
| Quick Ratio | 0.66 | 0.78 | 0.94 | 0.97 | 1.00 |
| D/E | 0.60 | 0.71 | 0.74 | 0.59 | 0.51 |
| Debt-to-Assets | 27.1% | 31.0% | 34.0% | 28.9% | 23.9% |
| Interest Coverage | 21.9x | 10.3x | 4.0x | 6.0x | 4.1x |
| Asset Turnover | 0.77 | 0.88 | 0.79 | 0.84 | 0.76 |
| Fixed Asset Turnover | 6.64 | 7.10 | 5.02 | 5.01 | 4.54 |
| Dividend Yield | 0.0% | 0.005% | 0.0% | 0.003% | 0.004% |
Evolution of Financial Ratios
From 2021 to 2025, Generac’s Return on Equity (ROE) steadily declined from 24.1% to 6.1%, signaling weakening profitability. The Current Ratio improved from 1.60 in 2021 to 2.03 in 2025, indicating enhanced liquidity. Debt-to-Equity remained relatively stable around 0.5 to 0.7, reflecting consistent leverage levels over the period.
Are the Financial Ratios Favorable?
In 2025, Generac’s profitability ratios, including net margin (3.8%) and ROE (6.1%), are unfavorable compared to sector norms. Liquidity is favorable with a Current Ratio above 2.0, while leverage metrics like Debt-to-Assets (24%) are also positive. Efficiency and coverage ratios remain neutral, but valuation multiples such as P/E (50.0) appear stretched. Overall, the financial ratios are slightly unfavorable.
Shareholder Return Policy
Generac Holdings Inc. maintains a minimal dividend payout ratio near 0.18%, with dividends per share rising slightly to $0.005 in 2025. The dividend yield remains negligible at 0.0037%, indicating dividends play a minor role in shareholder returns. The company engages in share buybacks, although the scale and impact are not detailed here.
This low payout, combined with modest free cash flow coverage, suggests cautious capital allocation. Historically, such conservative distributions align with retaining capital for growth or debt management. The current policy appears sustainable, balancing shareholder returns with reinvestment needs, supporting long-term value creation without overextending distributions.
Score analysis
The radar chart below illustrates key financial metrics evaluating Generac Holdings Inc.’s valuation and profitability:
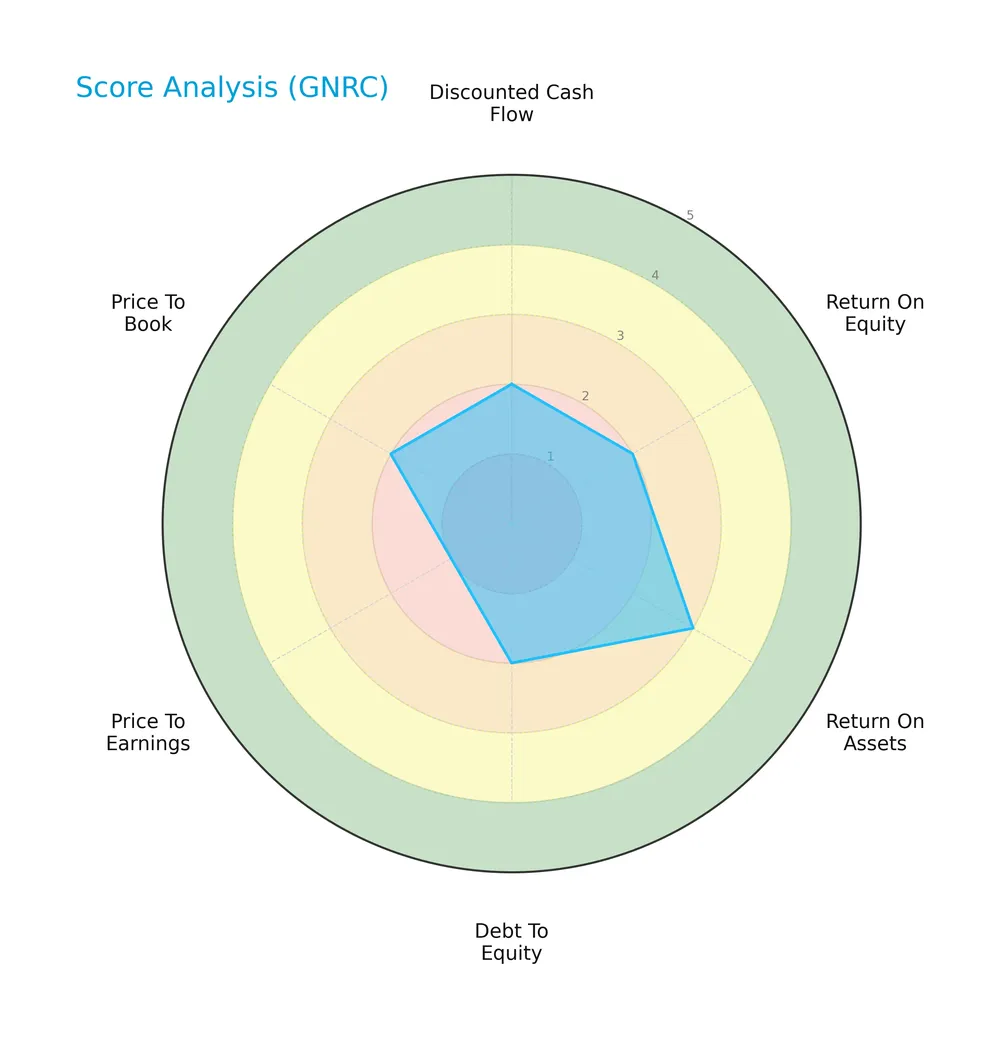
Generac shows moderate operational efficiency with a return on assets score of 3. However, discounted cash flow, return on equity, debt-to-equity, and price-to-book scores rank as unfavorable. The price-to-earnings score is very unfavorable, indicating valuation concerns.
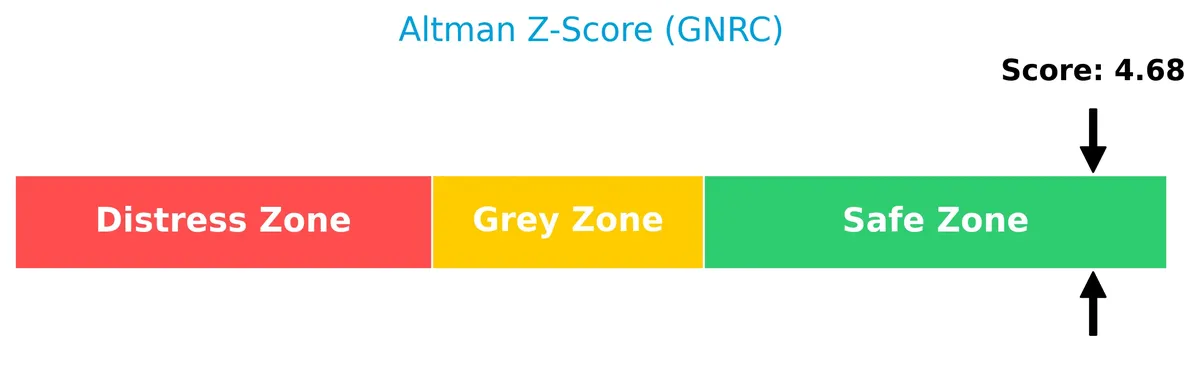
Analysis of the company’s bankruptcy risk
Generac Holdings Inc. is positioned in the safe zone according to its Altman Z-Score, suggesting a low likelihood of bankruptcy:
Is the company in good financial health?
The Piotroski Score diagram highlights Generac’s financial strength compared to peers:
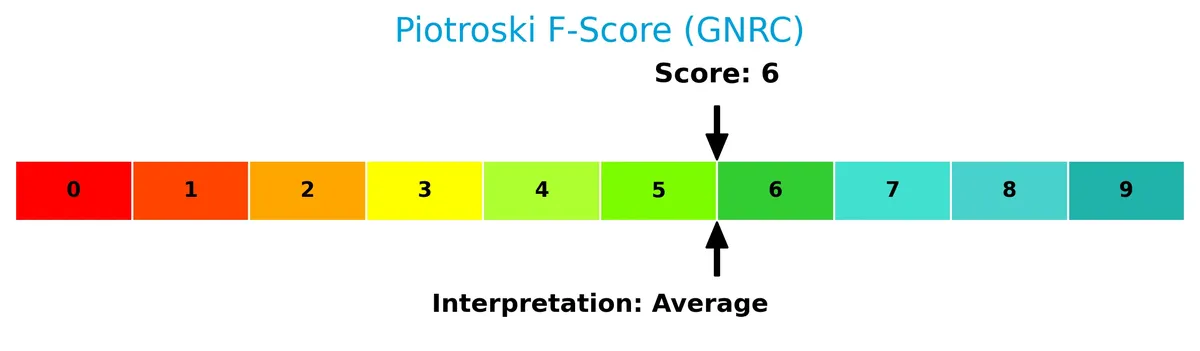
With a score of 6, Generac falls into the average category, indicating moderate financial health but room for improvement in profitability and efficiency metrics.
Competitive Landscape & Sector Positioning
This analysis reviews Generac Holdings Inc.’s strategic positioning, revenue segments, key products, and main competitors. I will assess whether Generac holds a competitive advantage in the industrial machinery sector.
Strategic Positioning
Generac Holdings Inc. concentrates on power generation equipment and clean energy solutions, serving residential, commercial, and industrial markets globally. Its diversified product portfolio spans standby generators, portable units, outdoor power equipment, and energy storage, distributed through dealers, retailers, and direct sales channels.
Revenue by Segment
This pie chart illustrates Generac Holdings Inc.’s revenue distribution by segment for the fiscal year 2025, highlighting the contribution of each product line.
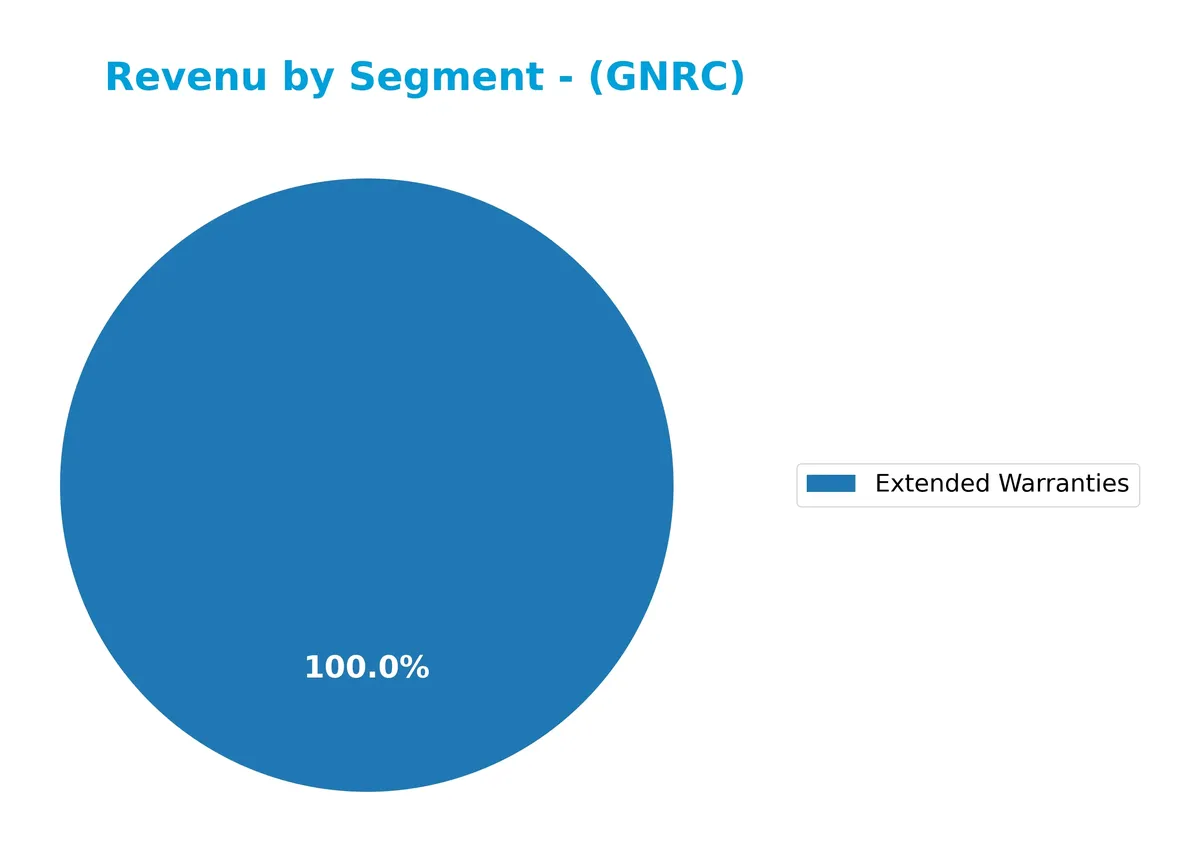
In 2025, the Extended Warranties segment generated 219M USD, reflecting a specialized revenue stream within Generac’s portfolio. While this segment contributes meaningfully, the absence of other segment data limits a full view of diversification. The concentration in Extended Warranties signals a niche focus, and investors should monitor for potential shifts or expansions in other segments to mitigate concentration risk.
Key Products & Brands
Generac Holdings Inc. offers a diverse range of power generation and outdoor equipment products and brands:
| Product | Description |
|---|---|
| Residential Standby Generators | Automatic generators with outputs from 7.5kW to 150kW for home backup power. |
| Air-Cooled Engine Generators | Residential standby units ranging from 7.5kW to 26kW. |
| Liquid-Cooled Engine Generators | Industrial and commercial generators with outputs from 22kW to 150kW. |
| Mobile Link | Remote monitoring system for home standby generators. |
| Portable Generators | Units ranging from 800W to 17.5kW for portable power needs. |
| Outdoor Power Equipment | Includes trimmers, mowers, log splitters, stump grinders, chipper shredders, and pressure washers. |
| PWRcell and PWRview | Clean energy solutions including energy storage and monitoring systems. |
| Light Towers and Mobile Generators | Equipment for mobile lighting and power generation. |
| Commercial Mobile Pumps and Dust-Suppression Equipment | Specialized equipment for industrial applications. |
| Gaseous-Engine Control Systems and Accessories | Controls and accessories for gaseous engines. |
| Light-Commercial Standby Generators | Generators from 22kW to 150kW with three-phase power for small and mid-sized businesses. |
| Industrial Generators | Emergency backup generators ranging from 10kW to 3,250kW for various commercial sectors. |
| Extended Warranties | Service contracts sold alongside products, generating $219M in revenue in FY 2025. |
Generac’s portfolio spans residential, commercial, and industrial power solutions, supported by complementary outdoor equipment and energy storage systems. This breadth serves diverse markets from homeowners to large enterprises.
Main Competitors
Generac Holdings Inc. faces competition from 24 companies in the Industrials sector. The table below lists the top 10 leaders by market capitalization:
| Competitor | Market Cap. |
|---|---|
| Eaton Corporation plc | 127B |
| Parker-Hannifin Corporation | 114B |
| Howmet Aerospace Inc. | 85B |
| Emerson Electric Co. | 76B |
| Illinois Tool Works Inc. | 73B |
| Cummins Inc. | 72B |
| AMETEK, Inc. | 48B |
| Roper Technologies, Inc. | 47B |
| Rockwell Automation, Inc. | 45B |
| Symbotic Inc. | 36B |
Generac Holdings Inc. ranks 19th among 24 competitors, with a market cap just over 10% of the sector leader Eaton Corporation. It sits well below both the average market cap of the top 10 (72B) and the sector median (32B). The company maintains a 27% gap to the next competitor above, indicating a notable scale difference within its peer group.
Comparisons with competitors
Check out how we compare the company to its competitors:
Does GNRC have a competitive advantage?
Generac Holdings Inc. currently lacks a competitive advantage, as it destroys value with a negative ROIC compared to WACC and a steeply declining profitability trend. The company’s economic moat is rated very unfavorable, indicating persistent challenges in capital efficiency.
Looking ahead, Generac’s diverse product portfolio spans power generation, energy storage, and clean energy solutions. Expansion into new markets and innovations like remote monitoring systems offer growth opportunities despite recent operational headwinds.
SWOT Analysis
This SWOT analysis highlights Generac Holdings Inc.’s key internal strengths and weaknesses alongside external opportunities and threats shaping its strategic outlook.
Strengths
- strong market position in power generation
- diverse product portfolio
- favorable current ratio
Weaknesses
- declining profitability and margins
- negative ROIC vs. WACC
- high valuation multiples (PE 50)
Opportunities
- growing demand for clean energy solutions
- expanding residential and commercial backup power needs
- innovation in energy storage systems
Threats
- intense industry competition
- economic slowdown impacting capital spending
- supply chain and raw material cost pressures
Generac’s robust market presence and product range provide a solid foundation. However, declining profitability and value destruction signal urgent strategic adjustments. The company must leverage clean energy trends while managing competitive and economic risks carefully.
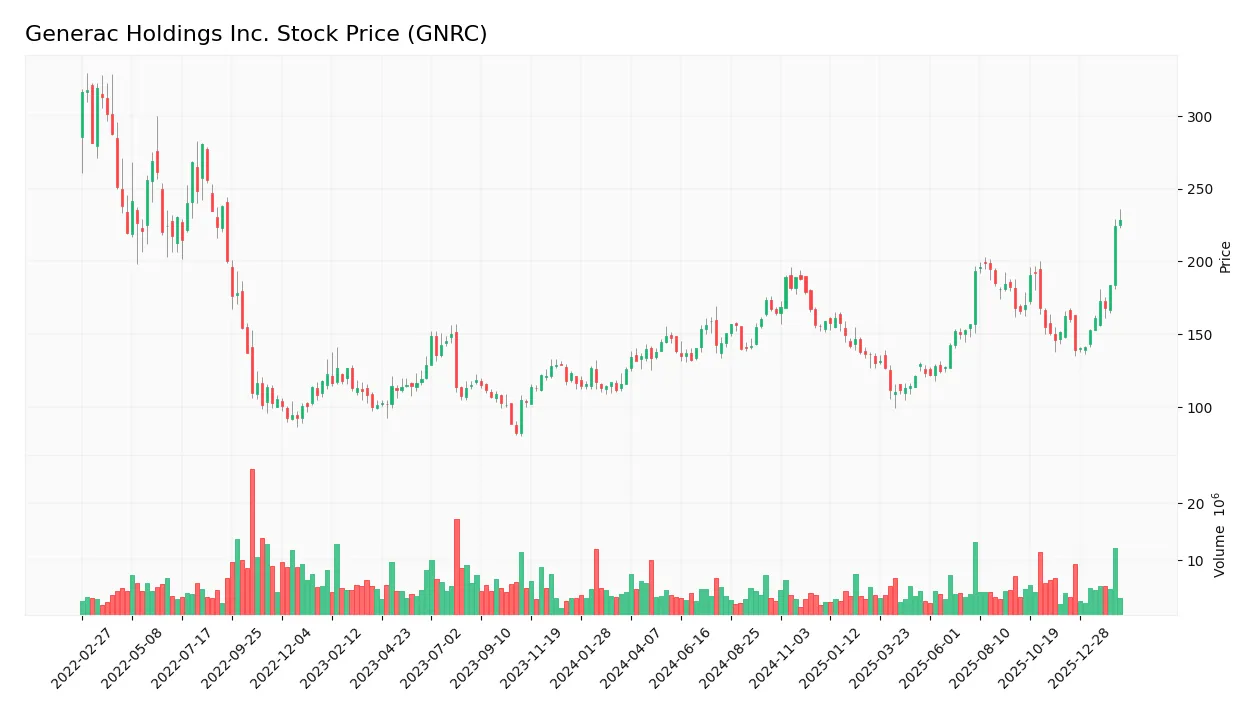
Stock Price Action Analysis
The weekly stock chart for Generac Holdings Inc. (GNRC) illustrates significant price movement and volatility over the past 100 weeks:
Trend Analysis
Over the past 100 weeks, GNRC’s stock price rose by 81.03%, indicating a bullish trend with clear acceleration. The price fluctuated between a low of 110.25 and a high of 228.35, with volatility measured by a standard deviation of 23.68.
Volume Analysis
Trading volumes have increased, with a total of 564M shares traded. Buyers accounted for 57%, suggesting buyer-driven activity. Recent months show stronger buyer dominance at 71%, reflecting rising investor interest and robust market participation.
Target Prices
Analysts set a robust target consensus for Generac Holdings Inc., reflecting confidence in its growth prospects.
| Target Low | Target High | Consensus |
|---|---|---|
| 195 | 292 | 239 |
The target range signals optimism, with the consensus price suggesting a meaningful upside from current levels. This aligns with sector growth trends and Generac’s strategic positioning.

Don’t Let Luck Decide Your Entry Point
Optimize your entry points with our advanced ProRealTime indicators. You’ll get efficient buy signals with precise price targets for maximum performance. Start outperforming now!
Analyst & Consumer Opinions
This section examines current analyst ratings and consumer feedback related to Generac Holdings Inc. (GNRC).
Stock Grades
Here are the latest verified stock grades for Generac Holdings Inc. from respected financial institutions:
| Grading Company | Action | New Grade | Date |
|---|---|---|---|
| Barclays | Maintain | Equal Weight | 2026-02-13 |
| Wells Fargo | Maintain | Overweight | 2026-02-12 |
| Guggenheim | Downgrade | Neutral | 2026-02-12 |
| Guggenheim | Maintain | Buy | 2026-02-10 |
| Barclays | Maintain | Equal Weight | 2026-01-20 |
| Canaccord Genuity | Maintain | Buy | 2026-01-13 |
| Baird | Upgrade | Outperform | 2026-01-09 |
| Citigroup | Upgrade | Buy | 2026-01-08 |
| B of A Securities | Maintain | Buy | 2026-01-07 |
| Wells Fargo | Upgrade | Overweight | 2025-12-19 |
The overall trend shows a predominance of Buy and Overweight ratings, with a few equal weight and neutral grades indicating some caution. Notably, Guggenheim recently downgraded its rating, suggesting a slight cooling in sentiment.
Consumer Opinions
Generac Holdings Inc. elicits strong reactions from its customer base, reflecting its vital role in home and industrial power solutions.
| Positive Reviews | Negative Reviews |
|---|---|
| Reliable backup power during outages | High cost of replacement parts |
| Easy-to-install generators with clear manuals | Customer service response times are slow |
| Durable build quality that withstands weather | Some users report occasional mechanical issues |
Overall, consumers praise Generac for its dependable and robust products, especially during critical power failures. However, concerns about pricey upkeep and service delays temper enthusiasm.
Risk Analysis
Below is a summary table outlining key risks facing Generac Holdings Inc., with their probability and impact assessments:
| Category | Description | Probability | Impact |
|---|---|---|---|
| Valuation Risk | Elevated P/E of 50.0 suggests the stock trades at a premium, increasing downside risk if growth slows. | High | High |
| Profitability Risk | Low net margin (3.8%) and ROE (6.1%) indicate limited profit generation relative to peers. | Medium | Medium |
| Capital Cost Risk | WACC at 11.5% far exceeds ROIC of 5.3%, signaling value destruction on invested capital. | High | High |
| Liquidity Risk | Quick ratio at 1.0 is borderline, limiting short-term financial flexibility in a crisis. | Medium | Medium |
| Debt Risk | Moderate debt-to-equity ratio (0.51) with interest coverage of 4.1x suggests manageable leverage. | Low | Low |
| Market Volatility | Beta of 1.81 exposes the stock to amplified market swings, increasing price volatility risk. | High | Medium |
| Competitive Risk | Industry cyclicality and technological shifts in power solutions could impact market share. | Medium | Medium |
The most significant risks are valuation and capital cost pressures. Generac’s P/E far exceeds the S&P 500 average near 22, implying high growth expectations. Yet, the company’s ROIC trails its WACC by more than 6 percentage points, a red flag for capital efficiency. This mismatch threatens shareholder value if growth disappoints. Additionally, the stock’s elevated beta signals above-average price swings, demanding disciplined risk management. While liquidity and debt levels appear manageable, investors should monitor profit margins closely as industrial machinery often faces margin compression during economic downturns. Overall, risks are slightly unfavorable but manageable with cautious positioning.
Should You Buy Generac Holdings Inc.?
Generac appears to show weakening profitability and a deteriorating competitive moat, suggesting value destruction despite a manageable debt profile. While the Altman Z-Score signals financial safety, the overall rating of C+ reflects moderate operational efficiency with notable challenges ahead.
Strength & Efficiency Pillars
Generac Holdings Inc. posts a gross margin of 38.29%, signaling robust operational efficiency. Its interest expense at 1.68% remains manageable, supporting earnings stability. Despite a modest net margin of 3.79% and ROE at 6.06%, the company’s Altman Z-Score of 4.68 places it firmly in the safe zone, underpinning financial stability. However, with ROIC at 5.29% falling below WACC of 11.48%, Generac is currently a value destroyer, indicating the firm struggles to generate returns exceeding its capital costs.
Weaknesses and Drawbacks
Generac faces serious valuation headwinds; its P/E ratio stands at a lofty 50.02, reflecting a premium that may not be justified by earnings. The price-to-book ratio of 3.03 adds to concerns over stretched valuation. While the current ratio of 2.03 is favorable, the quick ratio at 1.0 flags potential liquidity constraints under stress. Leverage remains moderate with a debt-to-equity of 0.51, but declining profitability and negative growth trends in net income and EPS underscore operational risks. These factors combine to temper enthusiasm despite safe solvency metrics.
Our Final Verdict about Generac Holdings Inc.
Generac’s profile might appear attractive due to its safe solvency and operational margins, but the company’s value destruction and stretched valuation raise caution flags. The bullish long-term price trend and strong buyer dominance suggest market confidence, yet the deteriorating profitability signals underlying challenges. Investors could consider a cautious stance, monitoring margin recovery and valuation normalization before committing to long-term exposure.
Disclaimer: This content is for informational purposes only and does not constitute financial, investment, or other professional advice. Investing in financial markets involves a significant risk of loss, and past performance is not indicative of future results.
Additional Resources
- Decoding Generac Holdings Inc (GNRC): A Strategic SWOT Insight – GuruFocus (Feb 19, 2026)
- Generac Holdings Inc. Earnings Missed Analyst Estimates: Here’s What Analysts Are Forecasting Now – Yahoo Finance (Feb 14, 2026)
- What’s Driving the Market Sentiment Around Generac Holdings Inc? – Sahm (Feb 16, 2026)
- Generac’s Q4 Earnings Call: Our Top 5 Analyst Questions – Finviz (Feb 18, 2026)
- Generac swings to Q4 loss as data center sales surge – MSN (Feb 16, 2026)
For more information about Generac Holdings Inc., please visit the official website: generac.com