Home > Analyses > Technology > Gen Digital Inc.
Gen Digital Inc. safeguards millions of users worldwide by fortifying their digital lives against evolving cyber threats. As a pioneer in cyber safety, its flagship Norton 360 platform integrates comprehensive protection across devices, complemented by innovative identity theft and privacy solutions. Renowned for blending cutting-edge technology with user trust, Gen Digital shapes the future of online security. Yet, with a dynamic market landscape, the key question remains: does its current valuation fully reflect its growth potential and resilience?

Table of contents
Business Model & Company Overview
Gen Digital Inc., founded in 1982 and headquartered in Tempe, Arizona, stands as a leader in the cyber safety solutions industry. Its ecosystem, anchored by Norton 360, integrates comprehensive protection across devices and platforms, blending identity theft safeguards with advanced privacy tools. This cohesive suite addresses the evolving digital threats faced by consumers worldwide. The company’s legacy and innovation drive its dominant market position in Software – Infrastructure.
The company’s revenue engine balances subscription-based services with software and hardware partnerships, generating steady cash flow from its broad portfolio, including Norton Secure VPN and Avira Security. Gen Digital’s footprint spans the Americas, Europe, Asia, and more, leveraging diverse sales channels from e-commerce to telecom providers. Its robust economic moat lies in its trusted brand and integrated cyber defense, shaping the future of personal digital security.
Financial Performance & Fundamental Metrics
I will analyze Gen Digital Inc.’s income statement, key financial ratios, and dividend payout policy to provide a clear picture of its fundamental health.
Income Statement
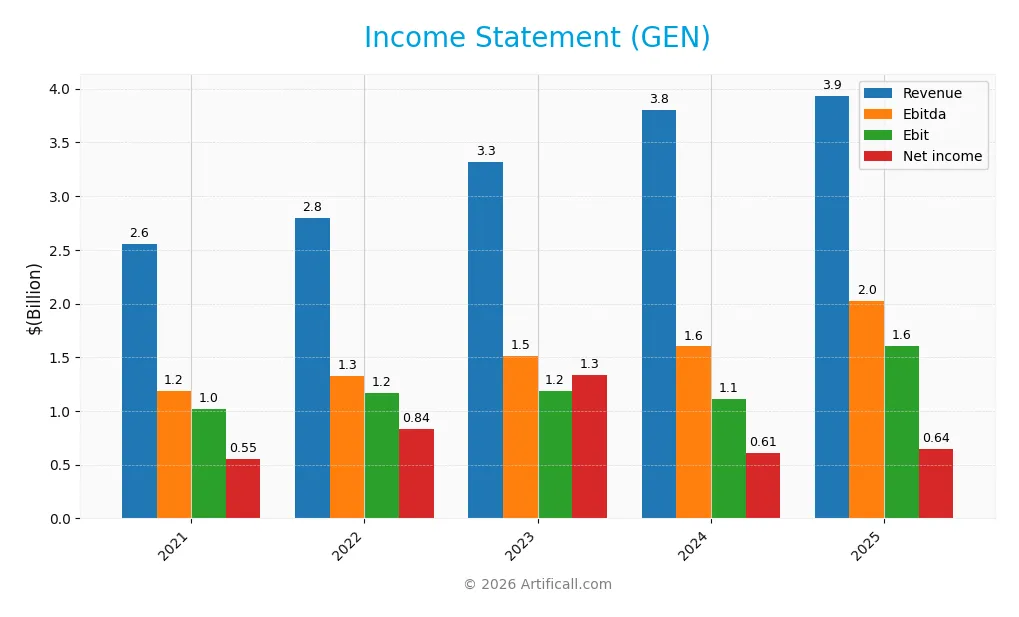
The following table presents Gen Digital Inc.’s key income statement figures over the last five fiscal years, providing a clear view of its financial performance.
| 2021 | 2022 | 2023 | 2024 | 2025 | |
|---|---|---|---|---|---|
| Revenue | 2.55B | 2.80B | 3.32B | 3.80B | 3.94B |
| Cost of Revenue | 362M | 408M | 589M | 731M | 776M |
| Operating Expenses | 1.29B | 1.38B | 1.52B | 1.96B | 1.55B |
| Gross Profit | 2.19B | 2.39B | 2.73B | 3.07B | 3.16B |
| EBITDA | 1.19B | 1.33B | 1.51B | 1.60B | 2.03B |
| EBIT | 1.02B | 1.17B | 1.18B | 1.12B | 1.61B |
| Interest Expense | 144M | 126M | 401M | 669M | 578M |
| Net Income | 554M | 836M | 1.33B | 607M | 643M |
| EPS | 0.94 | 1.44 | 2.17 | 0.95 | 1.04 |
| Filing Date | 2021-05-21 | 2022-05-20 | 2023-05-25 | 2024-05-16 | 2025-05-15 |
Income Statement Evolution
From 2021 to 2025, Gen Digital Inc. demonstrated a favorable revenue growth of 54.25%, with revenues rising from $2.55B to $3.94B. Net income also grew by 16.06% over this period, although net margin declined by 24.76%, indicating some margin compression. Gross margin remained strong and stable around 80%, while EBIT margin improved significantly, reflecting operational efficiency.
Is the Income Statement Favorable?
In fiscal 2025, Gen Digital reported $3.94B in revenue with a gross margin of 80.28% and EBIT margin at 40.84%, both classified as favorable. Net margin stood at 16.34%, showing modest growth but tempered by an unfavorable interest expense ratio of 14.69%. Overall, 64.29% of key income metrics were favorable, supporting a generally positive fundamental income statement assessment.
Financial Ratios
The table below presents key financial ratios for Gen Digital Inc. over the fiscal years 2021 to 2025, offering a clear snapshot of the company’s financial performance and position:
| Ratios | 2021 | 2022 | 2023 | 2024 | 2025 |
|---|---|---|---|---|---|
| Net Margin | 21.7% | 29.9% | 40.2% | 16.0% | 16.3% |
| ROE | -110.8% | -898.9% | 60.6% | 28.4% | 28.3% |
| ROIC | 15.7% | 16.5% | 9.0% | 8.4% | 7.8% |
| P/E | 22.6 | 18.4 | 7.9 | 23.4 | 25.4 |
| P/B | -25.0 | -165.7 | 4.8 | 6.6 | 7.2 |
| Current Ratio | 0.72 | 0.74 | 0.43 | 0.50 | 0.51 |
| Quick Ratio | 0.72 | 0.74 | 0.43 | 0.50 | 0.51 |
| D/E | -7.39 | -41.17 | 4.46 | 4.04 | 3.66 |
| Debt-to-Assets | 58.1% | 55.1% | 61.6% | 54.8% | 53.7% |
| Interest Coverage | 6.22 | 7.98 | 3.01 | 1.66 | 2.79 |
| Asset Turnover | 0.40 | 0.40 | 0.21 | 0.24 | 0.25 |
| Fixed Asset Turnover | 16.6 | 20.9 | 27.9 | 32.5 | 36.1 |
| Dividend Yield | 2.98% | 1.97% | 2.98% | 2.27% | 1.92% |
Evolution of Financial Ratios
Over the period, Gen Digital Inc.’s Return on Equity (ROE) remained strong and relatively stable, with a slight improvement to 28.34% in 2025. The Current Ratio showed consistent weakness, hovering around 0.5, indicating limited short-term liquidity. The Debt-to-Equity Ratio remained high, near 3.66 in 2025, reflecting elevated leverage and increased financial risk. Profitability margins displayed moderate stability with net margin around 16.34%.
Are the Financial Ratios Favorable?
In 2025, profitability indicators such as net margin (16.34%) and ROE (28.34%) were favorable, demonstrating efficient profit generation. Liquidity ratios, including Current and Quick Ratios (~0.51), were unfavorable, signaling potential short-term financial constraints. Leverage ratios, including Debt-to-Equity (3.66) and Debt-to-Assets (53.66%), were unfavorable, indicating high indebtedness. Asset turnover was low at 0.25, unfavorable for operational efficiency. Market valuation ratios like P/E (25.36) and P/B (7.19) were also unfavorable, while fixed asset turnover (36.1) was favorable. Overall, the ratio profile is slightly unfavorable.
Shareholder Return Policy
Gen Digital Inc. maintains a consistent dividend payment with a payout ratio around 48-67% over recent years and a dividend yield near 1.9-3%. Dividend coverage by free cash flow is strong, supported by share buybacks, indicating balanced capital returns.
This policy reflects a focus on sustainable distributions backed by solid profitability and cash flow. While leverage levels are elevated, the combined dividend and buyback approach appears aligned with long-term shareholder value creation under current financial conditions.
Score analysis
The radar chart below presents a comprehensive view of Gen Digital Inc.’s key financial scores for evaluation:
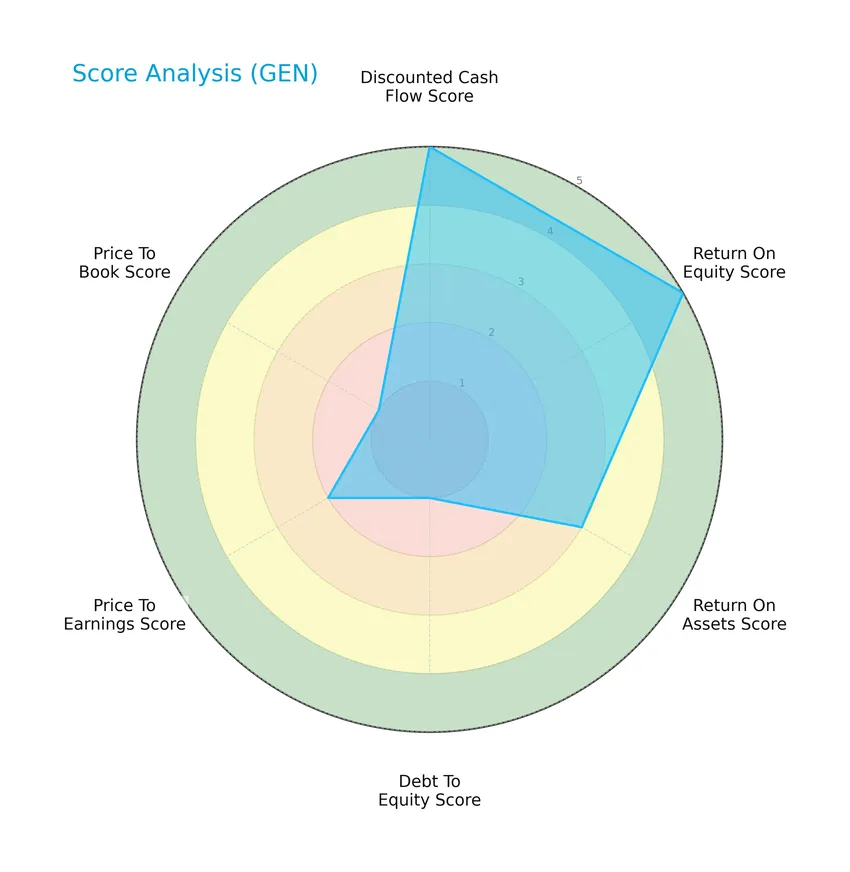
Gen Digital Inc. shows very favorable scores in discounted cash flow and return on equity, a moderate score in return on assets and price-to-earnings, but very unfavorable scores in debt-to-equity and price-to-book ratios, indicating mixed financial metrics.
Analysis of the company’s bankruptcy risk
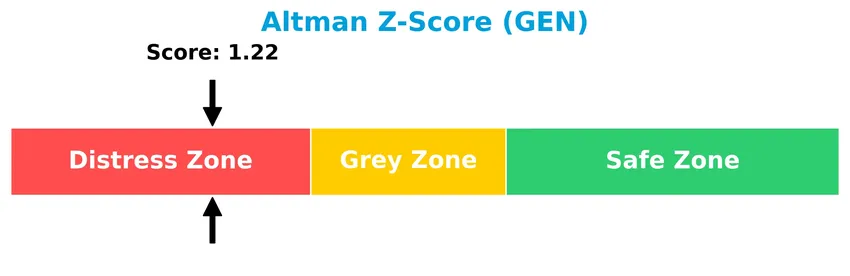
The Altman Z-Score places Gen Digital Inc. in the distress zone, signaling a high risk of financial distress and potential bankruptcy:
Is the company in good financial health?
The Piotroski Score diagram provides insight into Gen Digital Inc.’s overall financial strength:

With a Piotroski Score of 6, Gen Digital Inc. is considered to have average financial health, reflecting moderate profitability, leverage, and liquidity conditions.
Competitive Landscape & Sector Positioning
This sector analysis will explore Gen Digital Inc.’s strategic positioning, revenue by segment, key products, main competitors, competitive advantages, and SWOT analysis. I will assess whether Gen Digital holds a competitive advantage over its industry peers.
Strategic Positioning
Gen Digital Inc. maintains a concentrated product portfolio focused on cyber safety solutions, including Norton 360 and LifeLock identity protection, with core revenues around 3.9B USD in 2025. Geographically, it is diversified across Americas (2.6B USD), EMEA (953M USD), and Asia Pacific (395M USD), reflecting broad international market exposure.
Revenue by Segment
This pie chart illustrates Gen Digital Inc.’s revenue distribution by product segment for the fiscal year 2025.
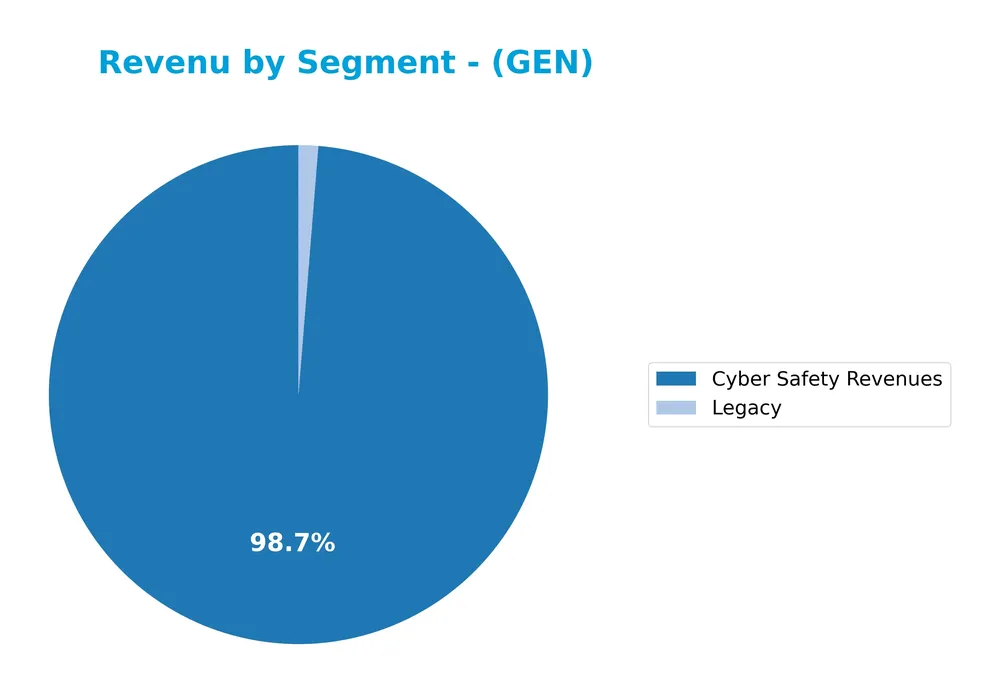
In 2025, Cyber Safety Revenues dominated with $3.9B, showing a steady increase from previous years and confirming its critical role in the company’s portfolio. The Legacy segment remains marginal, contributing only $50M, indicating a possible phase-out or limited growth. Compared to 2024, where Core Consumer Security and LifeLock Identity and Fraud Protection combined to a significant share, 2025 data highlights a concentration risk as Cyber Safety Revenues appear to be the primary growth driver.
Key Products & Brands
The following table summarizes Gen Digital Inc.’s key products and brands with their respective descriptions:
| Product | Description |
|---|---|
| Norton 360 | An integrated cybersecurity platform providing subscription-based protection for PCs, Macs, and mobile devices against malware, viruses, ransomware, and other threats. |
| LifeLock Identity Theft Protection | Offers identity monitoring, alerts, and restoration services to protect customers from identity theft and fraud. |
| Norton Secure VPN | A virtual private network solution that secures online privacy through encrypted data tunnels. |
| Privacy Monitor Assistant | A white glove service assisting members in removing personal information from data brokers online. |
| Home Title Protect | Detects title fraud and notifies members to prevent unauthorized home ownership changes. |
| Avira Security | A portfolio of consumer cybersecurity and privacy solutions. |
| Dark Web Monitoring | Monitors the Dark Web for personal information exposure of Norton 360 members. |
| Social Media Monitoring | Monitors social media accounts for account takeovers, risky activities, and inappropriate content. |
| AntiTrack | Protects privacy by blocking trackers and disguising digital fingerprints during browsing. |
| Online Reputation Management | Manages online search results, personal branding, and digital privacy. |
Gen Digital’s product lineup centers on comprehensive cyber safety and identity protection, leveraging subscription services and advanced privacy tools to address consumer security needs globally.
Main Competitors
Gen Digital Inc. faces competition from 32 companies in its sector, with the table below listing the top 10 leaders by market capitalization:
| Competitor | Market Cap. |
|---|---|
| Microsoft Corporation | 3.52T |
| Oracle Corporation | 553B |
| Palantir Technologies Inc. | 383B |
| Adobe Inc. | 140B |
| Palo Alto Networks, Inc. | 120B |
| CrowdStrike Holdings, Inc. | 113B |
| Synopsys, Inc. | 92B |
| Cloudflare, Inc. | 69B |
| Fortinet, Inc. | 59B |
| Block, Inc. | 40B |
Gen Digital Inc. ranks 18th among 32 competitors in the software infrastructure industry. Its market capitalization is approximately 0.45% that of the leader, Microsoft Corporation. The company is positioned below both the average market cap of the top 10 competitors (508B) and the sector median (18.8B). It maintains a 5.55% market cap advantage over its closest competitor above.
Comparisons with competitors
Check out how we compare the company to its competitors:
Does GEN have a competitive advantage?
Gen Digital Inc. currently does not present a competitive advantage, as its return on invested capital (ROIC) is below its weighted average cost of capital (WACC), indicating value destruction and declining profitability. The company’s ROIC trend over 2021-2025 is negative, reflecting a deterioration in capital efficiency and economic moat.
Looking ahead, Gen Digital offers a broad portfolio of cyber safety products across multiple regions, including Americas, EMEA, and Asia Pacific, with steady revenue growth and expanding market presence. Its ongoing development of integrated security solutions and identity protection services may provide new opportunities in global cybersecurity markets.
SWOT Analysis
This SWOT analysis highlights the key internal and external factors impacting Gen Digital Inc.’s current market position and strategic outlook.
Strengths
- strong EBIT margin at 40.84%
- diversified global revenue streams
- recognized brand with Norton and LifeLock
Weaknesses
- high debt-to-equity ratio at 3.66
- low liquidity ratios (current and quick at 0.51)
- declining ROIC trend and value destruction
Opportunities
- growing global demand for cybersecurity
- expansion in emerging markets like Asia Pacific
- innovation in privacy and identity protection services
Threats
- intense competition in cybersecurity sector
- regulatory changes affecting data privacy
- cyber threats evolving rapidly and increasing
Overall, Gen Digital benefits from robust profitability and a strong product portfolio but faces financial leverage and profitability challenges. Strategic focus should prioritize debt reduction, innovation, and expanding presence in emerging markets to offset competitive and regulatory risks.
Stock Price Action Analysis
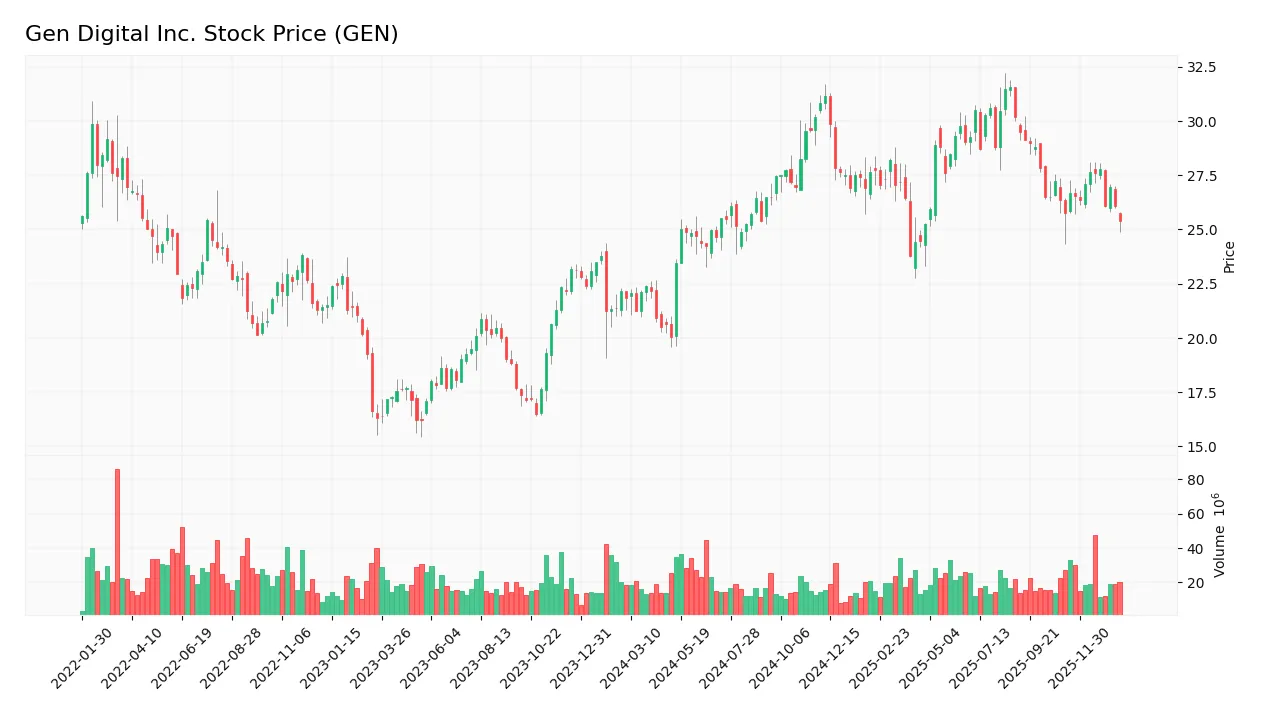
The weekly stock chart for Gen Digital Inc. (GEN) illustrates price movements and volume trends over the past 12 months:
Trend Analysis
Over the past 12 months, GEN’s stock price increased by 16.4%, indicating a bullish trend with deceleration. The stock showed volatility with a standard deviation of 2.56, reaching a high of 31.58 and a low of 20.03. However, recent weeks (Nov 2025 to Jan 2026) reflect a slight negative change of -1.4%, suggesting a neutral short-term trend.
Volume Analysis
In the last three months, trading volume for GEN has been decreasing overall. Buyer volume accounted for 37.21%, while sellers dominated with 62.79%, indicating a seller-driven market sentiment. This lower activity suggests cautious investor participation and possible reluctance to commit at current price levels.
Target Prices
Analysts present a clear target consensus for Gen Digital Inc., indicating potential price movement expectations.
| Target High | Target Low | Consensus |
|---|---|---|
| 32 | 31 | 31.5 |
The target prices suggest a narrow range with a consensus around 31.5, reflecting moderate optimism among analysts for Gen Digital Inc.’s near-term performance.

Don’t Let Luck Decide Your Entry Point
Optimize your entry points with our advanced ProRealTime indicators. You’ll get efficient buy signals with precise price targets for maximum performance. Start outperforming now!
Analyst & Consumer Opinions
This section reviews the latest analyst ratings and consumer feedback related to Gen Digital Inc. (GEN).
Stock Grades
The latest grades for Gen Digital Inc. from recognized financial institutions are summarized in the following table:
| Grading Company | Action | New Grade | Date |
|---|---|---|---|
| RBC Capital | Maintain | Sector Perform | 2025-11-07 |
| Evercore ISI Group | Maintain | Outperform | 2025-11-07 |
| Morgan Stanley | Maintain | Equal Weight | 2025-09-02 |
| Barclays | Maintain | Equal Weight | 2025-08-08 |
| Wells Fargo | Maintain | Overweight | 2025-08-08 |
| RBC Capital | Maintain | Sector Perform | 2025-08-08 |
| Barclays | Maintain | Equal Weight | 2025-07-14 |
| RBC Capital | Maintain | Sector Perform | 2025-05-07 |
| Morgan Stanley | Maintain | Equal Weight | 2025-04-16 |
| RBC Capital | Maintain | Sector Perform | 2025-01-31 |
Overall, the grades for Gen Digital demonstrate a consistent pattern of stability, with most firms maintaining their previous ratings. The consensus leans towards a moderate buy stance, reflecting cautious optimism among analysts.
Consumer Opinions
Consumer sentiment about Gen Digital Inc. reflects a mix of appreciation for its innovation and some concerns about service consistency.
| Positive Reviews | Negative Reviews |
|---|---|
| “Gen Digital offers cutting-edge security solutions that truly protect my devices.” | “Customer support response times can be frustratingly slow.” |
| “Their user interface is intuitive and easy to navigate.” | “Subscription pricing feels a bit high compared to competitors.” |
| “Reliable performance with regular updates keeps me confident in their products.” | “Occasional software bugs have caused minor disruptions.” |
Overall, consumers praise Gen Digital for its innovative and reliable products, while some express frustration with customer service and pricing, indicating areas for potential improvement.
Risk Analysis
Below is a table summarizing key risks facing Gen Digital Inc., including their likelihood and potential impact on the company:
| Category | Description | Probability | Impact |
|---|---|---|---|
| Financial Health | Altman Z-Score in distress zone (1.22) signals elevated bankruptcy risk due to leverage. | High | High |
| Leverage & Debt | High debt-to-equity ratio (3.66) and debt-to-assets (53.66%) raise solvency concerns. | High | High |
| Liquidity | Low current and quick ratios (0.51) indicate short-term liquidity constraints. | Medium | Medium |
| Valuation | Unfavorable P/E (25.36) and P/B (7.19) ratios may limit upside and increase valuation risk. | Medium | Medium |
| Operational Risk | Beta of 1.08 suggests moderate stock price volatility relative to market fluctuations. | Medium | Medium |
| Market Competition | Cybersecurity sector is highly competitive with rapid innovation demands and evolving threats. | Medium | High |
| Regulatory Risk | Data privacy regulations globally may increase compliance costs and operational complexity. | Low | High |
The most critical risks for Gen Digital stem from its financial leverage and liquidity pressures, as indicated by the distress-level Altman Z-Score and unfavorable debt metrics. These factors increase bankruptcy risk despite strong profitability ratios. Investors should monitor debt management closely alongside sector competition and regulatory changes.
Should You Buy Gen Digital Inc.?
Gen Digital Inc. appears to be characterized by moderate profitability and a deteriorating competitive moat, suggesting value erosion and declining operational efficiency. Despite a challenging leverage profile, its overall B rating could be seen as reflecting a cautiously favorable investment case.
Strength & Efficiency Pillars
Gen Digital Inc. exhibits solid profitability with a net margin of 16.34% and a return on equity (ROE) of 28.34%, underscoring effective capital utilization. The company’s weighted average cost of capital (WACC) stands at 7.82%, slightly above its return on invested capital (ROIC) of 7.77%, indicating that Gen Digital is currently not a value creator. Financial health metrics are mixed: an Altman Z-score of 1.22 places it in the distress zone, signaling elevated bankruptcy risk, while a Piotroski score of 6 suggests average financial strength. Operational efficiency is supported by a strong fixed asset turnover ratio of 36.1.
Weaknesses and Drawbacks
Gen Digital’s valuation metrics raise concerns; a price-to-earnings (P/E) ratio of 25.36 and price-to-book (P/B) ratio of 7.19 reflect a premium market valuation that may not be fully justified given its financial risks. Leverage is notably high, with a debt-to-equity ratio of 3.66 and a low current ratio of 0.51, indicating liquidity constraints and increased solvency risk. Market pressure is evident in the recent seller-dominant trend, where buyers represent only 37.21%, creating near-term headwinds despite an overall bullish price trend. Interest expense remains elevated at 14.69% of income, further stressing financial flexibility.
Our Verdict about Gen Digital Inc.
Gen Digital’s long-term fundamental profile might appear moderately favorable due to solid profitability and operational efficiency, yet it is weighed down by financial distress signals and high leverage. Despite the overall bullish stock trend, recent seller dominance and deteriorating liquidity suggest a wait-and-see approach could be prudent for those considering entry. The profile may appeal to investors willing to tolerate elevated risk in exchange for potential upside, but caution is advised given the company’s current value destruction and financial vulnerabilities.
Disclaimer: This content is for informational purposes only and does not constitute financial, investment, or other professional advice. Investing in financial markets involves a significant risk of loss, and past performance is not indicative of future results.
Additional Resources
- Wall Street Bullish on Gen Digital Inc. (GEN), Here’s Why – Yahoo Finance UK (Jan 23, 2026)
- QRG Capital Management Inc. Sells 109,111 Shares of Gen Digital Inc. $GEN – MarketBeat (Jan 23, 2026)
- Gen Digital Inc. Stock Underperforms Tuesday When Compared To Competitors – 富途资讯 (Jan 20, 2026)
- Gen Digital: Moving Beyond Antivirus To Capture The Fintech Wallet (NASDAQ:GEN) – Seeking Alpha (Jan 05, 2026)
- RSI Alert: Gen Digital Now Oversold – Nasdaq (Jan 21, 2026)
For more information about Gen Digital Inc., please visit the official website: gendigital.com