Home > Analyses > Utilities > GE Vernova Inc.
GE Vernova electrifies the future by transforming how energy powers homes and industries. As a pioneer in renewable utilities, it leads with cutting-edge wind turbine technology, versatile power generation, and innovative grid solutions. Its diverse portfolio spans hydro, nuclear, solar, and storage, shaping a cleaner energy landscape. Yet, as the market evolves rapidly, I ask: does GE Vernova’s growth and innovation still justify its premium valuation today?
Table of contents
Business Model & Company Overview
GE Vernova Inc., founded in 2023 and headquartered in Cambridge, MA, stands as a dominant force in renewable utilities. Its integrated ecosystem spans Power, Wind, and Electrification segments, delivering electricity through hydro, gas, nuclear, and steam, while manufacturing wind turbine blades and providing advanced grid and storage solutions. This cohesive mission drives a sustainable energy future with a workforce of 76,800.
The company’s revenue engine balances hardware sales, such as wind blades, with recurring services in grid solutions and power conversion. GE Vernova commands strategic footprints across the Americas, Europe, and Asia, fueling global energy transition. Its economic moat lies in a comprehensive platform that blends generation, innovation, and electrification to shape the future of renewable energy.
Financial Performance & Fundamental Metrics
I will analyze GE Vernova Inc.’s income statement, key financial ratios, and dividend payout policy to assess its overall financial health and investment appeal.
Income Statement
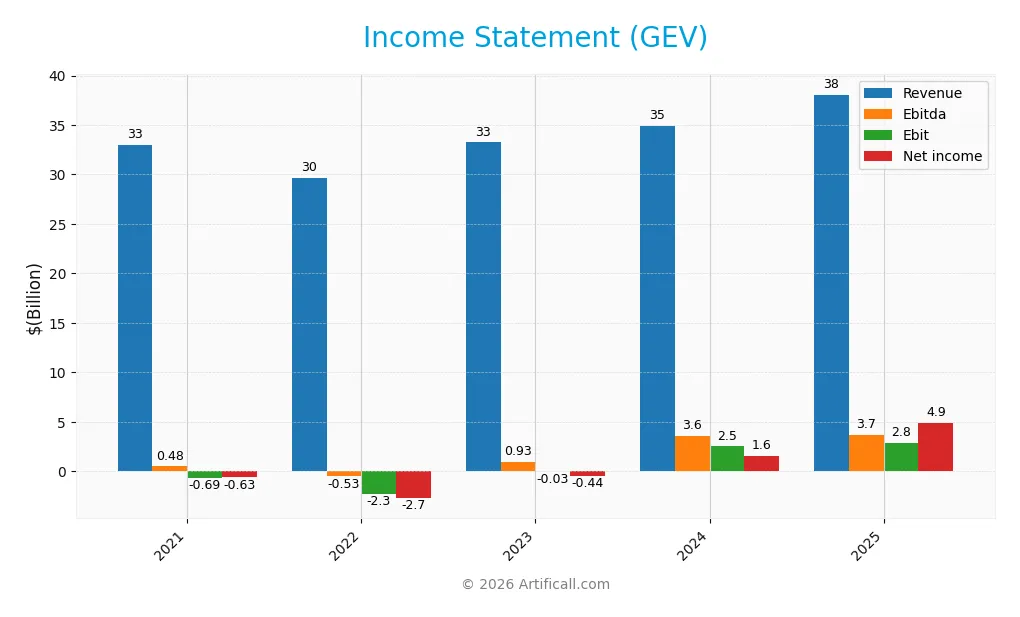
The table below presents GE Vernova Inc.’s income statement highlights for fiscal years 2021 through 2025, showing revenue growth and profitability trends.
| 2021 | 2022 | 2023 | 2024 | 2025 | |
|---|---|---|---|---|---|
| Revenue | 33B | 29.7B | 33.2B | 34.9B | 38.1B |
| Cost of Revenue | 28.1B | 26.2B | 28.4B | 28.6B | 30.5B |
| Operating Expenses | 5.8B | 6.3B | 5.7B | 5.5B | 6.1B |
| Gross Profit | 4.9B | 3.5B | 4.8B | 6.3B | 7.5B |
| EBITDA | 484M | -526M | 932M | 3.6B | 3.7B |
| EBIT | -692M | -2.3B | -32M | 2.5B | 2.8B |
| Interest Expense | 172M | 151M | 98M | 0 | 0 |
| Net Income | -633M | -2.7B | -438M | 1.6B | 4.9B |
| EPS | -2.33 | -10.06 | -1.61 | 5.64 | 17.92 |
| Filing Date | 2021-12-31 | 2022-12-31 | 2024-03-08 | 2025-02-06 | 2026-01-29 |
Income Statement Evolution
GE Vernova Inc. shows strong revenue growth, rising 15.3% over 2021-2025, with a notable 8.9% increase from 2024 to 2025. Net income surged dramatically, reversing losses to reach $4.88B in 2025. Margins reflect improvement: gross margin remains stable near 19.8%, while net margin expanded significantly to 12.8%, signaling enhanced profitability.
Is the Income Statement Favorable?
The 2025 income statement reveals solid fundamentals. Revenue growth outpaced operating expenses, though opex growth slightly offsets margin gains. EBIT margin sits at a neutral 7.4%, supported by zero interest expense and strong net interest income. Net margin growth and EPS growth exceed 200%, confirming robust earnings quality. Overall, the income statement presents a favorable financial profile.
Financial Ratios
Below is a summary of key financial ratios for GE Vernova Inc. over the period 2022-2025, reflecting profitability, valuation, liquidity, leverage, and efficiency:
| Ratios | 2022 | 2023 | 2024 | 2025 |
|---|---|---|---|---|
| Net Margin | -9.2% | -1.3% | 4.4% | 12.8% |
| ROE | -25.7% | -5.9% | 16.3% | 43.7% |
| ROIC | -15.4% | -5.7% | 1.4% | 6.3% |
| P/E | -13.1 | -81.5 | 58.3 | 36.4 |
| P/B | 3.35 | 4.82 | 9.48 | 15.9 |
| Current Ratio | 1.0 | 0.94 | 1.08 | 0.98 |
| Quick Ratio | 0.74 | 0.69 | 0.83 | 0.73 |
| D/E | 0.11 | 0.16 | 0.11 | 0 |
| Debt-to-Assets | 2.6% | 2.6% | 2.1% | 0 |
| Interest Coverage | -19.1 | -9.4 | 0 | 0 |
| Asset Turnover | 0.67 | 0.72 | 0.68 | 0.60 |
| Fixed Asset Turnover | 5.81 | 6.36 | 6.78 | 6.34 |
| Dividend Yield | 0% | 0% | 0.08% | 0.15% |
Evolution of Financial Ratios
Return on Equity (ROE) at GE Vernova Inc. surged remarkably to 43.7% in 2025 from negative territory in 2023. The Current Ratio declined from 1.08 in 2024 to 0.98 in 2025, indicating tightening liquidity. Debt-to-Equity Ratio improved significantly to zero in 2025, reflecting a debt-free capital structure. Profitability showed strong improvement with net margins climbing to 12.8%.
Are the Financial Ratios Favorable?
In 2025, profitability metrics such as net margin and ROE are favorable, signaling robust earnings generation. Liquidity ratios like current (0.98) and quick (0.73) fall below 1, marking potential short-term liquidity concerns. Leverage is minimal, with zero debt-to-equity and debt-to-assets ratios, supported by infinite interest coverage. Market valuation ratios including P/E (36.4) and P/B (15.9) appear stretched. Overall, the ratios present a slightly favorable financial profile.
Shareholder Return Policy
GE Vernova Inc. maintains a modest dividend payout ratio near 5.6%, with dividends rising from $0.25 in 2024 to $1.01 in 2025. The annual dividend yield remains low at 0.15%, supported by free cash flow coverage and supplemented by share buybacks.
This conservative distribution aligns with sustainable long-term value creation, balancing shareholder returns and reinvestment. The low yield and payout mitigate risks of unsustainable payouts or excessive buybacks, reflecting prudence amidst moderate profit margins and leverage.
Score analysis
Here is a radar chart illustrating GE Vernova Inc.’s key financial scores across multiple valuation and performance metrics:
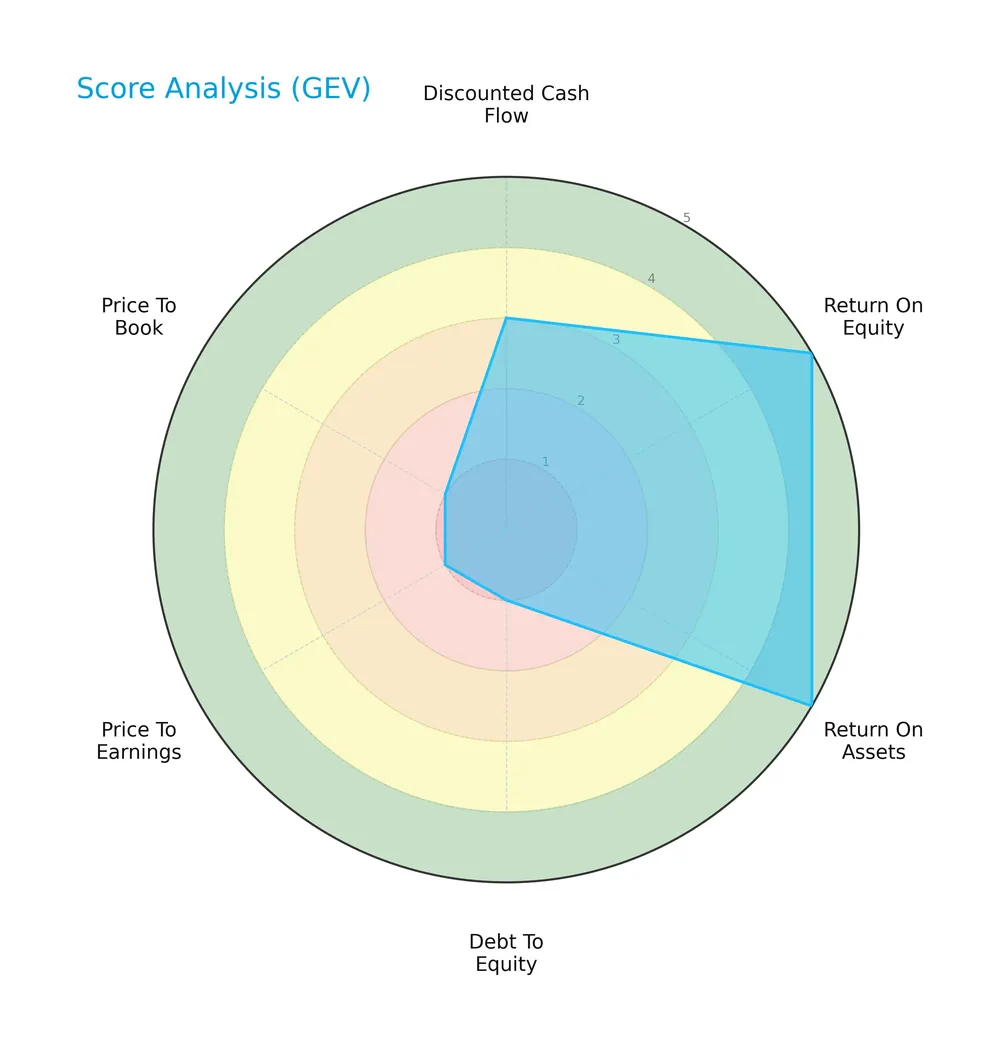
The company scores very favorably on return on equity and assets, indicating strong profitability. However, it faces significant challenges with debt-to-equity, price-to-earnings, and price-to-book ratios, which are very unfavorable. The discounted cash flow score remains moderate.
Analysis of the company’s bankruptcy risk
GE Vernova Inc. is positioned in the safe zone according to its Altman Z-Score, indicating a low risk of bankruptcy and financial distress:

Is the company in good financial health?
The following Piotroski diagram reveals the company’s financial health based on nine specific criteria:

With a strong Piotroski Score of 7, GE Vernova demonstrates solid financial strength, suggesting effective management of profitability, liquidity, and leverage factors. This level indicates a relatively healthy financial condition.
Competitive Landscape & Sector Positioning
This sector analysis will explore GE Vernova Inc.’s strategic positioning, revenue segments, key products, and main competitors. I will assess whether GE Vernova holds a competitive advantage over its peers in the renewable utilities industry.
Strategic Positioning
GE Vernova Inc. maintains a diversified portfolio across three energy segments: Power, Wind, and Electrification. Its geographic exposure spans the U.S. and multiple international regions, with nearly 55% of 2025 revenue generated outside the U.S., reflecting balanced global market participation.
Revenue by Segment
The pie chart displays GE Vernova Inc.’s revenue distribution by segment for fiscal year 2025, highlighting the relative contributions of Product and Service lines.
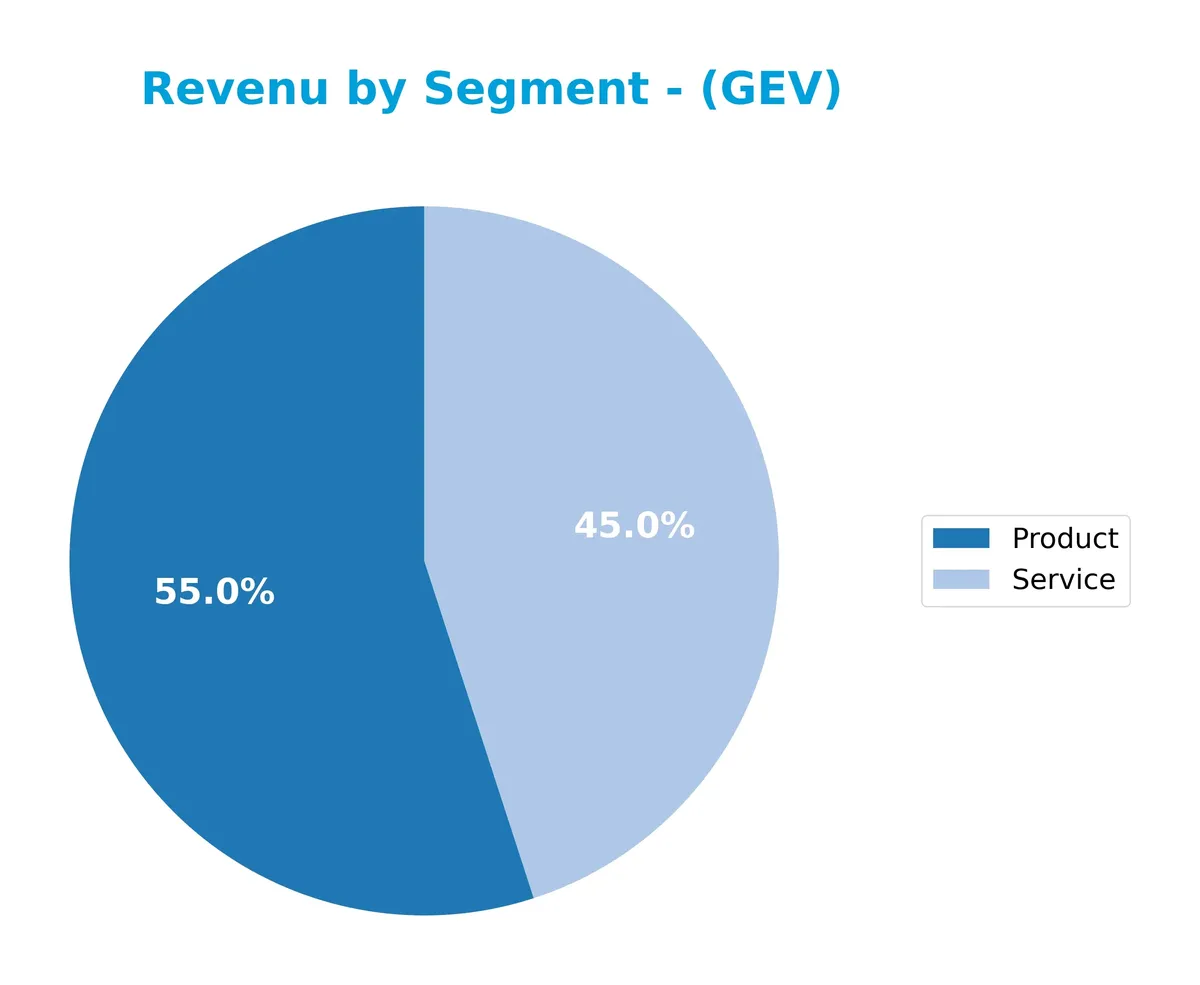
In 2025, GE Vernova’s Product segment generated $20.9B, outpacing Services at $17.1B. Both segments grew from 2024, with Product revenue rising by $2.4B and Services by $1.3B. The business remains balanced but leans slightly toward Products, reflecting robust industrial demand. This steady growth signals solid operational execution, though investors should monitor concentration risks as Services maintain a significant share.
Key Products & Brands
GE Vernova’s core offerings span electricity generation and energy solutions across three main segments:
| Product | Description |
|---|---|
| Power | Generates and sells electricity via hydro, gas, nuclear, and steam power sources. |
| Wind | Manufactures and sells wind turbine blades for renewable energy production. |
| Electrification | Provides grid solutions, power conversion, solar, and energy storage technologies. |
| Product Sales | Includes hardware and equipment sales, generating $21B in revenue in FY 2025. |
| Service Sales | Covers maintenance, support, and energy solutions services, accounting for $17.1B in FY 2025. |
GE Vernova integrates traditional and renewable energy products with service solutions, reflecting a balanced revenue mix between hardware and services.
Main Competitors
There are 3 competitors in total, with the table listing the top 3 leaders by market capitalization:
| Competitor | Market Cap. |
|---|---|
| GE Vernova Inc. | 184B |
| Constellation Energy Corporation | 114B |
| NuScale Power Corporation | 4.2B |
GE Vernova Inc. ranks 1st among its competitors, with a market cap 8.2% above the sector leader benchmark. It stands well above both the average market cap of the top 10 and the median market cap in the renewable utilities sector. The company holds a significant 74.4% market cap lead over its closest competitor below.
Comparisons with competitors
Check out how we compare the company to its competitors:
Does GEV have a competitive advantage?
GE Vernova Inc. does not present a competitive advantage as its ROIC falls below its WACC, indicating value destruction despite stable profitability. This unfavorable moat status suggests the company struggles to generate returns above its capital costs.
Looking ahead, GEV benefits from diversified operations in power, wind, and electrification, with expanding revenues across global markets. New grid solutions, solar, and storage offerings position the company to capture growth opportunities in renewable utilities.
SWOT Analysis
This SWOT analysis highlights GE Vernova Inc.’s core internal capabilities and external conditions shaping its strategic outlook.
Strengths
- Strong net margin at 12.8%
- Robust revenue growth over 15% annually
- Zero debt with infinite interest coverage
Weaknesses
- ROIC below WACC signals value destruction
- High valuation multiples (PE 36.4, PB 15.9)
- Weak liquidity ratios (current 0.98, quick 0.73)
Opportunities
- Expanding renewable energy demand globally
- Growth in non-US markets exceeding US sales
- Innovation in wind and grid solutions segments
Threats
- Intense competition in renewable utilities
- Regulatory risks in multiple jurisdictions
- Volatile commodity and energy prices
GE Vernova benefits from strong profitability and growth but must address its value destruction and liquidity gaps. The company’s strategy should prioritize improving capital efficiency and managing financial risks while leveraging global renewable energy expansion.
Stock Price Action Analysis
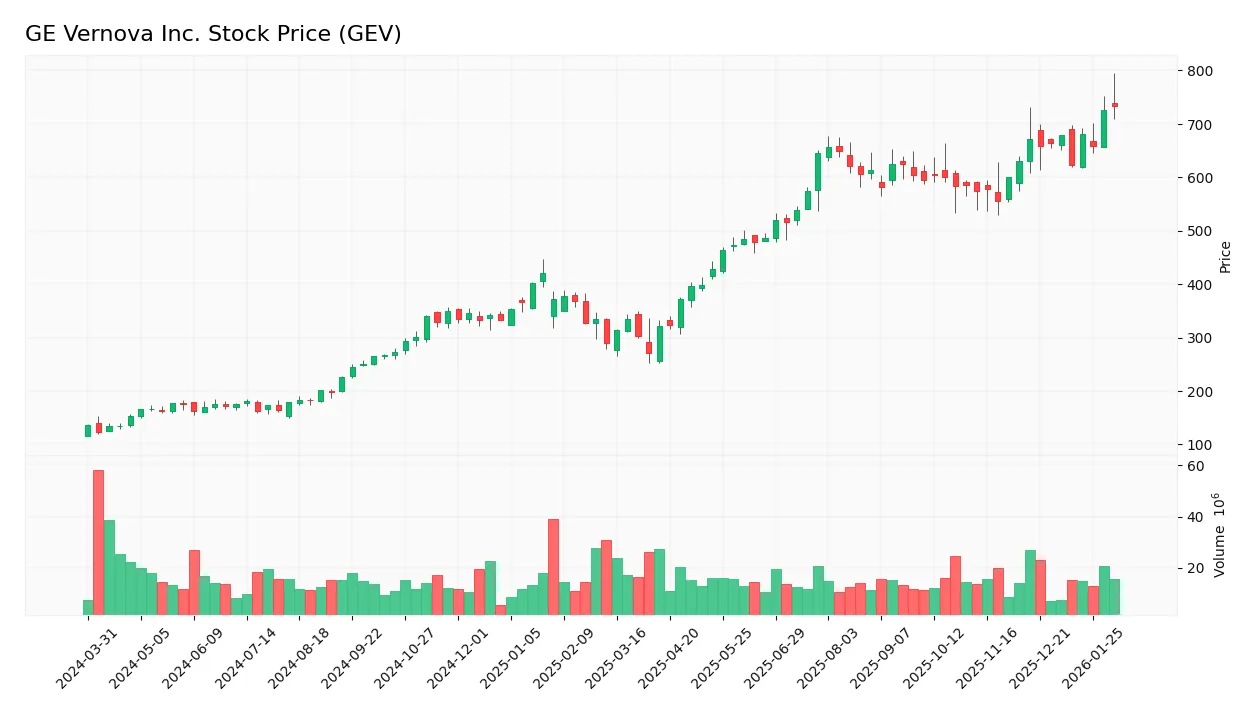
The weekly stock chart for GE Vernova Inc. illustrates significant price appreciation and volatility over the past 12 months:
Trend Analysis
Over the past 12 months, GEV’s stock price surged by 437%, indicating a strongly bullish trend with clear acceleration. The price ranged from a low of 123 to a high of 734. The volatility is substantial, reflected in a high standard deviation of 182, underscoring rapid and amplified price movements.
Volume Analysis
Trading volume is decreasing overall, with buyer volume comprising 61% in the recent three months, reflecting buyer dominance. Despite reduced activity, the higher buyer participation suggests sustained investor interest and positive sentiment, albeit with lower market engagement compared to earlier periods.
Target Prices
Analysts present a bullish consensus on GE Vernova Inc., signaling strong growth expectations.
| Target Low | Target High | Consensus |
|---|---|---|
| 475 | 1,087 | 834.72 |
The target prices show a wide range, reflecting some uncertainty but overall confidence in substantial upside potential.

Don’t Let Luck Decide Your Entry Point
Optimize your entry points with our advanced ProRealTime indicators. You’ll get efficient buy signals with precise price targets for maximum performance. Start outperforming now!
Analyst & Consumer Opinions
This section examines GE Vernova Inc.’s recent analyst ratings alongside key consumer feedback and sentiment trends.
Stock Grades
Here are the latest verified ratings from leading financial firms covering GE Vernova Inc.:
| Grading Company | Action | New Grade | Date |
|---|---|---|---|
| RBC Capital | Maintain | Outperform | 2026-01-30 |
| Susquehanna | Maintain | Positive | 2026-01-29 |
| Citigroup | Maintain | Neutral | 2026-01-29 |
| Goldman Sachs | Maintain | Buy | 2026-01-29 |
| Evercore ISI Group | Maintain | Outperform | 2026-01-29 |
| Citigroup | Maintain | Neutral | 2026-01-12 |
| GLJ Research | Maintain | Buy | 2026-01-12 |
| Baird | Downgrade | Neutral | 2026-01-09 |
| Barclays | Maintain | Overweight | 2026-01-07 |
| RBC Capital | Maintain | Outperform | 2025-12-22 |
The consensus leans clearly toward a Buy rating, with most firms maintaining positive or outperforming stances. A rare downgrade by Baird to Neutral stands out but does not shift the overall bullish sentiment.
Consumer Opinions
Consumer sentiment around GE Vernova Inc. (GEV) reveals a mix of enthusiasm and concern, reflecting the company’s evolving market position.
| Positive Reviews | Negative Reviews |
|---|---|
| “Impressive innovation in energy tech.” | “Customer service response times lag.” |
| “Reliable product performance overall.” | “Pricing feels steep compared to peers.” |
| “Strong commitment to sustainability.” | “Occasional delays in project delivery.” |
Overall, consumers praise GEV for its innovation and sustainability focus. However, recurring issues with customer support and pricing dampen enthusiasm. These weaknesses warrant attention for improving brand loyalty.
Risk Analysis
Below is a summary of key risks for GE Vernova Inc., detailing their nature, likelihood, and potential impact:
| Category | Description | Probability | Impact |
|---|---|---|---|
| Valuation Risk | High P/E (36.4) and P/B (15.9) ratios suggest overvaluation. | High | High |
| Liquidity Risk | Current ratio 0.98 and quick ratio 0.73 indicate tight liquidity. | Medium | Medium |
| Market Volatility | Beta of 1.3 exposes stock to above-market swings. | Medium | Medium |
| Dividend Risk | Low dividend yield (0.15%) limits income appeal. | Low | Low |
| Operational Risk | Moderate ROIC (6.3%) below WACC (9.97%) signals inefficient capital use. | Medium | Medium |
The primary risks stem from valuation stretched beyond sector norms and liquidity constraints. Despite strong profitability metrics, GE Vernova’s ROIC below WACC warns of potential value destruction. Market volatility remains a factor given the 1.3 beta. Investors should weigh these risks against the company’s safe Altman Z-score (3.18) and strong Piotroski score (7).
Should You Buy GE Vernova Inc.?
GE Vernova appears to be improving profitability with strong operational efficiency but exhibits an unfavorable moat, indicating value destruction. Despite a manageable leverage profile suggested by a safe Altman Z-Score, the overall B rating reflects moderate investment appeal with notable valuation risks.
Strength & Efficiency Pillars
GE Vernova Inc. posts a robust net margin of 12.83% and a strong return on equity at 43.69%, underscoring solid profitability. The Altman Z-score of 3.18 places the company safely away from bankruptcy risk, while a Piotroski score of 7 signals strong financial health. Despite a ROIC of 6.3% trailing the WACC of 9.97%, indicating value erosion, zero debt and infinite interest coverage highlight excellent financial stability and operational efficiency.
Weaknesses and Drawbacks
Valuation metrics raise caution: a P/E ratio of 36.4 and P/B of 15.9 suggest the stock trades at a marked premium, increasing downside risk. Liquidity is concerning with a current ratio of 0.98 and quick ratio of 0.73, both below the safety threshold, signaling potential short-term funding constraints. The company’s dividend yield at 0.15% is negligible, which may deter income-focused investors. These factors collectively introduce near-term valuation and liquidity risks.
Our Verdict about GE Vernova Inc.
The company’s long-term fundamentals appear moderately favorable due to strong profitability and financial health. Coupled with a bullish overall and recent buyer-dominant stock trend, this profile may appear attractive for long-term exposure. However, elevated valuation and liquidity concerns suggest investors might adopt a cautious, selective approach to timing entries.
Disclaimer: This content is for informational purposes only and does not constitute financial, investment, or other professional advice. Investing in financial markets involves a significant risk of loss, and past performance is not indicative of future results.
Additional Resources
- GE Vernova Inc. (GEV) Is a Trending Stock: Facts to Know Before Betting on It – Yahoo Finance Singapore (Feb 05, 2026)
- GE Vernova stock price today: GEV slips as $2.6B bond deal closes, wind repower update back in view – TechStock² (Feb 05, 2026)
- Machina Capital S.A.S. Purchases New Stake in GE Vernova Inc. $GEV – MarketBeat (Feb 05, 2026)
- Xcel Energy and GE Vernova Announce Strategic Alliance Agreement to Advance the Future of Energy – Xcel Energy Newsroom (Feb 03, 2026)
- (02/02/26) Top Picks 2026: GE Vernova Inc. (GEV) – moneyshow.com (Feb 02, 2026)
For more information about GE Vernova Inc., please visit the official website: gevernova.com