Home > Analyses > Industrials > GE Aerospace
GE Aerospace powers the skies with cutting-edge jet and turboprop engines that keep commercial and military aircraft aloft worldwide. Its innovation legacy spans iconic brands like Avio Aero and GE Additive, driving efficiency and performance across aviation sectors. As the aerospace landscape evolves rapidly, I question whether GE Aerospace’s robust fundamentals can sustain its premium valuation and deliver long-term growth in this competitive industry.

Table of contents
Business Model & Company Overview
GE Aerospace, founded in 1878 by Thomas Alva Edison and headquartered in Evendale, OH, commands a leading position in the Aerospace & Defense industry. Its core business revolves around jet and turboprop engines alongside integrated systems for commercial, military, business, and general aviation. The company’s ecosystem spans brands like Avio Aero and GE Additive, uniting innovation with a broad product portfolio that fuels multiple aviation sectors.
The company’s revenue engine balances Commercial Engines & Services with Defense & Propulsion Technologies, blending hardware manufacturing and long-term service contracts. GE Aerospace leverages its global footprint across the Americas, Europe, and Asia, ensuring strategic market access. Its competitive advantage lies in advanced engineering and a diversified portfolio that creates a durable economic moat, shaping aerospace’s future trajectory.
Financial Performance & Fundamental Metrics
I will analyze GE Aerospace’s income statement, key financial ratios, and dividend payout policy to assess its operational efficiency and shareholder returns.
Income Statement
The table below presents GE Aerospace’s key income statement figures for fiscal years 2021 through 2025, reflecting their financial performance over this period.

| 2021 | 2022 | 2023 | 2024 | 2025 | |
|---|---|---|---|---|---|
| Revenue | 56.5B | 29.1B | 35.3B | 38.7B | 45.9B |
| Cost of Revenue | 43.4B | 19.0B | 22.9B | 24.3B | 29.0B |
| Operating Expenses | 12.0B | 6.6B | 7.7B | 7.6B | 8.1B |
| Gross Profit | 13.1B | 10.2B | 12.4B | 14.4B | 16.9B |
| EBITDA | -1.5B | 4.0B | 12.6B | 9.8B | 12.1B |
| EBIT | -3.9B | 2.9B | 11.5B | 8.6B | 10.8B |
| Interest Expense | 1.8B | 1.3B | 1.0B | 1.0B | 0.8B |
| Net Income | -6.3B | 0.3B | 9.5B | 6.6B | 8.7B |
| EPS | -6.16 | 0.043 | 8.44 | 6.04 | 8.16 |
| Filing Date | 2022-02-11 | 2023-02-10 | 2024-02-02 | 2025-02-03 | 2026-01-29 |
Income Statement Evolution
GE Aerospace’s revenue declined 19% from 2021 to 2025 but grew 18% in the last year, signaling recent recovery. Net income surged 237% over the period, driven by a 269% rise in net margins. Gross and EBIT margins improved steadily, reflecting enhanced operational efficiency and cost control.
Is the Income Statement Favorable?
The 2025 income statement shows strong fundamentals. Revenue reached $45.9B with a 36.8% gross margin and 23.7% EBIT margin, both favorable. Net margin hit 19%, up 12% year-over-year, supporting an EPS growth of 36%. Interest expense remained low at 1.8% of revenue, underscoring solid financial health.
Financial Ratios
Below is a summary of key financial ratios for GE Aerospace over the past five fiscal years, illustrating profitability, valuation, liquidity, leverage, and efficiency trends:
| Ratios | 2021 | 2022 | 2023 | 2024 | 2025 |
|---|---|---|---|---|---|
| Net Margin | -11.2% | 1.2% | 26.8% | 16.9% | 18.9% |
| ROE | -15.7% | 1.0% | 34.6% | 33.9% | 46.6% |
| ROIC | 0.6% | 2.2% | 2.9% | 6.3% | 8.1% |
| P/E | -10.2 | 170.1 | 11.7 | 27.6 | 37.8 |
| P/B | 1.60 | 1.70 | 4.05 | 9.36 | 17.6 |
| Current Ratio | 1.28 | 1.18 | 1.33 | 1.09 | 1.04 |
| Quick Ratio | 0.97 | 0.88 | 1.07 | 0.81 | 0.74 |
| D/E | 0.94 | 0.78 | 0.79 | 1.05 | 1.10 |
| Debt-to-Assets | 19.1% | 13.8% | 12.4% | 16.2% | 15.7% |
| Interest Coverage | 0.59 | 2.69 | 4.58 | 6.86 | 10.4 |
| Asset Turnover | 0.28 | 0.15 | 0.20 | 0.31 | 0.35 |
| Fixed Asset Turnover | 3.62 | 2.39 | 4.88 | 5.32 | 5.74 |
| Dividend Yield | 0.89% | 1.12% | 0.53% | 0.56% | 0.44% |
Evolution of Financial Ratios
From 2021 to 2025, ROE surged from -15.7% to 46.6%, signaling a strong rebound in profitability. The Current Ratio declined modestly, ending near 1.04, indicating stable but tight liquidity. Debt-to-Equity rose from 0.94 to 1.10, reflecting increased leverage but within moderate bounds. Profit margins improved significantly, particularly net margin, which rose to nearly 19%.
Are the Financial Ratios Favorable?
In 2025, profitability ratios like ROE and net margin are favorable, showing efficient capital use. Liquidity ratios are mixed; Current Ratio is neutral, but Quick Ratio signals caution. Leverage ratios such as Debt-to-Equity appear unfavorable, raising risk concerns. Market multiples (PE and PB) are high and unfavorable, while asset efficiency is mostly weak. Overall, the financial ratios lean slightly unfavorable.
Shareholder Return Policy
GE Aerospace maintains a moderate dividend payout ratio around 16-17%, with dividends per share rising from $0.52 in 2021 to $1.36 in 2025. Dividend yields hover below 0.6%, supported by coverage ratios above 2.3x, indicating sustainable distributions funded by free cash flow.
The company also engages in share buybacks, complementing dividends to return capital. This balanced approach, with conservative payouts and buybacks, aligns with preserving long-term shareholder value while maintaining financial flexibility amid evolving market conditions.
Score analysis
The following radar chart displays key financial scores to assess GE Aerospace’s investment profile and valuation metrics:
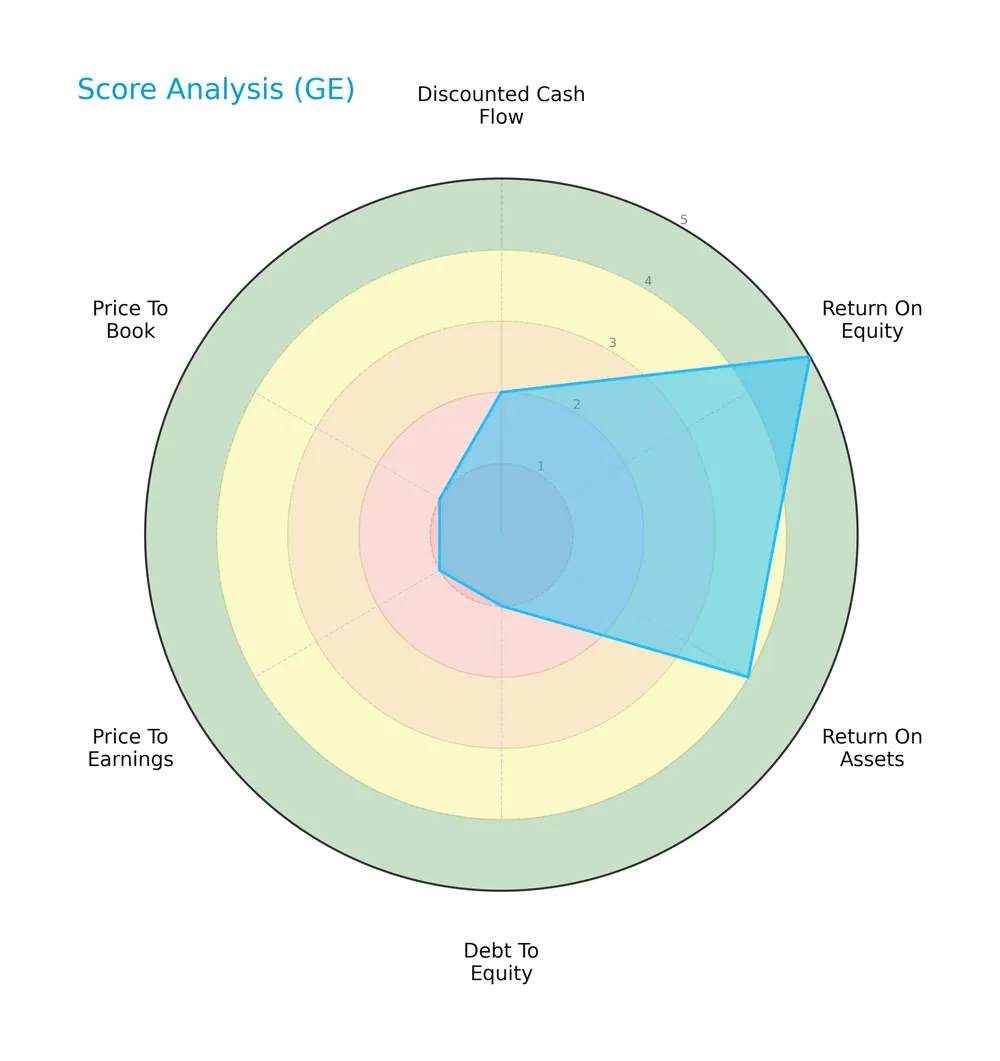
GE Aerospace shows mixed scores: strong return on equity (5) and assets (4), but very unfavorable debt-to-equity (1), price-to-earnings (1), and price-to-book (1) ratios. Discounted cash flow ranks moderate (2).
Analysis of the company’s bankruptcy risk
The Altman Z-Score places GE Aerospace firmly in the safe zone, indicating low bankruptcy risk based on its financial ratios:

Is the company in good financial health?
The Piotroski Score diagram illustrates GE Aerospace’s moderate financial health status:

With a Piotroski Score of 5, GE Aerospace reflects average financial strength. This suggests the company maintains reasonable profitability and efficiency, though improvements are needed to reach a stronger health profile.
Competitive Landscape & Sector Positioning
This section examines GE Aerospace’s strategic positioning within the aerospace and defense sector. I will analyze its revenue by segment, key products, and main competitors. I aim to determine whether GE Aerospace holds a competitive advantage over its peers.
Strategic Positioning
GE Aerospace maintains a diversified portfolio spanning commercial and defense aviation engines and integrated systems. Its revenue streams extend across major global regions, with significant exposure in the US and Asia, reflecting a balanced geographic footprint aligned with aerospace and defense industry dynamics.
Revenue by Segment
This pie chart illustrates GE Aerospace’s revenue distribution across its main business segments for the fiscal year 2023.
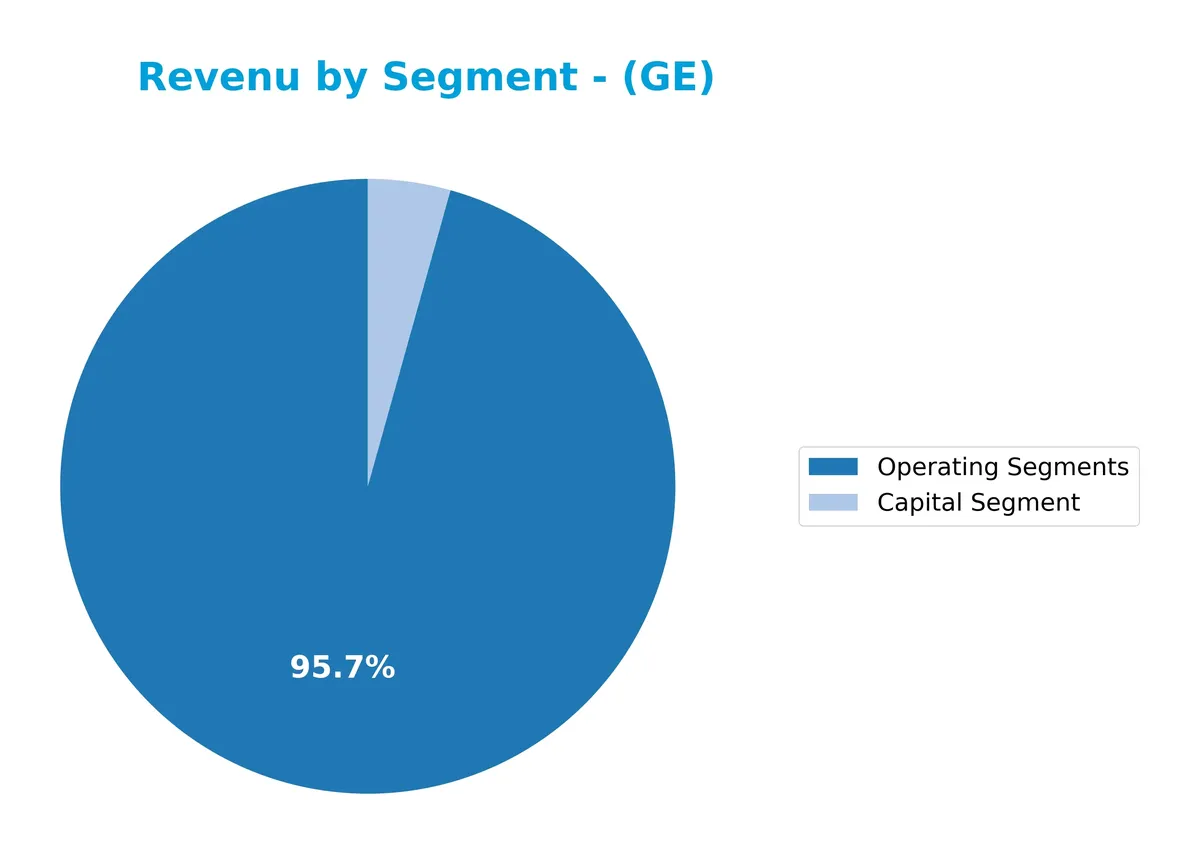
In 2023, the Aerospace Segment leads with $31.8B, followed by Power at $17.7B and Renewable Energy at $15.1B. Aerospace shows steady growth compared to prior years, reinforcing its role as the primary revenue driver. Power and Renewable Energy remain significant but less dominant. The distribution highlights GE’s focus on aerospace innovation while maintaining diversification, though reliance on Aerospace increases concentration risk.
Key Products & Brands
The table below summarizes GE Aerospace’s main products and brand offerings:
| Product | Description |
|---|---|
| Jet and Turboprop Engines | Engines for commercial airframes, business aviation, and aeroderivative applications. |
| Integrated Aircraft Systems | Systems supporting commercial, military, business, and general aviation aircraft. |
| Avio Aero | A GE Aerospace brand specializing in aerospace components and engine manufacturing. |
| Unison | A brand focusing on aircraft engine components and related services. |
| GE Additive | Advanced manufacturing and 3D printing technologies for aerospace parts. |
| Dowty Propellers | Producer of propellers for turboprop aircraft under GE Aerospace’s portfolio. |
| Commercial Engines & Services | Segment handling design, manufacturing, and servicing of commercial jet engines. |
| Defense & Propulsion Technologies | Segment offering defense engines and critical aircraft systems. |
GE Aerospace’s portfolio spans jet engines, integrated systems, and advanced manufacturing brands. Its segments focus on commercial and defense aerospace markets, reflecting diversified capabilities within the aerospace industry.
Main Competitors
The Aerospace & Defense sector includes 12 competitors; below are the top 10 leaders by market capitalization:
| Competitor | Market Cap. |
|---|---|
| GE Aerospace | 338B |
| RTX Corporation | 251B |
| The Boeing Company | 171B |
| Lockheed Martin Corporation | 116B |
| General Dynamics Corporation | 93B |
| Northrop Grumman Corporation | 84B |
| TransDigm Group Incorporated | 77B |
| L3Harris Technologies, Inc. | 57B |
| Axon Enterprise, Inc. | 44B |
| BWX Technologies, Inc. | 17B |
GE Aerospace ranks 1st among 12 competitors, commanding a market cap 95.5% the size of the sector leader benchmark. It stands well above both the average top 10 market cap of 125B and the sector median of 80B. The company’s market cap is 29% higher than its closest competitor, RTX Corporation, highlighting a significant lead.
Comparisons with competitors
Check out how we compare the company to its competitors:
Does GE have a competitive advantage?
GE Aerospace currently shows a slightly unfavorable competitive advantage as its ROIC remains below WACC, indicating value destruction despite improving profitability. Historically in aerospace, sustained ROIC above WACC signals a durable moat, which GE has yet to achieve.
Looking ahead, GE’s diverse portfolio, including commercial engines and defense systems, positions it to capitalize on expanding global aviation markets and emerging technologies. Continued innovation and geographic growth, especially in Asia and the Middle East, offer notable opportunities for future value creation.
SWOT Analysis
This SWOT analysis highlights GE Aerospace’s strategic position by examining its internal strengths and weaknesses alongside external opportunities and threats.
Strengths
- strong brand portfolio
- robust EBIT margin at 23.65%
- diverse global revenue streams
Weaknesses
- high PE and PB ratios signal overvaluation
- quick ratio below 1 indicates liquidity risk
- debt to equity ratio of 1.1 is concerning
Opportunities
- growing aerospace demand in Asia
- expansion in defense contracts
- innovation in additive manufacturing
Threats
- geopolitical tensions affecting supply chains
- rising interest rates increasing debt costs
- intense competition from other aerospace giants
GE Aerospace benefits from strong profitability and global diversification. However, valuation and liquidity issues warrant caution. The company must leverage growth in emerging markets and innovation while mitigating debt risks and geopolitical uncertainties.
Stock Price Action Analysis
The weekly stock chart illustrates GE Aerospace’s price fluctuations and momentum over the past 100 weeks:
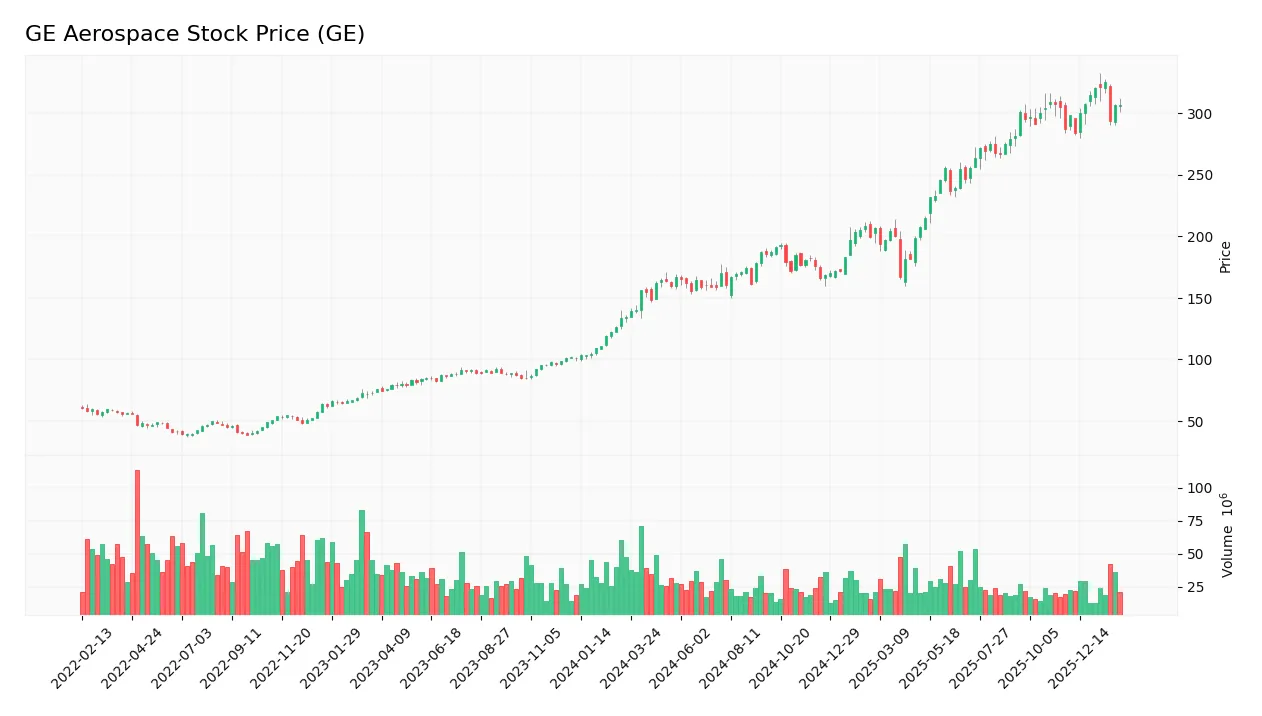
Trend Analysis
Over the past 12 months, GE Aerospace’s stock gained 127.76%, indicating a strong bullish trend with notable acceleration. The price moved from a low of 134.7 to a high of 325.12. Volatility is high, evidenced by a standard deviation of 56.53, underscoring significant price swings.
Volume Analysis
Trading volume shows a buyer-driven dynamic, with 69.74% of total volume attributed to buyers. Despite this dominance, volume has decreased recently, suggesting waning market participation even as buyer sentiment remains positive. In the last three months, buyer dominance eased slightly to 64.08%.
Target Prices
Analysts set a bullish consensus for GE Aerospace with target prices tightly clustered at the high end.
| Target Low | Target High | Consensus |
|---|---|---|
| 374 | 387 | 380.33 |
The target range indicates strong confidence, suggesting upside potential around 5% to 7% above current levels.

Don’t Let Luck Decide Your Entry Point
Optimize your entry points with our advanced ProRealTime indicators. You’ll get efficient buy signals with precise price targets for maximum performance. Start outperforming now!
Analyst & Consumer Opinions
This section examines analyst ratings and consumer feedback to provide insight into GE Aerospace’s market perception.
Stock Grades
Here is a summary of recent verified analyst grades for GE Aerospace from leading financial institutions:
| Grading Company | Action | New Grade | Date |
|---|---|---|---|
| JP Morgan | Maintain | Overweight | 2026-01-26 |
| Citigroup | Maintain | Buy | 2026-01-23 |
| UBS | Maintain | Buy | 2026-01-23 |
| UBS | Maintain | Buy | 2026-01-15 |
| Citigroup | Maintain | Buy | 2026-01-13 |
| JP Morgan | Maintain | Overweight | 2025-10-27 |
| B of A Securities | Maintain | Buy | 2025-10-27 |
| UBS | Maintain | Buy | 2025-10-22 |
| RBC Capital | Maintain | Outperform | 2025-10-22 |
| Barclays | Maintain | Overweight | 2025-07-23 |
The consensus across major firms remains strongly positive, with no downgrades reported. Analysts consistently maintain buy or outperform ratings, reflecting stable confidence in GE Aerospace’s outlook.
Consumer Opinions
Consumer sentiment around GE Aerospace reflects a mix of admiration for its innovation and concerns over service delivery. Here’s a snapshot of what users are saying:
| Positive Reviews | Negative Reviews |
|---|---|
| “GE Aerospace consistently delivers cutting-edge technology.” | “Customer support response times are often slow.” |
| “The reliability of their engines has improved significantly.” | “Pricing feels steep compared to competitors.” |
| “Strong commitment to sustainability and reducing emissions.” | “Occasional delays in project timelines frustrate clients.” |
Overall, consumers praise GE Aerospace’s technological leadership and sustainability efforts. However, recurring criticisms focus on customer service responsiveness and pricing competitiveness, which could impact client loyalty if unaddressed.
Risk Analysis
Below is a summary of key risks facing GE Aerospace, including their likelihood and potential impact:
| Category | Description | Probability | Impact |
|---|---|---|---|
| Market Valuation | Elevated P/E (37.76) and P/B (17.6) ratios suggest overvaluation risk. | High | High |
| Liquidity | Quick ratio at 0.74 signals potential short-term liquidity strain. | Medium | Medium |
| Leverage | Debt-to-equity ratio of 1.1 indicates heavy reliance on debt financing. | Medium | High |
| Operational Efficiency | Low asset turnover (0.35) may constrain growth and returns. | Medium | Medium |
| Dividend Yield | Low yield (0.44%) reduces income appeal amid market volatility. | Low | Low |
The most pressing risks combine valuation excess and leverage. GE’s P/E and P/B ratios far exceed industrial benchmarks, raising concerns about price corrections. Its debt load, while manageable, could pressure earnings if interest rates rise. Liquidity is slightly tight, but the strong Altman Z-score (3.33) points to financial stability.
Should You Buy GE Aerospace?
GE Aerospace appears to be improving operational efficiency with growing profitability despite a slightly unfavorable moat indicating value destruction. Its leverage profile remains substantial, constraining financial flexibility. The overall B- rating suggests a moderate investment profile with notable risks.
Strength & Efficiency Pillars
GE Aerospace exhibits solid profitability with a net margin of 18.98% and a robust return on equity of 46.6%. The Altman Z-score at 3.33 places the company firmly in the safe zone, signaling strong financial health. Although the return on invested capital (ROIC) of 8.12% trails its weighted average cost of capital (WACC) at 9.94%, its ROIC trend shows significant growth, indicating improving operational efficiency. These factors, coupled with favorable interest coverage of 12.86, underscore the company’s capacity to generate value and sustain operations.
Weaknesses and Drawbacks
Valuation metrics raise concerns: the price-to-earnings ratio stands at a lofty 37.76, and the price-to-book ratio hits 17.6, signaling a premium that may pressure future returns. The debt-to-equity ratio of 1.1 reflects elevated leverage, which could constrain financial flexibility amid volatility. Liquidity also appears stretched, with a current ratio of 1.04 and a quick ratio below 1 at 0.74, hinting at potential short-term cash flow risks. These vulnerabilities warrant caution despite the company’s operational strengths.
Our Verdict about GE Aerospace
The company’s long-term fundamentals appear favorable, supported by strong profitability and financial stability. Coupled with a bullish overall trend and recent buyer dominance of 64.08%, GE Aerospace may appear attractive for long-term exposure. However, premium valuation and leverage levels suggest investors could consider a measured entry. The profile suggests growth potential tempered by valuation and liquidity risks, recommending prudence in timing investment decisions.
Disclaimer: This content is for informational purposes only and does not constitute financial, investment, or other professional advice. Investing in financial markets involves a significant risk of loss, and past performance is not indicative of future results.
Additional Resources
- GE Aerospace Stock Outlook: Is Wall Street Bullish or Bearish? – Yahoo Finance (Feb 04, 2026)
- Boeing, GE analyzing potential durability issue on 777X engines – Reuters (Feb 02, 2026)
- US$300M to Bolster GE Aerospace’s Engine Repair Capabilities in Singapore – Investing News Network (Feb 05, 2026)
- GE Aerospace $GE Shares Purchased by HORAN Wealth LLC – MarketBeat (Feb 05, 2026)
- GE Aerospace: The Big Buy Opportunity (NYSE:GE) – Seeking Alpha (Feb 03, 2026)
For more information about GE Aerospace, please visit the official website: geaerospace.com