Home > Analyses > Technology > Gartner, Inc.
Gartner, Inc. shapes how businesses harness technology to drive innovation and competitive advantage worldwide. It dominates the IT research and advisory landscape with unmatched insights, conferences, and consulting services. Known for its deep expertise and trusted guidance, Gartner influences strategic decisions across industries. As technology evolves rapidly, I question whether Gartner’s current fundamentals justify its premium valuation and growth prospects in an increasingly competitive market.

Table of contents
Business Model & Company Overview
Gartner, Inc., founded in 1979 and headquartered in Stamford, Connecticut, stands as a global leader in Information Technology Services. It operates a cohesive ecosystem spanning research, conferences, and consulting. This structure enables Gartner to serve diverse business needs, from data-driven insights to strategic IT solutions, reinforcing its dominant position across multiple continents.
The company’s revenue engine blends subscription-based research access with high-value conferences and bespoke consulting services. Its global footprint covers the Americas, Europe, the Middle East, Africa, and Asia. Gartner’s integrated model not only drives steady recurring income but also builds a robust economic moat through deep client relationships and specialized expertise.
Financial Performance & Fundamental Metrics
I analyze Gartner, Inc.’s income statement, key financial ratios, and dividend payout policy to assess its operational efficiency and shareholder returns.
Income Statement
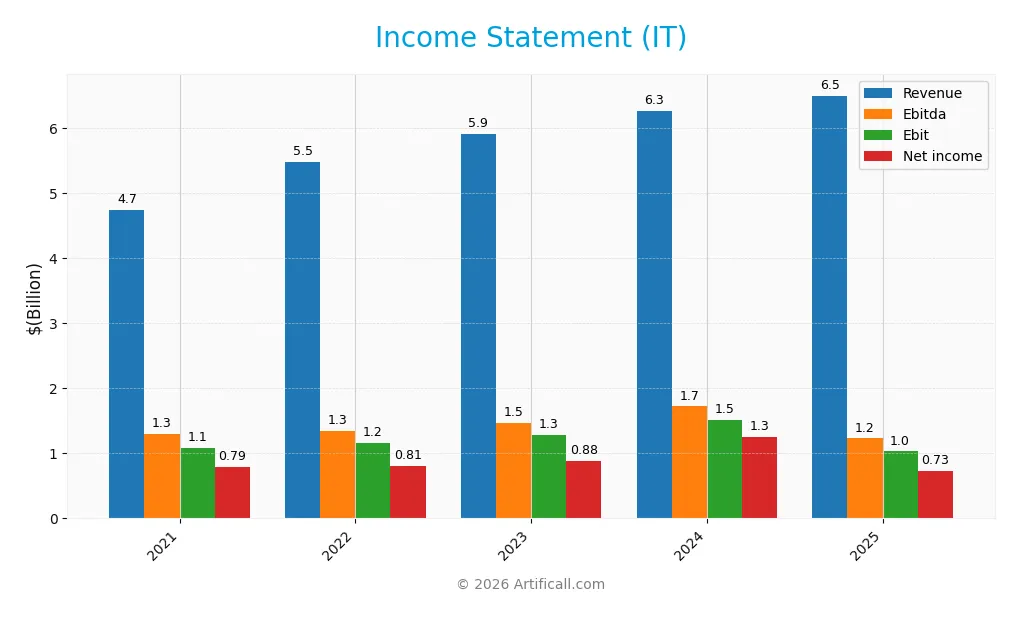
The table below presents Gartner, Inc.’s key income statement figures for fiscal years 2021 through 2025, reflecting its revenue, expenses, profitability, and earnings per share.
| 2021 | 2022 | 2023 | 2024 | 2025 | |
|---|---|---|---|---|---|
| Revenue | 4.73B | 5.48B | 5.91B | 6.27B | 6.50B |
| Cost of Revenue | 1.44B | 1.69B | 1.90B | 2.02B | 2.10B |
| Operating Expenses | 2.37B | 2.68B | 2.77B | 3.09B | 3.37B |
| Gross Profit | 3.29B | 3.78B | 4.00B | 4.24B | 4.40B |
| EBITDA | 1.30B | 1.35B | 1.47B | 1.72B | 1.23B |
| EBIT | 1.09B | 1.15B | 1.28B | 1.52B | 1.03B |
| Interest Expense | 119M | 126M | 133M | 131M | 61M |
| Net Income | 794M | 808M | 882M | 1.25B | 729M |
| EPS | 9.33 | 10.08 | 11.17 | 16.12 | 9.68 |
| Filing Date | 2022-02-23 | 2023-02-16 | 2024-02-15 | 2025-02-13 | 2026-02-12 |
Income Statement Evolution
From 2021 to 2025, Gartner’s revenue grew 37% to $6.5B, demonstrating solid top-line expansion. However, net income declined 8% over the same span, reflecting margin pressure. Gross margin remained stable near 68%, while EBIT and net margins contracted, especially in the latest year, signaling rising costs and profitability challenges.
Is the Income Statement Favorable?
In 2025, Gartner posted $6.5B revenue, up 3.7% year-over-year, but EBIT and net income fell sharply by 32% and 44%, respectively. Operating expenses grew proportionally with revenue, eroding operating leverage. Despite a favorable gross margin of 67.7%, declines in net margin to 11.2% and EPS by nearly 40% suggest mixed fundamentals. Overall, the income statement presents a neutral profile with notable risks on profitability.
Financial Ratios
The table below summarizes key financial ratios for Gartner, Inc. over the last five fiscal years, reflecting profitability, liquidity, leverage, and market valuation metrics:
| Ratios | 2021 | 2022 | 2023 | 2024 | 2025 |
|---|---|---|---|---|---|
| Net Margin | 16.8% | 14.8% | 14.9% | 20.0% | 11.2% |
| ROE | 2.14 | 3.55 | 1.30 | 0.92 | 2.28 |
| ROIC | 18.1% | 22.7% | 22.8% | 22.4% | 19.2% |
| P/E | 35.8 | 33.4 | 40.4 | 30.1 | 24.9 |
| P/B | 76.6 | 118.3 | 52.4 | 27.7 | 56.8 |
| Current Ratio | 0.78 | 0.77 | 0.91 | 1.06 | 1.00 |
| Quick Ratio | 0.78 | 0.77 | 0.91 | 1.06 | 1.00 |
| D/E | 8.76 | 13.9 | 4.51 | 2.13 | 0.86 |
| Debt-to-Assets | 43.8% | 43.3% | 39.2% | 34.0% | 3.4% |
| Interest Coverage | 7.73 | 8.72 | 9.32 | 8.82 | 16.9 |
| Asset Turnover | 0.64 | 0.75 | 0.75 | 0.73 | 0.80 |
| Fixed Asset Turnover | 5.76 | 7.81 | 9.38 | 12.5 | 15.2 |
| Dividend Yield | 0% | 0% | 0% | 0% | 0% |
Evolution of Financial Ratios
Return on Equity (ROE) declined significantly from 13.9% in 2021 to 2.3% in 2025, indicating reduced profitability. The Current Ratio improved slightly but remained below 1.1, signaling tight liquidity. Debt-to-Equity Ratio decreased markedly from over 8.7 in 2021 to 0.86 in 2025, reflecting a substantial reduction in financial leverage and risk exposure.
Are the Financial Ratios Fovorable?
In 2025, profitability is favorable with an 11.2% net margin and ROE at 2.3%, supported by a strong 19.2% ROIC exceeding the 8.7% WACC. Liquidity ratios hover around 1.0, indicating neutral to unfavorable short-term financial health. Leverage is moderate with a 0.86 debt-to-equity ratio and a low 3.4% debt-to-assets ratio, both favorable. Market valuations show concerns: a high 56.8 price-to-book ratio and zero dividend yield are unfavorable, while price-to-earnings at 24.9 is neutral. Overall, ratios are slightly favorable with mixed signals across categories.
Shareholder Return Policy
Gartner, Inc. does not pay dividends, reflecting a reinvestment strategy likely focused on growth and innovation. The company maintains free cash flow coverage and engages in share buybacks, supporting capital return without direct dividend payouts.
This approach suggests a prioritization of long-term shareholder value creation through internal investments and buybacks. Such a policy aligns with sustaining growth but requires monitoring to ensure buybacks remain disciplined and do not impair financial flexibility.
Score analysis
The radar chart below displays key financial scores that help contextualize the company’s valuation and profitability metrics:
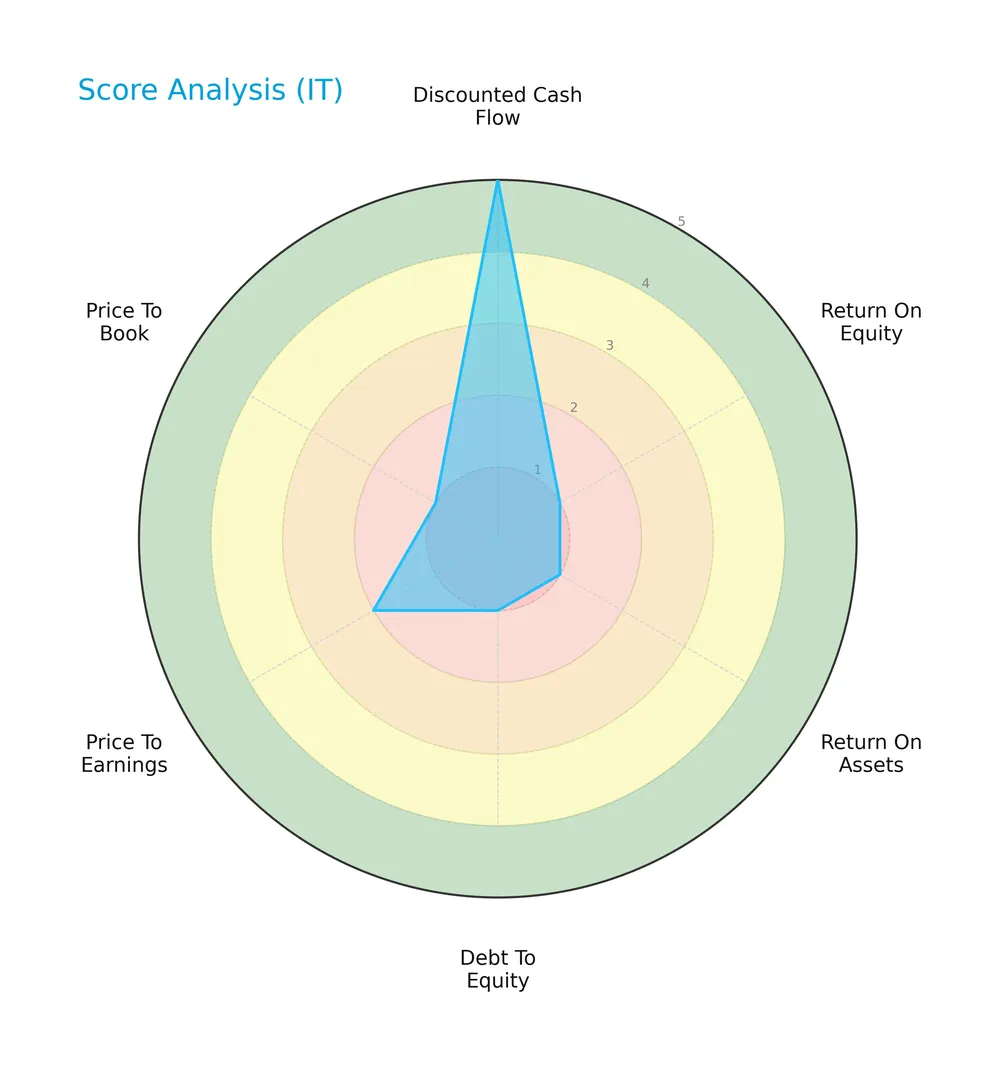
Gartner, Inc. scores very favorably on discounted cash flow with a 5, indicating strong intrinsic value. However, profitability ratios ROE and ROA both score 1, signaling weak returns. Debt-to-equity and price-to-book scores are very unfavorable at 1, reflecting high leverage and low market valuation. The price-to-earnings score is also unfavorable at 2, suggesting an expensive or underperforming stock.
Analysis of the company’s bankruptcy risk
The Altman Z-Score places Gartner, Inc. firmly in the safe zone, indicating a low risk of bankruptcy based on its financial ratios:

Is the company in good financial health?
This Piotroski Score diagram illustrates the company’s moderate financial strength based on nine fundamental criteria:

With a Piotroski Score of 5, Gartner shows average financial health. This score suggests mixed signals on profitability and operational efficiency, indicating the company is neither particularly strong nor weak financially.
Competitive Landscape & Sector Positioning
This sector analysis examines Gartner, Inc.’s strategic positioning, revenue segments, key products, and main competitors. I will assess whether Gartner holds a competitive advantage over its industry peers.
Strategic Positioning
Gartner, Inc. concentrates on three core segments: Research, Conferences, and Consulting, with Research driving over 80% of revenue in 2025. Its geographic exposure spans the US, EMEA, and other international markets, showing diversified global reach but focused product offerings within information technology services.
Revenue by Segment
This pie chart illustrates Gartner, Inc.’s revenue distribution by segment for fiscal year 2025, highlighting contributions from Events and Consulting divisions.
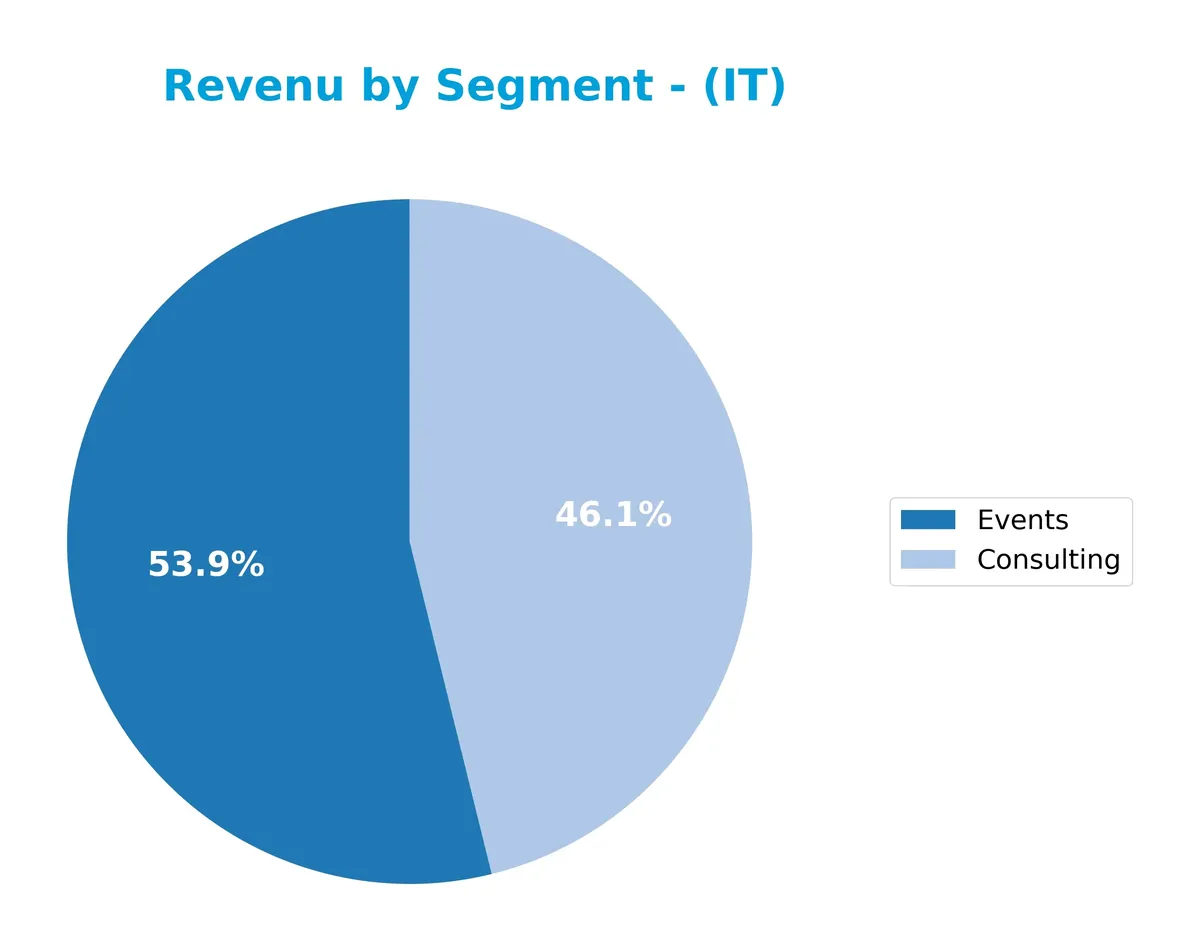
In 2025, Gartner’s revenue centers on Events at $645M and Consulting at $552M, showing a shift from prior dominance by the Research Segment, which is absent here. Historically, Research drove the bulk of revenue, exceeding $4.6B as recently as 2022. The latest year reveals a concentration risk as revenue narrows to two smaller segments, signaling a strategic pivot or reporting change worth monitoring closely.
Key Products & Brands
The following table outlines Gartner, Inc.’s main products and brands, highlighting their core offerings:
| Product | Description |
|---|---|
| Research Segment | Subscription-based research providing access to published content, data, benchmarks, and expert networks. |
| Conferences (Events) | Business events that enable professionals to learn, share, and network within their industries. |
| Consulting | Market research, custom analysis, and actionable solutions focused on IT cost optimization and digital transformation. |
Gartner’s revenue heavily depends on its Research segment, supported by Consulting and Conferences. This diversified portfolio serves IT professionals globally with insights and practical advice.
Main Competitors
There are 16 competitors in total, with the table below listing the top 10 leaders by market capitalization:
| Competitor | Market Cap. |
|---|---|
| International Business Machines Corporation | 272B |
| Accenture plc | 162B |
| Cognizant Technology Solutions Corporation | 40B |
| Fiserv, Inc. | 36B |
| Fidelity National Information Services, Inc. | 34B |
| Wipro Limited | 30B |
| Leidos Holdings, Inc. | 23B |
| Gartner, Inc. | 18B |
| CDW Corporation | 17B |
| Jack Henry & Associates, Inc. | 13B |
Gartner, Inc. ranks 8th among its peers, with a market cap just 4.41% the size of leader IBM. It sits below both the average market cap of the top 10 competitors (64.6B) and the sector median (17.8B). Gartner’s market cap is 95.31% smaller than the next competitor above it, Leidos Holdings, highlighting a significant gap.
Comparisons with competitors
Check out how we compare the company to its competitors:
Does Gartner have a competitive advantage?
Gartner demonstrates a sustainable competitive advantage, consistently generating returns on invested capital (ROIC) that exceed its weighted average cost of capital (WACC) by over 10.5%. This growing ROIC trend reinforces its position as a value creator in the Information Technology Services sector.
Looking ahead, Gartner’s diversified revenue streams across Research, Conferences, and Consulting segments support expansion in international markets, especially Europe, Middle East, and Africa. Opportunities in IT cost optimization and digital transformation consulting could further strengthen its moat.
SWOT Analysis
This SWOT analysis highlights Gartner, Inc.’s key internal and external factors shaping its strategic outlook.
Strengths
- strong gross margin at 67.7%
- high ROIC of 19.2%, well above WACC
- diversified revenue across global regions
Weaknesses
- declining net margin and EPS growth over recent years
- high price-to-book ratio at 56.8 signals overvaluation
- current ratio at 1.0 indicates tight liquidity
Opportunities
- expanding IT advisory demand amid digital transformation
- growth potential in Europe, Middle East and Africa
- leveraging consulting segment for higher-margin services
Threats
- intense competition in IT services and consulting
- economic slowdown could reduce client spend
- reliance on subscription model vulnerable to churn
Gartner exhibits a solid competitive moat with strong profitability metrics but faces challenges in margin sustainability and valuation. Strategic focus should target margin recovery and deeper penetration in international markets to mitigate risks.
Stock Price Action Analysis
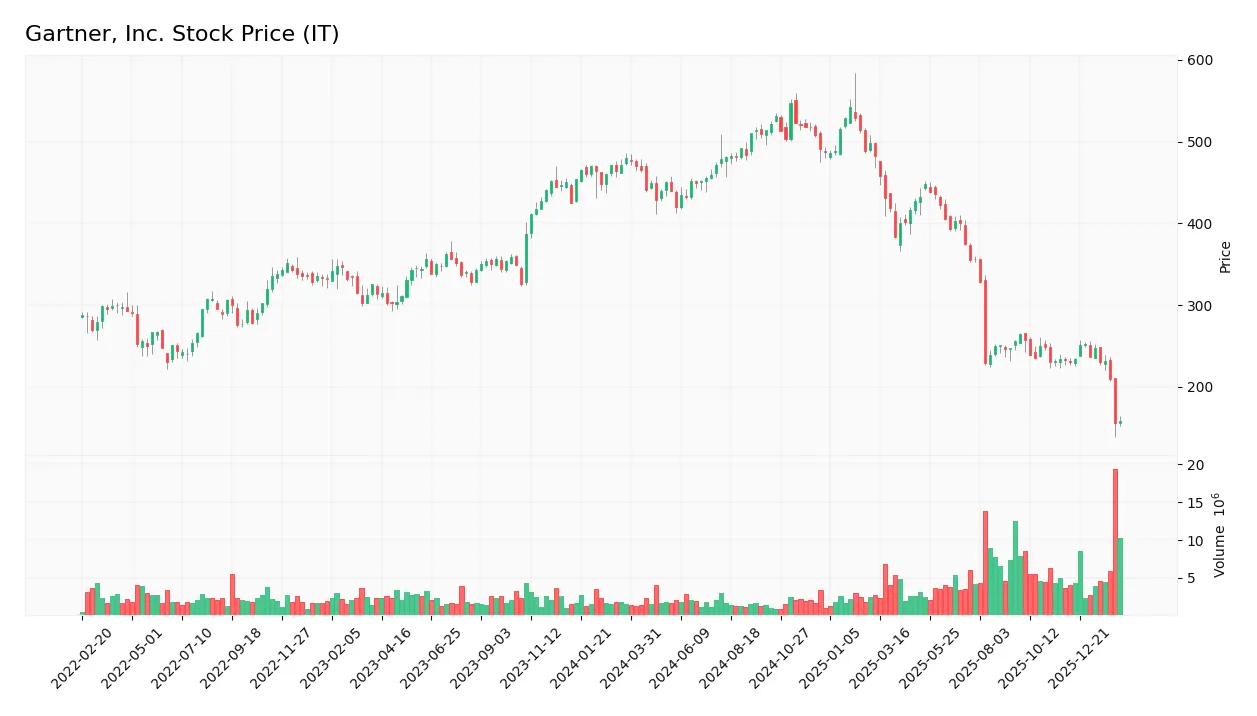
The following weekly chart illustrates Gartner, Inc.’s stock price fluctuations and key turning points over the last 12 months:
Trend Analysis
Over the past 12 months, Gartner’s stock price declined sharply by 66.92%, confirming a strong bearish trend. The price fell from a high of 547.4 to a low of 156.33, with volatility high at a standard deviation of 110.8. The downtrend shows deceleration, indicating a slowing rate of decline.
Volume Analysis
Trading volume has increased overall, totaling 407M shares, with sellers slightly dominating at 52%. Over the recent three months, seller volume exceeded buyer volume by 5.5%, reflecting cautious, somewhat bearish investor sentiment and moderate market participation.
Target Prices
Analysts set a clear target consensus for Gartner, Inc., reflecting cautious optimism.
| Target Low | Target High | Consensus |
|---|---|---|
| 170 | 275 | 206.3 |
The target range spans from 170 to 275, with a consensus near 206, suggesting moderate upside potential balanced by valuation risks.

Don’t Let Luck Decide Your Entry Point
Optimize your entry points with our advanced ProRealTime indicators. You’ll get efficient buy signals with precise price targets for maximum performance. Start outperforming now!
Analyst & Consumer Opinions
This section examines Gartner, Inc.’s analyst ratings and consumer feedback to provide a balanced performance overview.
Stock Grades
Here are the latest verified analyst grades for Gartner, Inc. from recognized financial institutions:
| Grading Company | Action | New Grade | Date |
|---|---|---|---|
| Truist Securities | Maintain | Buy | 2026-02-06 |
| Barclays | Maintain | Equal Weight | 2026-02-05 |
| Wells Fargo | Maintain | Underweight | 2026-02-04 |
| Morgan Stanley | Maintain | Equal Weight | 2026-02-04 |
| UBS | Maintain | Neutral | 2026-01-09 |
| Morgan Stanley | Maintain | Equal Weight | 2025-12-17 |
| BMO Capital | Maintain | Market Perform | 2025-11-06 |
| Goldman Sachs | Maintain | Buy | 2025-11-05 |
| Barclays | Maintain | Equal Weight | 2025-11-05 |
| UBS | Maintain | Neutral | 2025-11-05 |
The overall trend shows a predominance of hold-type ratings, reflecting cautious investor sentiment. Buy recommendations exist but are balanced by several equal weight and underweight positions, indicating mixed analyst confidence.
Consumer Opinions
Gartner, Inc. consistently receives mixed consumer sentiment, reflecting its complex role in the research and advisory sector.
| Positive Reviews | Negative Reviews |
|---|---|
| Provides insightful, data-driven advice. | Pricing is steep for smaller firms. |
| Excellent customer service and support. | Reports sometimes lack industry nuance. |
| Comprehensive market analysis tools. | Platform interface can be overwhelming. |
Overall, consumers praise Gartner’s high-quality research and strong support. However, cost and usability concerns persist, especially among smaller clients.
Risk Analysis
Here is a summary of key risks facing Gartner, Inc., highlighting their probability and potential impact:
| Category | Description | Probability | Impact |
|---|---|---|---|
| Valuation Risk | Extremely high price-to-book ratio (56.78) signals overvaluation | Medium | High |
| Liquidity Risk | Current ratio at 1.0 indicates tight liquidity | Medium | Medium |
| Market Volatility | Beta of 1.036 suggests sensitivity to market swings | High | Medium |
| Competitive Pressure | Saturated IT advisory market may limit growth | Medium | High |
| Earnings Volatility | Net margin at 11.22% is favorable but sensitive to economic shifts | Low | Medium |
| Dividend Policy Risk | No dividend yield raises concerns for income-focused investors | Low | Low |
I consider valuation risk and market volatility the most pressing threats. The sky-high price-to-book ratio signals speculative pricing. Meanwhile, Gartner’s beta near 1 amplifies stock swings amid tech sector turbulence. The safe Altman Z-Score of 3.57 indicates low bankruptcy risk, but the average Piotroski score of 5 calls for caution on financial strength. Tight liquidity could constrain flexibility in downturns. Overall, investors must weigh growth prospects against stretched valuation and market sensitivity.
Should You Buy Gartner, Inc.?
Analytically, Gartner appears to exhibit robust value creation driven by a durable competitive moat with growing ROIC well above WACC. Despite manageable leverage suggested by a safe-zone Altman Z-Score, its overall rating of C reflects mixed operational efficiency and profitability signals.
Strength & Efficiency Pillars
Gartner, Inc. exhibits robust operational efficiency with a net margin of 11.22% and an exceptional return on equity of 227.93%. The company delivers a solid return on invested capital (ROIC) of 19.23%, significantly surpassing its weighted average cost of capital (WACC) at 8.72%. This clear spread confirms Gartner as a value creator with a sustainable competitive advantage. Additionally, a growing ROIC trend highlights improving profitability, reinforcing its moat and operational strengths despite recent challenges.
Weaknesses and Drawbacks
The company faces valuation and liquidity concerns that warrant caution. Its price-to-book ratio stands at a steep 56.78, signaling a possible overvaluation risk. The current ratio is a borderline 1.0, which may constrain short-term liquidity flexibility. While the debt-to-equity ratio at 0.86 is neutral, the absence of dividend yield and the slight seller dominance in recent trading (buyers at 45.55%) add pressure. These factors could weigh on near-term market sentiment and capital stability.
Our Final Verdict about Gartner, Inc.
Gartner presents a fundamentally solid profile with strong operational profitability and a clear value-creating moat. However, its slightly seller-dominant recent trend and stretched valuation metrics suggest a cautious approach. Despite long-term strength, the current market pressure might warrant a wait-and-see stance for a more favorable entry point. Investors seeking growth should weigh these factors carefully before committing capital.
Disclaimer: This content is for informational purposes only and does not constitute financial, investment, or other professional advice. Investing in financial markets involves a significant risk of loss, and past performance is not indicative of future results.
Additional Resources
- Prescott Group Capital Management L.L.C. Sells 7,200 Shares of Gartner, Inc. $IT – MarketBeat (Feb 13, 2026)
- Gartner, Inc. (IT) Faces Sales Challenges While Betting on Recovery – Yahoo Finance (Feb 11, 2026)
- Decoding Gartner Inc (IT): A Strategic SWOT Insight – GuruFocus (Feb 13, 2026)
- Gartner, HP, Globalstar, Amphenol, and Equifax Stocks Trade Up, What You Need To Know – Finviz (Feb 13, 2026)
- Gartner, Inc. $IT Shares Bought by Madison Asset Management LLC – MarketBeat (Feb 11, 2026)
For more information about Gartner, Inc., please visit the official website: gartner.com