Home > Analyses > Technology > Garmin Ltd.
Garmin Ltd. transforms how people navigate, explore, and stay active every day. Its cutting-edge GPS technology powers aviation, marine, fitness, outdoor, and automotive markets with unmatched precision. Known for innovation and rugged quality, Garmin commands respect across multiple industries. As technology evolves rapidly, I question whether Garmin’s solid fundamentals still justify its premium valuation and sustained growth potential in 2026’s competitive landscape.

Table of contents
Business Model & Company Overview
Garmin Ltd., founded in 1989 and headquartered in Schaffhausen, Switzerland, commands a leading position in wireless device technology. It integrates fitness, outdoor, aviation, marine, and automotive products into a cohesive ecosystem that serves diverse global markets. This multi-segment approach enables Garmin to cater to consumers and professionals alike, reinforcing its status in the hardware and equipment industry.
The company generates value through a balanced revenue engine combining hardware sales with software platforms like Garmin Connect and Connect IQ. Its extensive geographic footprint spans the Americas, Europe, Asia Pacific, and beyond. Garmin’s competitive advantage lies in its ability to deliver integrated, high-quality solutions that create customer stickiness and long-term loyalty, underpinning a durable economic moat.
Financial Performance & Fundamental Metrics
I analyze Garmin Ltd.’s income statement, key financial ratios, and dividend payout policy to assess its profitability, efficiency, and shareholder return strategy.
Income Statement
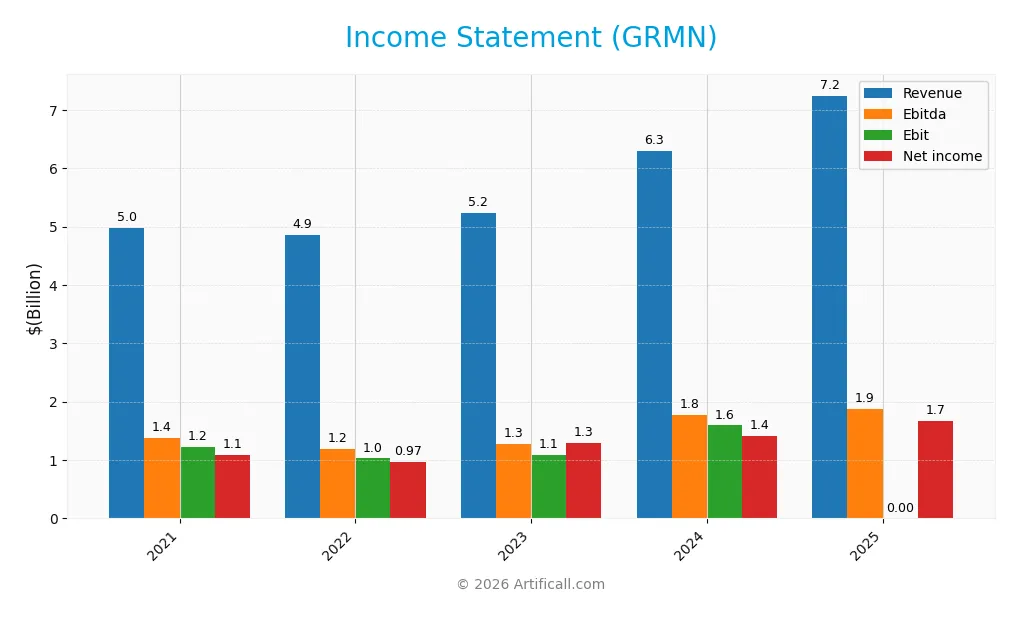
Below is Garmin Ltd.’s income statement for fiscal years 2021 through 2025, showing key performance metrics in USD.
| 2021 | 2022 | 2023 | 2024 | 2025 | |
|---|---|---|---|---|---|
| Revenue | 4.98B | 4.86B | 5.23B | 6.30B | 7.25B |
| Cost of Revenue | 2.09B | 2.05B | 2.22B | 2.60B | 2.99B |
| Operating Expenses | 1.67B | 1.78B | 1.91B | 2.10B | 2.38B |
| Gross Profit | 2.89B | 2.81B | 3.00B | 3.70B | 4.26B |
| EBITDA | 1.37B | 1.19B | 1.27B | 1.77B | 1.88B |
| EBIT | 1.22B | 1.03B | 1.09B | 1.59B | 0 |
| Interest Expense | 0 | 0 | 0 | 0 | 0 |
| Net Income | 1.08B | 974M | 1.29B | 1.41B | 1.66B |
| EPS | 5.63 | 5.06 | 6.74 | 7.35 | 8.65 |
| Filing Date | 2022-02-16 | 2023-02-22 | 2024-11-29 | 2025-02-19 | 2026-02-18 |
Income Statement Evolution
From 2021 to 2025, Garmin Ltd. grew revenue by 45.4% to $7.25B, with net income rising 53.8% to $1.66B. Gross margin remained strong near 59%, reflecting stable cost control. Operating expenses scaled proportionally with revenue, maintaining consistent operating leverage. However, EBIT margin collapsed to zero in 2025 after steady positive results in prior years.
Is the Income Statement Favorable?
The 2025 income statement shows robust fundamentals despite the EBIT margin drop. Net margin held near 23%, supported by zero interest expense and a favorable tax rate. Operating income of $1.88B and net income growth of 2.5% year-over-year highlight sustained profitability. Overall, 78.6% of income metrics are favorable, signaling a generally healthy financial profile with caution on EBIT performance.
Financial Ratios
The table below summarizes key financial ratios for Garmin Ltd. over the last five fiscal years, providing insight into profitability, liquidity, leverage, and market valuation:
| Ratios | 2021 | 2022 | 2023 | 2024 | 2025 |
|---|---|---|---|---|---|
| Net Margin | 21.7% | 20.0% | 24.7% | 22.4% | 22.9% |
| ROE | 17.7% | 15.7% | 18.4% | 18.0% | 18.5% |
| ROIC | 17.1% | 14.4% | 15.0% | 16.3% | 16.7% |
| P/E | 24.2 | 18.3 | 19.1 | 28.5 | 0 |
| P/B | 4.28 | 2.86 | 3.51 | 5.13 | 0 |
| Current Ratio | 2.94 | 3.26 | 3.41 | 3.54 | 3.63 |
| Quick Ratio | 2.10 | 2.01 | 2.38 | 2.56 | 2.60 |
| D/E | 0.0115 | 0.0185 | 0.0161 | 0.0207 | 0.0184 |
| Debt-to-Assets | 0.009 | 0.015 | 0.013 | 0.017 | 0.015 |
| Interest Coverage | 0 | 0 | 0 | 0 | 0 |
| Asset Turnover | 0.63 | 0.63 | 0.61 | 0.65 | 0.66 |
| Fixed Asset Turnover | 4.31 | 3.78 | 3.82 | 4.49 | 4.61 |
| Dividend Yield | 1.88% | 3.82% | 2.27% | 1.42% | 0% |
Evolution of Financial Ratios
From 2021 to 2025, Garmin’s Return on Equity (ROE) steadily improved from 17.7% to 18.5%. The Current Ratio increased from 2.94 to 3.63, indicating stronger liquidity. The Debt-to-Equity Ratio remained low and stable around 0.02, reflecting conservative leverage. Profitability showed moderate stability with net margins hovering near 22–23%.
Are the Financial Ratios Fovorable?
In 2025, Garmin’s profitability metrics, including net margin (22.96%) and ROE (18.54%), are favorable, outperforming typical industry averages. Liquidity shows mixed signals: the high Current Ratio (3.63) is unfavorable, while the Quick Ratio (2.6) is favorable. Leverage remains very low with a Debt-to-Equity of 0.02, rated favorable. Asset turnover is neutral, and dividend yield is zero, marked unfavorable. Overall, 64% of ratios are favorable, supporting a generally positive financial profile.
Shareholder Return Policy
Garmin Ltd. maintains a consistent dividend payout ratio near 40%, supported by ample free cash flow coverage. The dividend per share has shown moderate growth, while the dividend yield hovered around 1.4% in 2025, with no mention of share buybacks.
This payout approach appears sustainable given Garmin’s strong cash ratios and operating cash flow coverage. The absence of share repurchases limits capital return flexibility but aligns with maintaining steady, covered dividends supporting long-term shareholder value.
Score analysis
Here is a radar chart illustrating Garmin Ltd.’s key financial scores across multiple valuation and performance metrics:
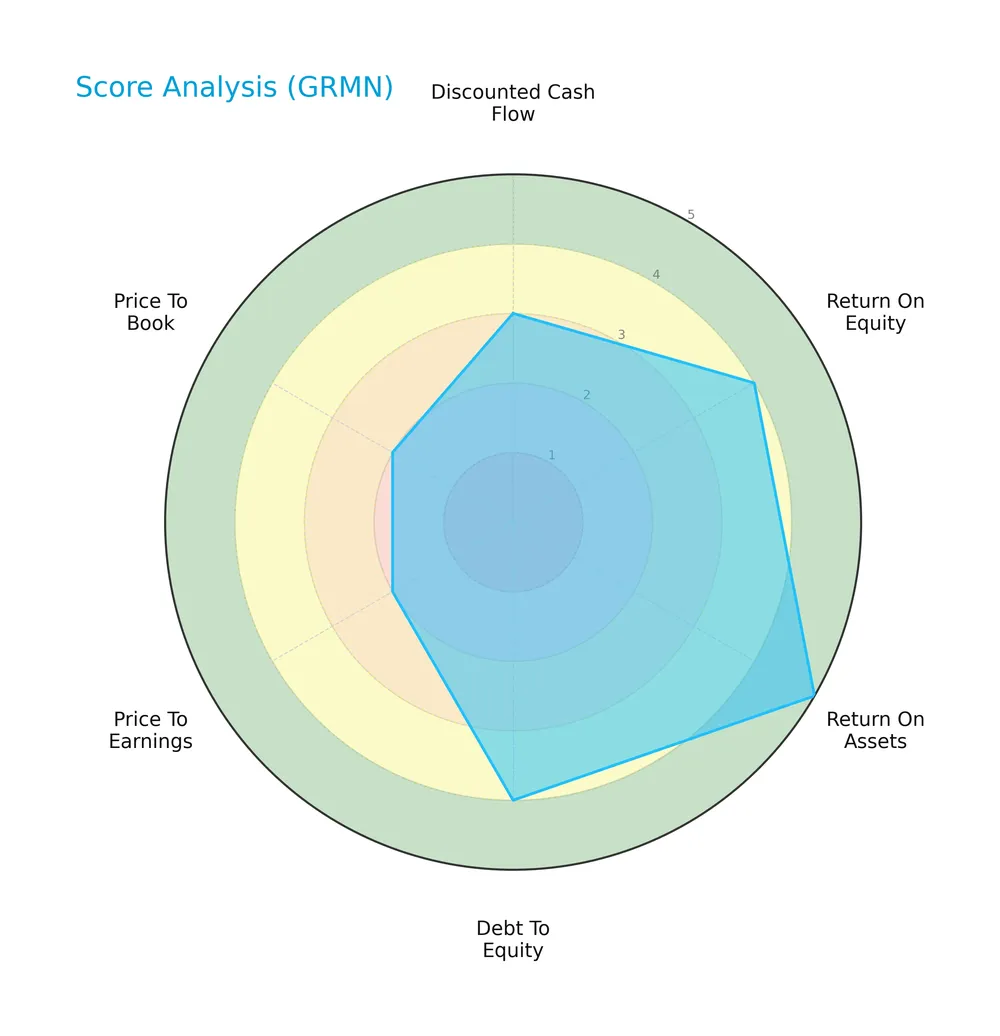
Garmin scores favorably on return on equity (4) and debt-to-equity (4), with an excellent return on assets score (5). However, valuation metrics show weaknesses, with price-to-earnings and price-to-book scores at 2, indicating less attractive pricing. The discounted cash flow score is moderate at 3.
Analysis of the company’s bankruptcy risk
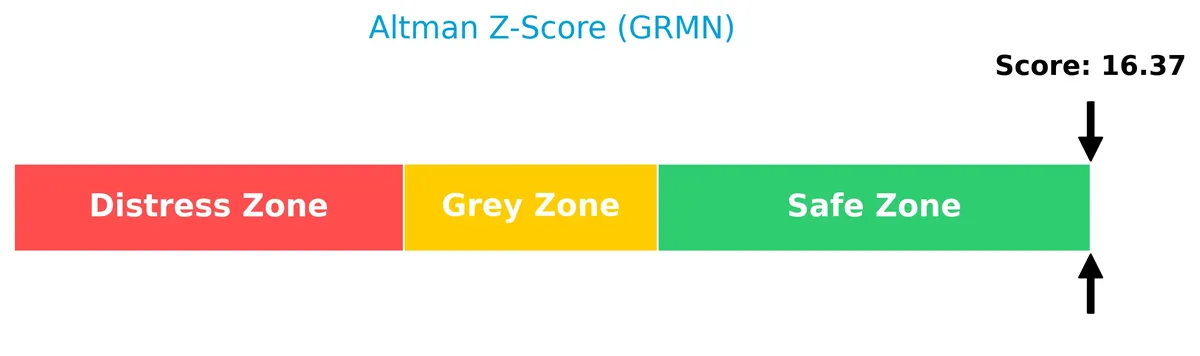
Garmin’s Altman Z-Score places it firmly in the safe zone, indicating very low bankruptcy risk based on financial stability and leverage:
Is the company in good financial health?
The Piotroski Score diagram provides insight into Garmin’s financial health based on profitability, leverage, and efficiency metrics:

With a Piotroski Score of 5, Garmin exhibits average financial health. This suggests moderate overall strength but room for improvement relative to stronger companies scoring 8 or 9.
Competitive Landscape & Sector Positioning
This sector analysis examines Garmin Ltd.’s strategic positioning, revenue streams, and product portfolio within the technology industry. I will evaluate Garmin’s competitive advantages versus its main competitors to identify strengths and weaknesses.
Strategic Positioning
Garmin Ltd. maintains a diversified product portfolio spanning Fitness, Outdoor, Marine, Aviation, and Automotive segments, each generating significant revenue. Geographically, it operates broadly across Americas (3.45B), EMEA (2.74B), and Asia Pacific (1.05B), reflecting balanced global exposure and reducing regional risk.
Revenue by Segment
This pie chart illustrates Garmin Ltd.’s revenue distribution by product segment for the fiscal year 2025, highlighting the company’s diverse business lines.
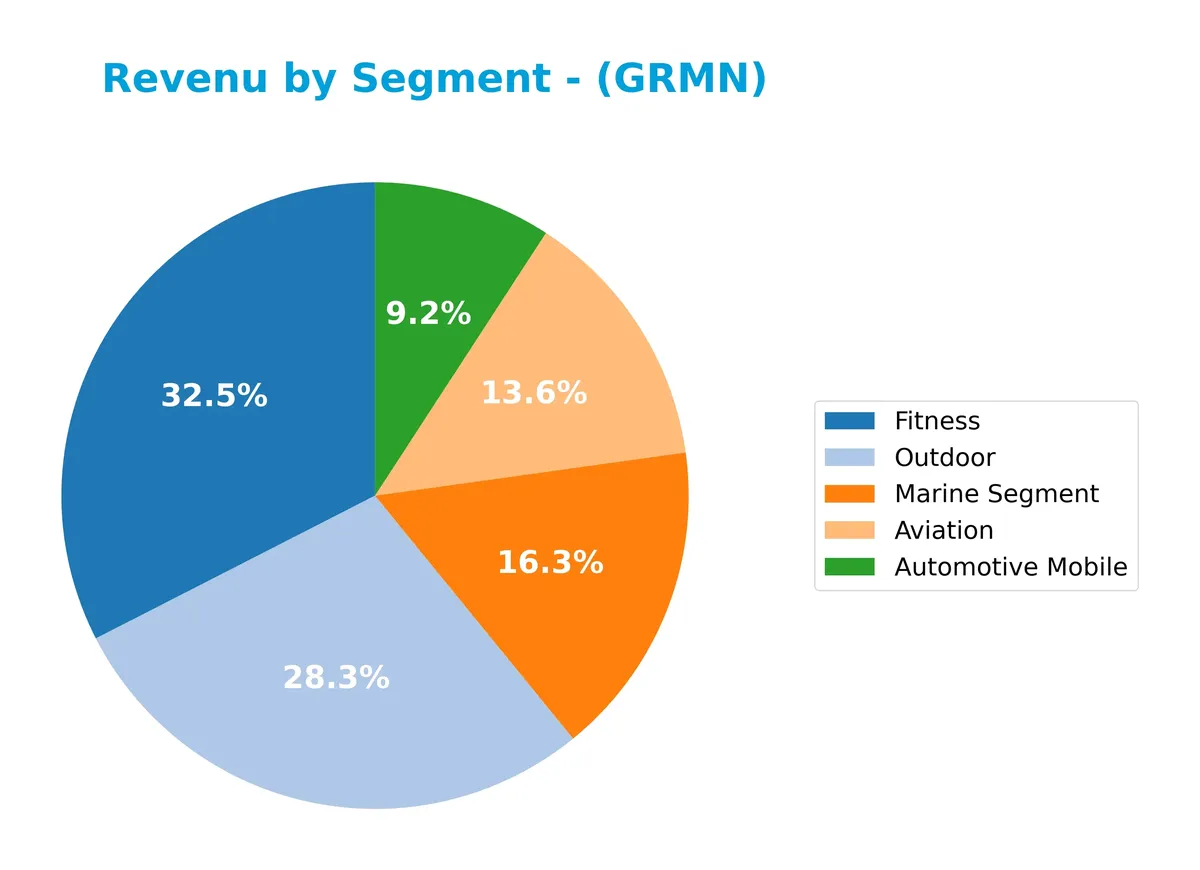
In 2025, Fitness leads with $2.36B, reflecting robust consumer health demand. Outdoor follows closely at $2.05B, showing steady growth. Marine and Aviation segments contribute $1.18B and $987M respectively, both exhibiting solid expansion. Automotive Mobile, the smallest at $665M, grows slower but remains stable. The trend indicates Garmin’s increasing reliance on Fitness and Outdoor, signaling concentration risk if consumer trends shift sharply.
Key Products & Brands
The table below outlines Garmin Ltd.’s main products and brands across its diverse business segments:
| Product | Description |
|---|---|
| Fitness | Running and multi-sport watches, cycling products, activity trackers, smartwatches, and accessories. Includes Garmin Connect platforms and Connect IQ development tools. |
| Outdoor | Adventure watches, outdoor handheld devices, golf equipment, mobile apps, and dog tracking/training devices. |
| Aviation | Aircraft avionics including integrated flight decks, flight displays, navigation, communication, safety, and connectivity solutions. |
| Marine Segment | Chartplotters, multi-function displays, fish finders, sonar, autopilots, radars, VHF radios, sailing products, and trolling motors. |
| Automotive Mobile | Embedded computing models, infotainment systems, personal navigation devices, and cameras for automotive use. |
Garmin’s product portfolio spans fitness wearables to aviation avionics, reflecting robust diversification. Their technology integrates hardware with software platforms, enhancing user experience across markets.
Main Competitors
Garmin Ltd. competes with 20 companies in its sector; below is a list of the top 10 leaders by market capitalization:
| Competitor | Market Cap. |
|---|---|
| Amphenol Corporation | 171B |
| Corning Incorporated | 77.7B |
| TE Connectivity Ltd. | 68.6B |
| Sandisk Corporation | 40.0B |
| Garmin Ltd. | 38.9B |
| Keysight Technologies, Inc. | 35.5B |
| Celestica Inc. | 34.0B |
| Coherent, Inc. | 28.7B |
| Jabil Inc. | 25.7B |
| Teledyne Technologies Incorporated | 24.4B |
Garmin Ltd. ranks 5th among these competitors. Its market cap is approximately 27% of the leader, Amphenol Corporation. Garmin sits below the top 10 average market cap of 54.4B but remains above the sector median of 21.6B. It maintains a 12.47% gap from the next competitor above, Sandisk Corporation, reflecting a moderate competitive distance.
Comparisons with competitors
Check out how we compare the company to its competitors:
Does Garmin have a competitive advantage?
Garmin demonstrates a competitive advantage, evidenced by a favorable ROIC exceeding its WACC by 8.3%, indicating efficient capital use and value creation. However, its declining ROIC trend signals pressure on future profitability.
Looking ahead, Garmin’s diverse product lines in fitness, outdoor, aviation, marine, and automotive markets support growth opportunities. Continued innovation in wearable technology and global expansion could sustain competitive positioning despite margin challenges.
SWOT Analysis
This analysis highlights Garmin Ltd.’s key internal strengths and weaknesses alongside external opportunities and threats shaping its strategic outlook.
Strengths
- strong net margin at 23%
- diversified product segments across fitness, aviation, marine, and automotive
- robust revenue growth of 15% in 2025
Weaknesses
- declining EBIT margin indicates operational challenges
- current ratio unusually high at 3.63 may signal inefficient asset use
- average Piotroski score of 5 suggests room for financial improvement
Opportunities
- expanding wearable tech market
- growth in global aviation and marine electronics
- increasing digital platform integration like Garmin Connect
Threats
- intense competition in consumer electronics
- supply chain risks impacting hardware manufacturing
- rapid technology shifts requiring continuous innovation
Garmin’s solid profit margins and diversified portfolio underpin resilience. However, operational efficiency and financial health need monitoring. Strategic focus should leverage growth trends while addressing margin pressures and competitive threats.
Stock Price Action Analysis
The weekly stock chart displays Garmin Ltd.’s price movements over the last 12 months, highlighting key highs and lows:
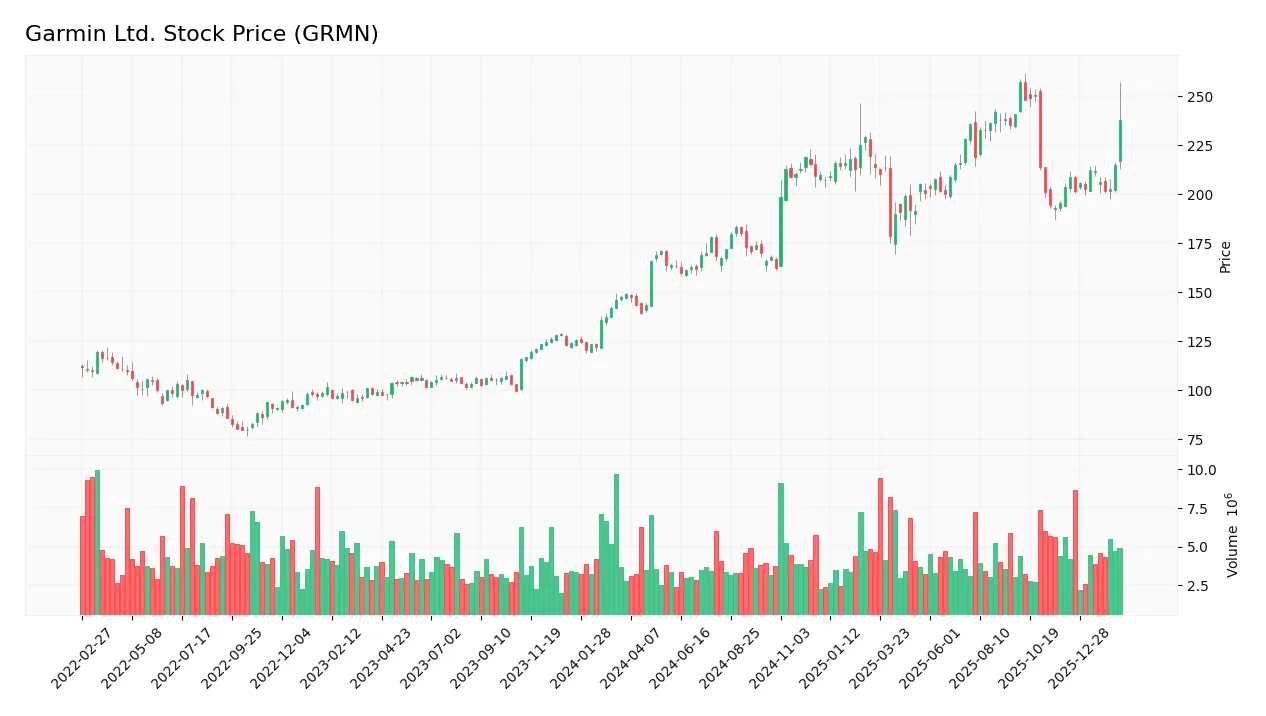
Trend Analysis
Over the past year, Garmin Ltd. shares rose 59.51%, indicating a strong bullish trend with accelerating momentum. Price volatility is significant, with a 27.16 standard deviation. The stock peaked at 257.06 and bottomed at 139.52, confirming robust upward dynamics.
Volume Analysis
Trading volume shows an increasing trend over the last three months. Buyer activity slightly dominates with 56.84% of volume, suggesting cautious optimism among investors. This rising participation signals strengthening demand and growing market confidence.
Target Prices
Analysts set a clear target price consensus for Garmin Ltd., reflecting moderate upside potential.
| Target Low | Target High | Consensus |
|---|---|---|
| 193 | 310 | 240 |
The target range suggests cautious optimism, with a consensus price indicating about 10-15% upside from current levels. This aligns with steady sector performance but warrants monitoring for execution risks.

Don’t Let Luck Decide Your Entry Point
Optimize your entry points with our advanced ProRealTime indicators. You’ll get efficient buy signals with precise price targets for maximum performance. Start outperforming now!
Analyst & Consumer Opinions
This section reviews analyst grades and consumer feedback to provide a balanced perspective on Garmin Ltd.’s market standing.
Stock Grades
The following table presents recent verified analyst grades for Garmin Ltd., reflecting diverse views across reputable firms:
| Grading Company | Action | New Grade | Date |
|---|---|---|---|
| Barclays | Upgrade | Equal Weight | 2026-01-16 |
| Tigress Financial | Maintain | Strong Buy | 2025-12-19 |
| Longbow Research | Upgrade | Buy | 2025-12-03 |
| Barclays | Maintain | Underweight | 2025-10-30 |
| Morgan Stanley | Maintain | Underweight | 2025-10-30 |
| Tigress Financial | Maintain | Strong Buy | 2025-09-30 |
| Morgan Stanley | Maintain | Underweight | 2025-09-19 |
| Morgan Stanley | Maintain | Underweight | 2025-07-31 |
| Barclays | Maintain | Underweight | 2025-07-31 |
| JP Morgan | Maintain | Neutral | 2025-07-17 |
The grade trend shows a split between cautious underweight stances and more optimistic buy ratings. Notably, Barclays recently upgraded Garmin to equal weight, signaling a more balanced outlook after a series of underweight ratings.
Consumer Opinions
Garmin Ltd. consistently earns praise for reliable performance but faces criticism on software updates.
| Positive Reviews | Negative Reviews |
|---|---|
| “Durable devices with accurate GPS tracking.” | “Frequent software glitches after updates.” |
| “Long battery life, perfect for outdoor activities.” | “Customer service response times can be slow.” |
| “User-friendly interface and valuable fitness features.” | “Limited app integration compared to competitors.” |
Consumers value Garmin’s hardware reliability and intuitive design. However, software issues and customer support delays remain notable pain points.
Risk Analysis
Below is a summary of key risks that could affect Garmin Ltd.’s performance and valuation:
| Category | Description | Probability | Impact |
|---|---|---|---|
| Liquidity Risk | Current ratio unusually high at 3.63, suggesting inefficient use of assets. | Medium | Medium |
| Interest Coverage | No available interest coverage ratio, indicating potential vulnerability. | Low | High |
| Market Volatility | Beta near 1.0 implies stock moves with market, exposing it to broad shocks. | Medium | Medium |
| Valuation Risk | Price-to-earnings and price-to-book scores unfavorable, possible overpricing. | High | Medium |
| Dividend Yield | Zero dividend yield may deter income-focused investors. | High | Low |
Garmin shows a strong financial position overall but risks linger. The unusually high current ratio hints at capital inefficiency. Lack of interest coverage data warrants caution on debt servicing. Valuation metrics flag the stock as potentially expensive despite solid fundamentals.
Should You Buy Garmin Ltd.?
Garmin Ltd. appears to be a profitable company with robust operational efficiency but shows a slightly declining competitive moat. Its leverage profile remains manageable, supported by a very favorable A- rating and a safe-zone Altman Z-Score, suggesting a stable financial position.
Strength & Efficiency Pillars
Garmin Ltd. demonstrates solid profitability with a net margin of 22.96% and a return on equity (ROE) of 18.54%. Its return on invested capital (ROIC) stands at 16.71%, comfortably above its weighted average cost of capital (WACC) at 8.39%, confirming the company as a value creator. Despite a slight decline in ROIC trend, Garmin sustains excellent operational margins and efficient asset use, supported by a favorable fixed asset turnover of 4.61x. These metrics underscore operational strength and disciplined capital allocation.
Weaknesses and Drawbacks
Garmin’s valuation shows some red flags, with price-to-earnings (P/E) and price-to-book (P/B) scores marked as favorable but current ratio at 3.63 flagged unfavorable, suggesting potential liquidity inefficiencies despite strong solvency. Interest coverage is reported at zero, raising concerns about the company’s ability to service debt if costs rise. While debt-to-equity is low at 0.02, the high current ratio could indicate underutilized working capital, which may pressure near-term returns. These factors warrant caution despite solid fundamentals.
Our Final Verdict about Garmin Ltd.
Garmin’s long-term fundamentals appear attractive, underpinned by sustained profitability and a robust capital structure outside of minor liquidity concerns. The stock trend is bullish with accelerating momentum, and recent buyer dominance at 56.84% suggests positive investor sentiment. However, the slightly unfavorable liquidity ratios and zero interest coverage suggest a watchful stance. Overall, Garmin may appear suitable for investors seeking value creation but might warrant a wait-and-see approach for more favorable liquidity signals.
Disclaimer: This content is for informational purposes only and does not constitute financial, investment, or other professional advice. Investing in financial markets involves a significant risk of loss, and past performance is not indicative of future results.
Additional Resources
- Decoding Garmin Ltd (GRMN): A Strategic SWOT Insight – GuruFocus (Feb 19, 2026)
- Garmin shares jump 9.4% as Q4 results and 2026 guidance beat expectations, with shareholder returns boosted – Quiver Quantitative (Feb 19, 2026)
- Garmin Ltd Reveals Climb In Q4 Bottom Line – Nasdaq (Feb 18, 2026)
- Garmin: Fitness And Aviation Are The Stars In The Future (Q4 Review) (NYSE:GRMN) – Seeking Alpha (Feb 18, 2026)
- A great week that adds to Garmin Ltd.’s (NYSE:GRMN) one-year returns, institutional investors who own 57% must be happy – Yahoo Finance (Feb 14, 2026)
For more information about Garmin Ltd., please visit the official website: garmin.com