Home > Analyses > Basic Materials > Freeport-McMoRan Inc.
Freeport-McMoRan powers the modern world by mining essential metals like copper, gold, and molybdenum that fuel infrastructure and technology. Its vast operations span the Americas and Indonesia, anchoring its status as an industry titan known for operational scale and innovation. With flagship assets like the Grasberg minerals district and Morenci mine, Freeport shapes global supply chains. The key question: can its robust fundamentals sustain growth amid volatile commodity markets in 2026?
Table of contents
Business Model & Company Overview
Freeport-McMoRan Inc., founded in 1987 and headquartered in Phoenix, Arizona, commands a dominant position in the copper mining industry. It operates a cohesive ecosystem of mineral exploration and extraction across North and South America and Indonesia. Its portfolio spans copper, gold, molybdenum, silver, and oil and gas assets, including flagship sites like Grasberg in Indonesia and Morenci in Arizona, underscoring its global reach and resource diversity.
The company drives value through a balanced blend of mining operations and energy production, leveraging both metals and oil assets. Its revenue engine benefits from a strategic footprint in the Americas and Asia, maximizing exposure to growth markets. Freeport-McMoRan’s economic moat lies in its vast, high-quality reserves and operational scale, positioning it as a key influence on the future of global copper supply.
Financial Performance & Fundamental Metrics
I will analyze Freeport-McMoRan Inc.’s income statement, key financial ratios, and dividend payout policy to assess its core financial health and shareholder value approach.
Income Statement
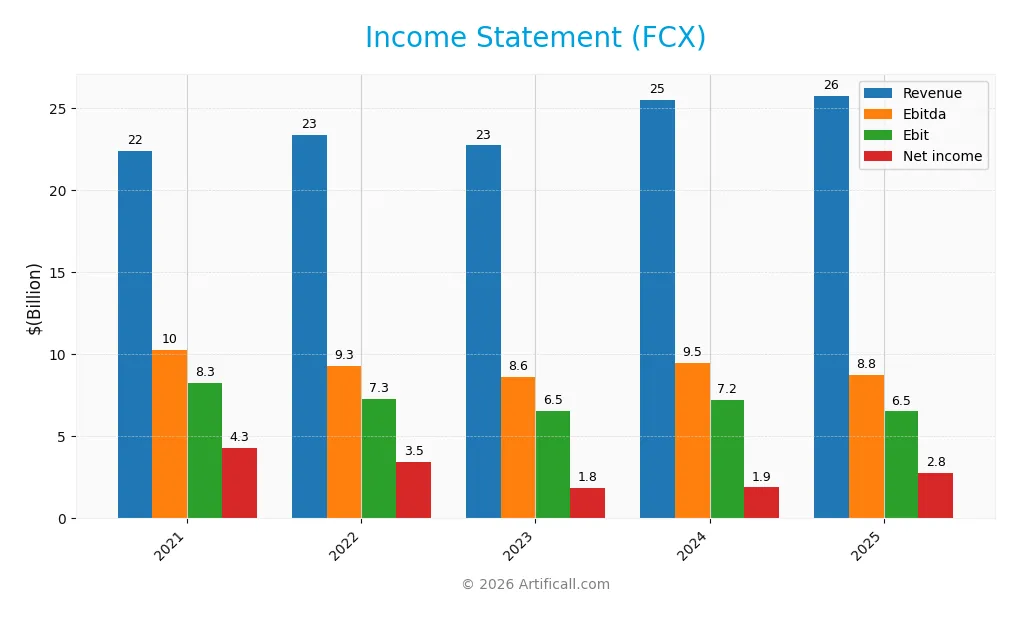
This table summarizes Freeport-McMoRan Inc.’s key income statement figures from 2021 through 2025, providing a clear view of revenue, expenses, and profitability trends.
| 2021 | 2022 | 2023 | 2024 | 2025 | |
|---|---|---|---|---|---|
| Revenue | 22.36B | 23.33B | 22.71B | 25.46B | 25.74B |
| Cost of Revenue | 14.07B | 15.24B | 15.83B | 17.95B | 18.80B |
| Operating Expenses | 474M | 541M | 798M | 640M | 655M |
| Gross Profit | 8.29B | 8.09B | 6.88B | 7.50B | 6.95B |
| EBITDA | 10.26B | 9.29B | 8.59B | 9.47B | 8.76B |
| EBIT | 8.26B | 7.28B | 6.52B | 7.23B | 6.51B |
| Interest Expense | 602M | 560M | 515M | 319M | 369M |
| Net Income | 4.30B | 3.46B | 1.84B | 1.88B | 2.76B |
| EPS | 2.93 | 2.40 | 1.28 | 1.31 | 1.53 |
| Filing Date | 2022-02-15 | 2023-02-15 | 2024-02-16 | 2025-02-14 | 2026-02-13 |
Income Statement Evolution
From 2021 to 2025, Freeport-McMoRan’s revenue grew modestly by 15.1%, with a slight slowdown to 1.1% in the last year. Gross profit declined 7.4% in 2025, reflecting margin pressure despite a stable gross margin near 27%. EBIT dropped nearly 10% last year, signaling rising costs against revenue, while net margin improved by 45%, showing efficiency gains.
Is the Income Statement Favorable?
In 2025, Freeport-McMoRan reported $25.7B revenue and $2.76B net income, yielding a 10.7% net margin, which is favorable against sector benchmarks. EBIT margin at 25.3% and interest expense at 1.43% of revenue indicate disciplined capital cost management. However, declines in gross profit and EBIT highlight operational challenges, balancing the overall neutral fundamental outlook.
Financial Ratios
The following table summarizes key financial ratios for Freeport-McMoRan Inc. (FCX) over the last five fiscal years, providing a snapshot of profitability, valuation, liquidity, leverage, and operational efficiency:
| Ratios | 2021 | 2022 | 2023 | 2024 | 2025 |
|---|---|---|---|---|---|
| Net Margin | 19% | 15% | 8% | 7% | 11% |
| ROE | 31% | 22% | 11% | 11% | 15% |
| ROIC | 13% | 11% | 8% | 9% | 9% |
| P/E | 14.2 | 15.8 | 33.1 | 29.2 | 26.6 |
| P/B | 4.38 | 3.52 | 3.66 | 3.13 | 3.88 |
| Current Ratio | 2.52 | 2.46 | 2.42 | 2.42 | 2.29 |
| Quick Ratio | 1.75 | 1.64 | 1.38 | 1.18 | 2.29 |
| D/E | 0.70 | 0.70 | 0.59 | 0.55 | 0.02 |
| Debt-to-Assets | 20% | 21% | 19% | 18% | 1% |
| Interest Coverage | 13.0 | 13.5 | 11.8 | 21.5 | 17.0 |
| Asset Turnover | 0.47 | 0.46 | 0.43 | 0.46 | 0.44 |
| Fixed Asset Turnover | 0.74 | 0.72 | 0.64 | 0.66 | 0.63 |
| Dividend Yield | 0.54% | 1.58% | 1.41% | 1.57% | 1.18% |
*Net Margin, ROE, and ROIC are presented as percentages. *D/E and Debt-to-Assets ratios are decimals representing leverage levels. *P/E and P/B are valuation multiples. *Liquidity ratios show the company’s short-term financial health. *Interest Coverage measures ability to meet interest obligations. *Turnover ratios indicate efficiency in asset utilization. *Dividend Yield reflects cash returns to shareholders.
Evolution of Financial Ratios
Return on Equity (ROE) has generally declined from 30.8% in 2021 to 14.6% in 2025, signaling weakening profitability. The Current Ratio remains robust and stable, hovering around 2.3, reflecting consistent liquidity. Debt-to-Equity Ratio dramatically decreased to 0.02 in 2025, indicating a significant reduction in financial leverage and improved balance sheet strength.
Are the Financial Ratios Favorable?
In 2025, profitability shows mixed signals: net margin is favorable at 10.7%, but ROIC at 8.6% lags behind WACC at 10.5%, a red flag. Liquidity ratios (current and quick) are favorable above 2.2. Leverage metrics, including debt-to-equity (0.02) and debt-to-assets (0.8%), are very favorable. However, efficiency ratios like asset turnover (0.44) and fixed asset turnover (0.63) are unfavorable. Market valuation ratios (PE 26.6, PB 3.88) are also unfavorable, reflecting premium pricing. Overall, ratios are slightly favorable with notable risks.
Shareholder Return Policy
Freeport-McMoRan Inc. maintains a consistent dividend policy with a payout ratio around 31% in 2025 and a dividend yield near 1.18%. Dividend coverage by free cash flow is tight, suggesting cautious capital allocation amid modest free cash flow per share of 0.77. The company also engages in share buybacks, balancing returns with reinvestment needs.
This distribution approach supports steady shareholder returns without compromising financial stability. The moderate payout and buyback strategy appear aligned with sustaining long-term value creation, given Freeport-McMoRan’s solid operating margins and prudent leverage levels. However, limited free cash flow coverage signals a need for ongoing monitoring of capital deployment risks.
Score analysis
Here is a comprehensive radar chart presenting Freeport-McMoRan Inc.’s key financial scores:
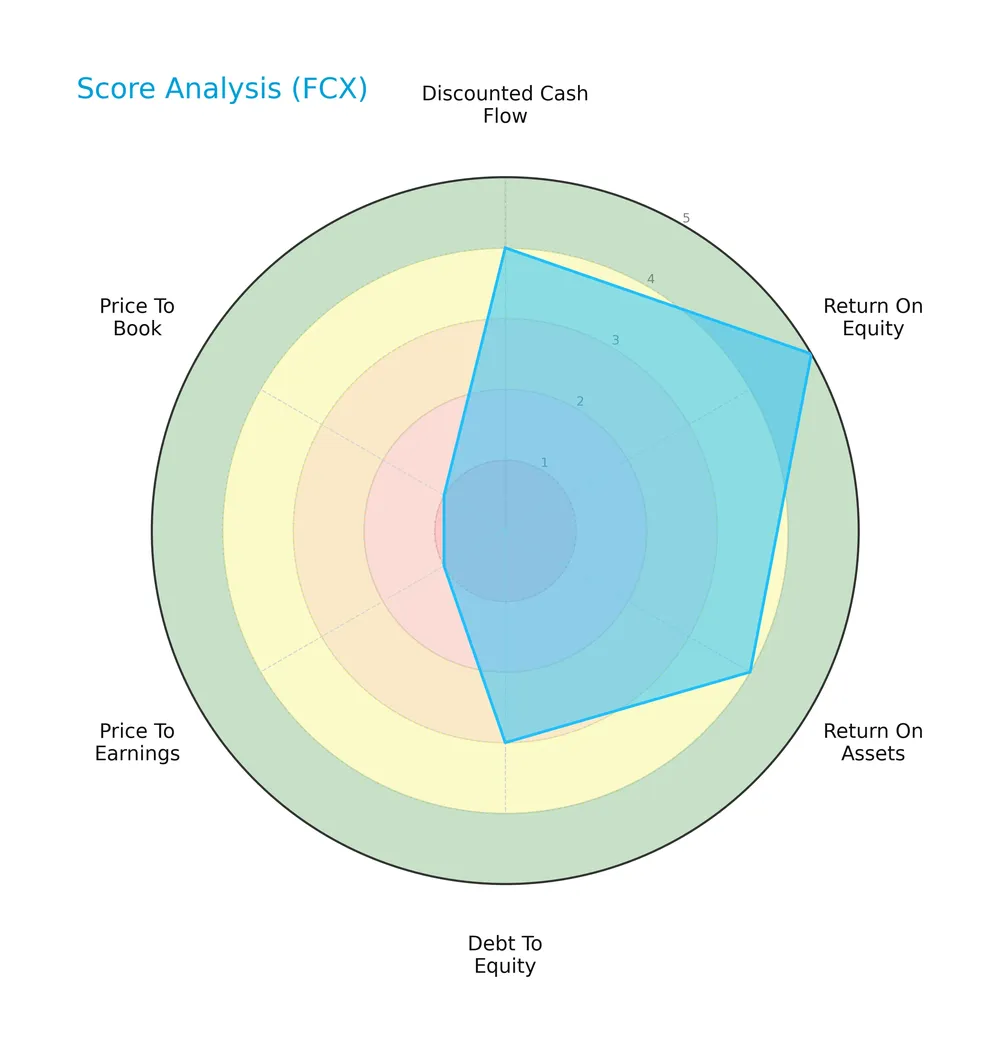
The company shows strong returns with a very favorable ROE score of 5 and favorable ROA at 4. Its discounted cash flow is also favorable at 4. However, valuation metrics appear weak, with very unfavorable scores of 1 for both price-to-earnings and price-to-book ratios. Debt to equity stands moderate at 3, balancing leverage concerns. Overall, the scores reflect a mixed financial profile.
Analysis of the company’s bankruptcy risk
Freeport-McMoRan’s Altman Z-Score places it in the grey zone, indicating moderate bankruptcy risk but not immediate distress:

Is the company in good financial health?
The Piotroski Score diagram below illustrates the company’s financial health, currently rated as average:

With a Piotroski score of 4, Freeport-McMoRan demonstrates moderate financial strength. This suggests some operational and profitability concerns, preventing it from being classified as a strong or very strong investment candidate.
Competitive Landscape & Sector Positioning
This analysis will explore Freeport-McMoRan Inc.’s strategic positioning within the copper industry. I will examine revenue segments, key products, and main competitors to clarify its market stance. Next, I will assess whether Freeport-McMoRan holds a competitive advantage over its peers.
Strategic Positioning
Freeport-McMoRan maintains a diversified product portfolio dominated by copper segments, supplemented by gold and molybdenum revenues. Geographically, it operates across North and South America, Asia, and Europe, with significant exposure in the U.S., Indonesia, Japan, and Switzerland, reflecting broad global footprint.
Revenue by Segment
This pie chart illustrates Freeport-McMoRan Inc.’s revenue distribution by product segment for the fiscal year 2025, highlighting the composition across key metals and related products.
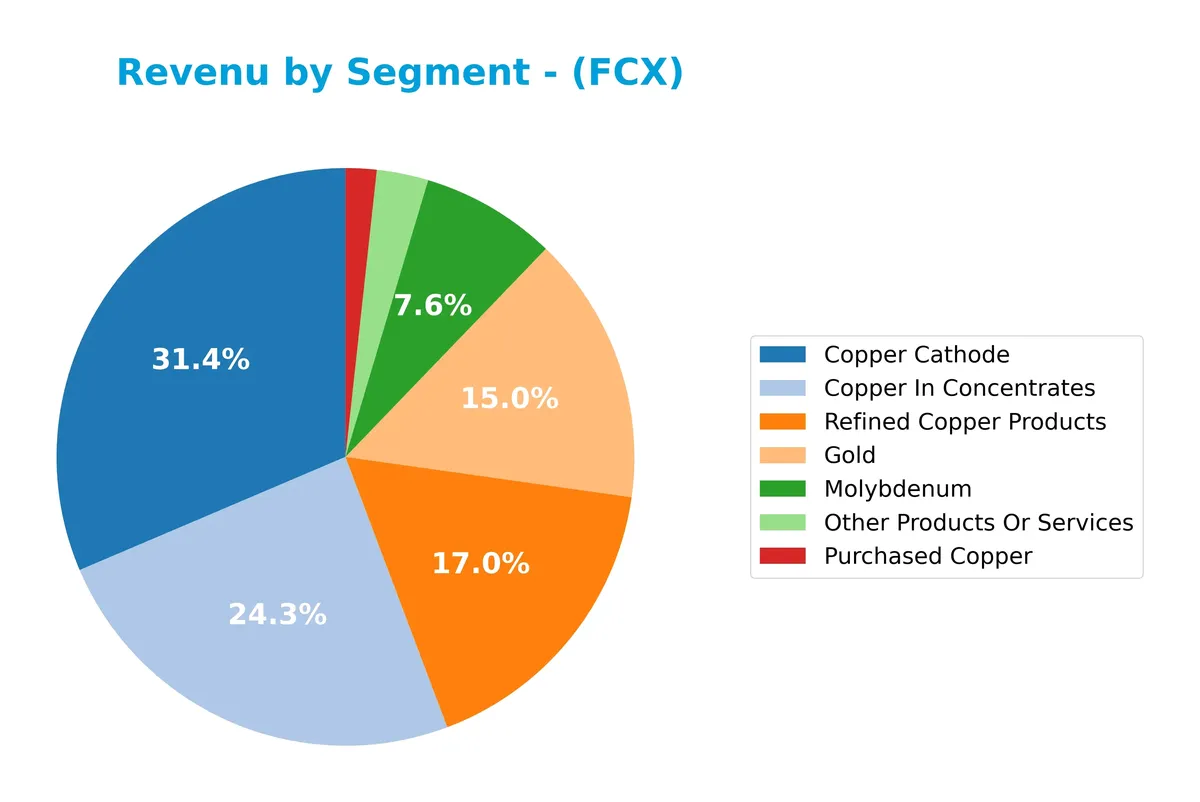
In 2025, Copper Cathode leads revenue with $8.1B, closely followed by Copper In Concentrates at $6.3B. Refined Copper Products also contribute significantly with $4.4B. Gold and Molybdenum generate $3.9B and $2.0B respectively. The recent year shows a slight decline in copper concentrates but stable cathode sales, indicating a potential shift towards refined products and a balanced diversification across metals.
Key Products & Brands
The table below summarizes Freeport-McMoRan’s key products and brands by description:
| Product | Description |
|---|---|
| Copper Cathode | Electrolytically refined copper metal used in electrical and industrial applications. |
| Copper In Concentrates | Copper ore concentrate requiring further refining to produce pure copper metal. |
| Gold | Precious metal extracted as a byproduct and primary commodity from mining operations. |
| Molybdenum | Metal used to strengthen steel and in specialty alloys, produced as a mining byproduct. |
| Other Products Or Services | Includes ancillary mining products and services beyond core metals. |
| Purchased Copper | Copper acquired externally for processing and sale within the refining segment. |
| Refined Copper Products | Copper products processed and refined for industrial and commercial use. |
Freeport-McMoRan generates significant revenue from copper in multiple forms, alongside substantial gold and molybdenum production. The company’s product mix reflects its integrated mining and refining capabilities.
Main Competitors
The Basic Materials sector in Copper includes 21 competitors, with the table listing the top 10 leaders by market capitalization:
| Competitor | Market Cap. |
|---|---|
| Linde plc | 200.4B |
| Newmont Corporation | 110.5B |
| CRH plc | 84.8B |
| The Sherwin-Williams Company | 81.5B |
| Freeport-McMoRan Inc. | 74.6B |
| Ecolab Inc. | 74.4B |
| Air Products and Chemicals, Inc. | 55.8B |
| Corteva, Inc. | 45.8B |
| Nucor Corporation | 38.8B |
| Vulcan Materials Company | 38.7B |
Freeport-McMoRan Inc. ranks 5th among 21 competitors, with a market cap at 45% of the leader Linde plc. The company stands above both the average market cap of the top 10 (80.5B) and the sector median (38.3B). It holds a 9.7% market cap gap from its closest competitor above, signaling a competitive but distinct position within the top tier.
Comparisons with competitors
Check out how we compare the company to its competitors:
Aucun article trouvé pour ces critères.
Does FCX have a competitive advantage?
Freeport-McMoRan Inc. currently lacks a competitive advantage, as its ROIC falls below WACC by nearly 2%, indicating value destruction and declining profitability. The company’s ROIC trend over 2021-2025 worsens, reinforcing a very unfavorable moat status.
Looking ahead, FCX’s geographic diversification spans major mining regions and markets, including Indonesia, the U.S., and Japan, offering potential growth avenues. Continued development of mineral assets and exposure to diverse metals may present future opportunities despite current profitability challenges.
SWOT Analysis
This analysis highlights Freeport-McMoRan’s key internal and external factors affecting its strategic positioning.
Strengths
- strong market presence in copper mining
- diversified geographic footprint including Indonesia and the US
- favorable gross and EBIT margins
Weaknesses
- declining ROIC below WACC indicates value destruction
- unfavorable P/E and P/B ratios suggest overvaluation
- recent negative gross profit and EBIT growth
Opportunities
- rising demand for copper in electric vehicles and renewable energy
- expansion potential in Indonesia and emerging markets
- improving net margin and EPS growth
Threats
- commodity price volatility impacting revenues
- geopolitical risks in key mining regions
- rising operational costs and regulatory pressures
Freeport-McMoRan’s strengths in scale and margins are offset by declining capital efficiency and valuation concerns. The company must leverage growth in copper demand while managing cost and geopolitical risks to restore value creation.
Stock Price Action Analysis
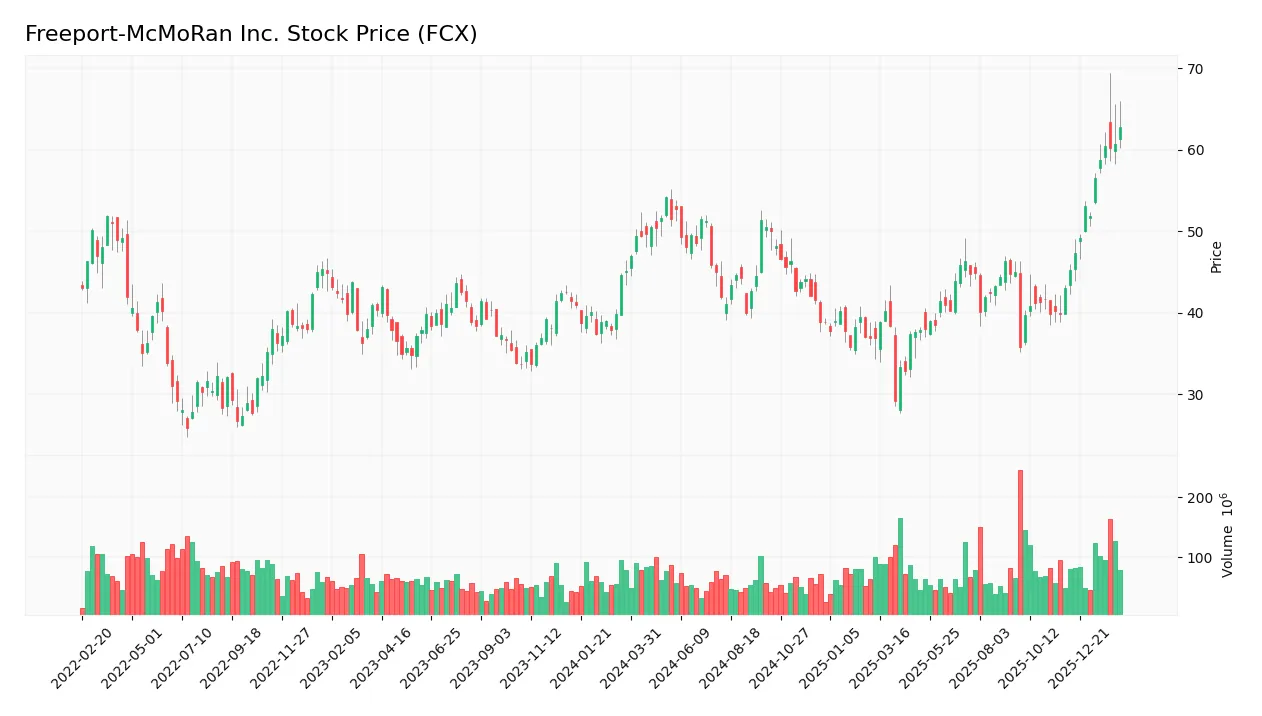
The upcoming weekly chart illustrates Freeport-McMoRan Inc.’s stock price movement over the past 12 months, highlighting key trend shifts and volatility:
Trend Analysis
Over the past 12 months, FCX’s stock rose 39.33%, indicating a bullish trend with accelerating momentum. The price swung between a low of 29.15 and a high of 62.84, reflecting notable volatility with a 6.35 standard deviation. Recent weeks confirm positive slope continuation.
Volume Analysis
Trading volume shows an increasing trend, with buyers dominating 58.91% overall. In the last three months, buyer volume surged, reaching 80.67% dominance. This strong buyer presence signals heightened market participation and sustained investor confidence.
Target Prices
Analysts set a clear target price consensus for Freeport-McMoRan Inc. (FCX).
| Target Low | Target High | Consensus |
|---|---|---|
| 46 | 70 | 58.7 |
The target range suggests moderate upside potential, reflecting cautious optimism amid commodity price volatility.

Don’t Let Luck Decide Your Entry Point
Optimize your entry points with our advanced ProRealTime indicators. You’ll get efficient buy signals with precise price targets for maximum performance. Start outperforming now!
Analyst & Consumer Opinions
This section reviews analyst ratings and consumer feedback to provide insight into Freeport-McMoRan Inc.’s market perception.
Stock Grades
Here are the latest verified stock grades for Freeport-McMoRan Inc. from leading financial institutions:
| Grading Company | Action | New Grade | Date |
|---|---|---|---|
| Scotiabank | Maintain | Sector Outperform | 2026-01-26 |
| UBS | Maintain | Buy | 2026-01-23 |
| Bernstein | Downgrade | Market Perform | 2026-01-23 |
| Wells Fargo | Maintain | Overweight | 2026-01-13 |
| Citigroup | Maintain | Buy | 2026-01-12 |
| JP Morgan | Maintain | Overweight | 2026-01-08 |
| Wells Fargo | Maintain | Overweight | 2025-12-23 |
| UBS | Maintain | Buy | 2025-12-12 |
| JP Morgan | Maintain | Overweight | 2025-12-05 |
| Morgan Stanley | Maintain | Overweight | 2025-11-19 |
The consensus reflects a generally positive outlook, with most firms maintaining buy or overweight ratings. Bernstein’s recent downgrade to market perform is a notable caution amid widespread confidence.
Consumer Opinions
Freeport-McMoRan Inc. sparks diverse reactions, reflecting its broad impact on mining and commodities markets.
| Positive Reviews | Negative Reviews |
|---|---|
| Strong product quality and consistent supply. | Environmental concerns and community impact. |
| Reliable delivery times, even during market shifts. | Occasional price volatility frustrates buyers. |
| Transparent communication from management. | Limited innovation in sustainable practices. |
Overall, consumers praise Freeport-McMoRan for reliability and quality. However, environmental impact and sustainability lag behind peers, posing long-term risks to reputation and regulatory compliance.
Risk Analysis
Here is a summary of key risks facing Freeport-McMoRan Inc., categorized by probability and impact:
| Category | Description | Probability | Impact |
|---|---|---|---|
| Commodity Price | Volatility in copper and gold prices affects revenues. | High | High |
| Operational | Risks related to mining operations and geopolitical issues in Indonesia and South America | Medium | High |
| Financial | WACC (10.49%) exceeds ROIC (8.55%), indicating capital cost pressure | Medium | Medium |
| Valuation | Elevated P/E (26.55) and P/B (3.88) ratios suggest overvaluation risk | Medium | Medium |
| Liquidity | Strong current and quick ratios (2.29), but asset turnover remains low | Low | Low |
| Regulatory | Environmental regulations could increase costs and limit operations | Medium | Medium |
The most significant risks are commodity price swings and geopolitical factors, which historically drive earnings volatility in this sector. Freeport’s position in the grey zone on the Altman Z-Score signals moderate financial risk, demanding close monitoring amid market cycles.
Should You Buy Freeport-McMoRan Inc.?
Freeport-McMoRan appears to show improving profitability but a very unfavorable, declining moat, indicating value destruction. Despite a manageable leverage profile and a B+ rating suggesting overall strength, caution remains due to mixed financial health signals.
Strength & Efficiency Pillars
Freeport-McMoRan Inc. shows solid operational margins, with a gross margin of 26.98% and EBIT margin of 25.3%. The net margin stands at a respectable 10.72%, reflecting efficient cost management. Return on equity at 14.6% is neutral but stable. However, the company’s ROIC of 8.55% falls short of the WACC at 10.49%, indicating it is currently destroying value rather than creating it. This signals caution despite decent profitability metrics.
Weaknesses and Drawbacks
The company is not in financial distress, with an Altman Z-Score of 2.98 placing it in the grey zone. Still, valuation metrics pose significant concerns. The P/E ratio of 26.55 and P/B ratio of 3.88 suggest a premium market valuation, increasing downside risk if growth disappoints. Asset turnover ratios are weak, indicating inefficient asset use. While leverage is low (Debt-to-Equity 0.02) and liquidity strong (Current Ratio 2.29), these positives are offset by mixed growth trends and market uncertainties.
Our Final Verdict about Freeport-McMoRan Inc.
Freeport-McMoRan’s profile could appear as a moderate risk with operational strengths but structural inefficiencies and valuation concerns. The grey zone Z-Score suggests some solvency caution is warranted. Despite a bullish overall stock trend and strong recent buyer dominance, the company’s value destruction and mixed growth signal that investors might prefer a wait-and-see approach for a better entry point.
Disclaimer: This content is for informational purposes only and does not constitute financial, investment, or other professional advice. Investing in financial markets involves a significant risk of loss, and past performance is not indicative of future results.
Additional Resources
- Freeport-McMoRan Inc. (FCX) is Attracting Investor Attention: Here is What You Should Know – Yahoo Finance (Feb 11, 2026)
- Freeport-McMoRan (FCX) Upgraded to Buy by Argus Research | FCX S – GuruFocus (Feb 13, 2026)
- FREEPORT-MCMORAN INC SEC 10-K Report – TradingView (Feb 13, 2026)
- Surging Earnings Estimates Signal Upside for Freeport-McMoRan (FCX) Stock – Finviz (Feb 11, 2026)
- Freeport-McMoRan (FCX) Is Up 0.73% in One Week: What You Should Know – Yahoo Finance (Feb 10, 2026)
For more information about Freeport-McMoRan Inc., please visit the official website: fcx.com