Home > Analyses > Financial Services > Franklin Resources, Inc.
Franklin Resources, Inc. profoundly influences the asset management landscape by shaping how millions of investors grow and protect their wealth. As a stalwart in financial services since 1947, Franklin commands respect for its diverse portfolio of equity, fixed income, and multi-asset mutual funds. Renowned for innovation and disciplined management, the company continues to expand its global reach. The key question now is whether Franklin’s solid fundamentals still support its current market valuation and future growth prospects.

Table of contents
Business Model & Company Overview
Franklin Resources, Inc., founded in 1947 and headquartered in San Mateo, California, stands as a prominent asset management holding company. With a workforce of 10K employees and a market cap of $13.2B, it operates through subsidiaries offering a cohesive ecosystem of equity, fixed income, balanced, and multi-asset mutual funds. Its client base includes individuals, institutions, pension plans, trusts, and partnerships, reflecting a broad, diversified presence in financial services.
The company’s revenue engine is driven by its diversified fund offerings, investing across public equity, fixed income, and alternative markets. Franklin Resources maintains a strategic global footprint with offices in the US and Hyderabad, India, enabling it to capture growth across the Americas, Europe, and Asia. Its competitive advantage lies in its integrated investment solutions and strong brand recognition, cementing its role as a key player shaping the future of asset management.
Financial Performance & Fundamental Metrics
This section analyzes Franklin Resources, Inc.’s income statement, key financial ratios, and dividend payout policy to provide a clear view of its fundamental strength.
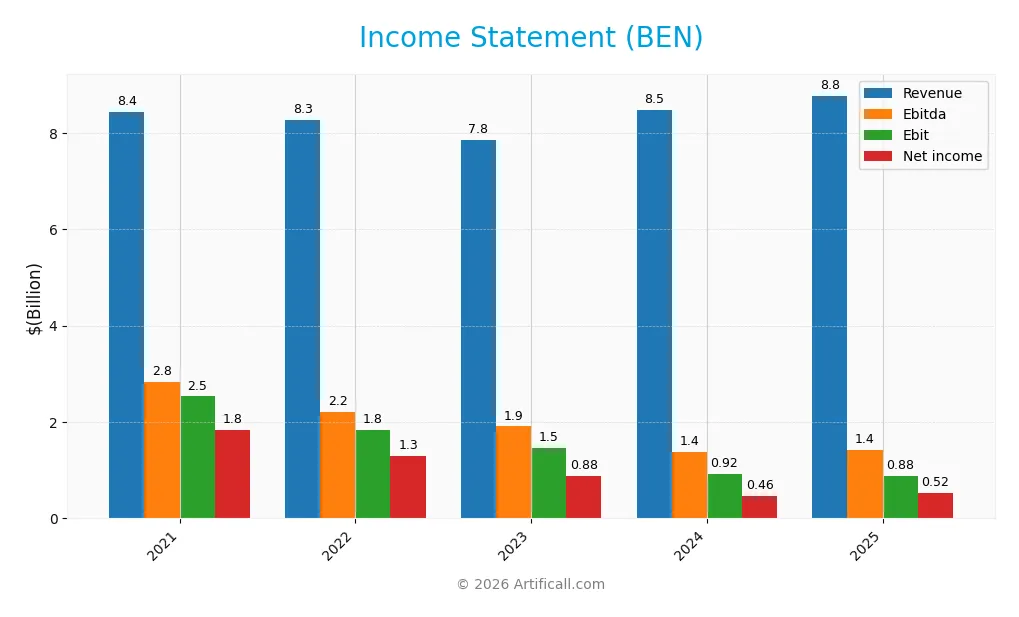
Income Statement
The table below summarizes Franklin Resources, Inc.’s key income statement figures for the fiscal years 2021 through 2025, expressed in USD.
| 2021 | 2022 | 2023 | 2024 | 2025 | |
|---|---|---|---|---|---|
| Revenue | 8.43B | 8.28B | 7.85B | 8.48B | 8.77B |
| Cost of Revenue | 1.43B | 1.43B | 1.50B | 1.69B | 1.72B |
| Operating Expenses | 5.12B | 5.08B | 5.25B | 6.38B | 6.44B |
| Gross Profit | 7.00B | 6.85B | 6.35B | 6.79B | 7.05B |
| EBITDA | 2.84B | 2.21B | 1.91B | 1.38B | 1.41B |
| EBIT | 2.53B | 1.83B | 1.46B | 0.92B | 0.88B |
| Interest Expense | 85.4M | 98.2M | 123.7M | 97.2M | 94.9M |
| Net Income | 1.83B | 1.29B | 883M | 465M | 525M |
| EPS | 3.58 | 2.53 | 1.72 | 0.85 | 1.02 |
| Filing Date | 2021-11-19 | 2022-11-14 | 2023-11-14 | 2024-11-12 | 2025-11-10 |
Income Statement Evolution
Franklin Resources, Inc. experienced modest revenue growth of 3.45% in 2025, continuing a neutral trend over 2021-2025 with a 4.1% overall increase. However, net income declined sharply by 71.34% over the period, despite a 9.16% net margin improvement in 2025. Gross margins remained stable and favorable at 80.34%, while EBIT margins contracted slightly but stayed positive.
Is the Income Statement Favorable?
In 2025, the company’s fundamentals appear generally favorable, supported by a solid gross margin of 80.34% and an EBIT margin of 10.05%. Interest expense remains low at 1.08% of revenue, contributing positively to profitability. Although EBIT declined by 4.2% year-on-year, net margin and EPS growth were favorable at 9.16% and 7.06%, respectively, reflecting effective cost management and operational efficiency.
Financial Ratios
The following table presents key financial ratios for Franklin Resources, Inc. (BEN) over the fiscal years 2021 to 2025, illustrating its profitability, liquidity, leverage, and valuation metrics:
| Ratios | 2021 | 2022 | 2023 | 2024 | 2025 |
|---|---|---|---|---|---|
| Net Margin | 22% | 16% | 11% | 5.5% | 6% |
| ROE | 16% | 11% | 7.4% | 3.7% | 4.3% |
| ROIC | 7.2% | 5.2% | 2.9% | 1.0% | 1.4% |
| P/E | 8.0 | 8.1 | 13.6 | 22.1 | 22.7 |
| P/B | 1.30 | 0.92 | 1.01 | 0.82 | 0.99 |
| Current Ratio | 3.51 | 3.70 | 4.13 | 3.24 | 2.71 |
| Quick Ratio | 3.51 | 3.70 | 4.13 | 3.24 | 2.71 |
| D/E | 0.68 | 0.82 | 0.99 | 1.05 | 1.10 |
| Debt-to-Assets | 31% | 33% | 39% | 40% | 41% |
| Interest Coverage | 22.0 | 18.1 | 8.9 | 4.2 | 6.4 |
| Asset Turnover | 0.35 | 0.29 | 0.26 | 0.26 | 0.27 |
| Fixed Asset Turnover | 6.92 | 6.85 | 6.51 | 4.79 | 5.12 |
| Dividend Yield | 3.8% | 5.5% | 5.0% | 6.4% | 5.7% |
Evolution of Financial Ratios
Over the recent fiscal years, Franklin Resources, Inc. exhibited a declining trend in Return on Equity (ROE), which dropped to 4.35% in 2025, indicating reduced profitability. The Current Ratio showed a decrease from 4.13 in 2023 to 2.71 in 2025, reflecting a moderate reduction in liquidity but remaining above 1. The Debt-to-Equity Ratio increased to 1.1 in 2025, suggesting higher leverage compared to prior years.
Are the Financial Ratios Favorable?
In 2025, profitability ratios such as net margin (5.98%) and ROE (4.35%) were neutral to unfavorable, while liquidity ratios like Current and Quick Ratios (both 2.71) were favorable. Leverage ratios presented a mixed view: Debt-to-Equity at 1.1 was unfavorable, but interest coverage was strong at 9.29, indicating debt service capability. Asset turnover was low at 0.27, unfavorable, yet fixed asset turnover was favorable at 5.12. Overall, 42.86% of ratios were favorable, 28.57% unfavorable, and the remainder neutral, pointing to a slightly favorable financial position.
Shareholder Return Policy
Franklin Resources, Inc. consistently pays dividends, with a payout ratio above 100% in recent years and a dividend per share that has steadily increased from $1.14 in 2021 to $1.33 in 2025. The annual dividend yield remains attractive, around 5.7%, but the payout ratio exceeding net income suggests reliance on other cash sources.
The company also engages in share buybacks, supported by a strong free cash flow coverage ratio near 85%. While this approach enhances shareholder returns, the high payout ratio may pose sustainability risks if earnings decline. Overall, the policy balances income distribution with capital management, aiming to support long-term shareholder value.
Score analysis
The following radar chart presents a comprehensive overview of Franklin Resources, Inc.’s key financial scores across multiple valuation and performance metrics:
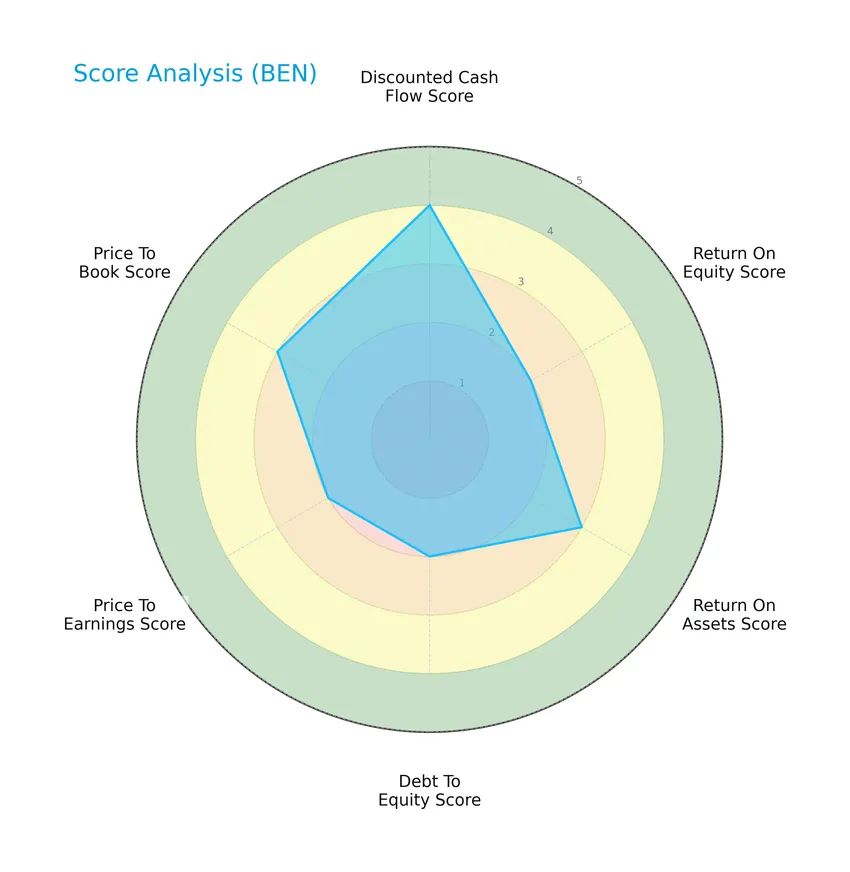
The discounted cash flow score is favorable at 4, while return on equity and debt-to-equity scores are moderate at 2, indicating average profitability and leverage control. Return on assets, price-to-earnings, and price-to-book ratios also show moderate scores, reflecting balanced operational efficiency and valuation metrics.
Analysis of the company’s bankruptcy risk
The Altman Z-Score places Franklin Resources, Inc. in the distress zone, signaling elevated bankruptcy risk based on its financial ratios and overall stability:

Is the company in good financial health?
The Piotroski F-Score diagram illustrates the company’s financial strength based on nine fundamental criteria:

With a Piotroski Score of 7, Franklin Resources, Inc. is considered to have strong financial health, suggesting solid profitability, liquidity, and operational efficiency despite some risks highlighted by other metrics.
Competitive Landscape & Sector Positioning
This section will analyze the asset management sector where Franklin Resources, Inc. operates, focusing on its strategic positioning and revenue segments. I will examine the company’s key products, main competitors, and assess its competitive advantages. The objective is to determine whether Franklin Resources holds a sustainable competitive edge in its industry environment.
Strategic Positioning
Franklin Resources, Inc. maintains a concentrated product portfolio focused primarily on investment advisory, management, and administrative services, generating $6.98B in 2025. Geographically, it emphasizes the United States market with $6.61B revenue, complemented by significant operations in Luxembourg and Asia Pacific.
Revenue by Segment
The pie chart illustrates Franklin Resources, Inc.’s revenue distribution by segment for the fiscal year 2025, highlighting the main income streams and their relative sizes.
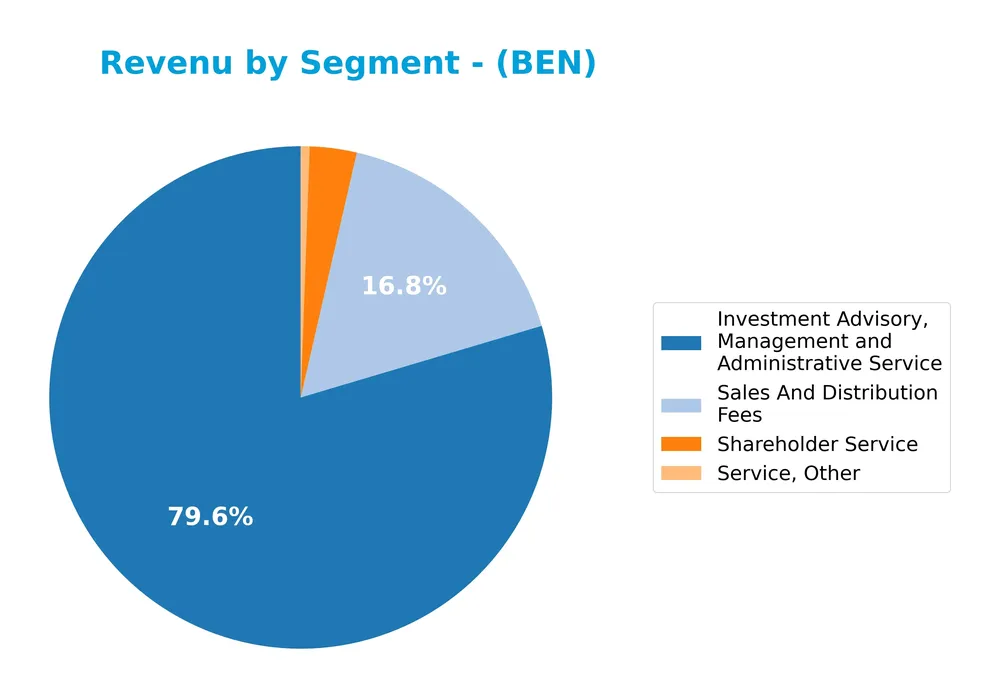
Investment Advisory, Management and Administrative Service is the dominant revenue driver with 6.98B in 2025, showing steady growth from 6.45B in 2023. Sales And Distribution Fees also contribute significantly at 1.47B, increasing moderately over recent years. Other segments like Shareholder Service and Service, Other remain relatively small but stable. The 2025 data suggests a concentration in advisory services with gradual expansion, reflecting consistent demand in core activities.
Key Products & Brands
The following table outlines Franklin Resources, Inc.’s key products and services with their descriptions:
| Product | Description |
|---|---|
| Investment Advisory, Management and Administrative Service | Core asset management services including advisory and administrative functions across equity, fixed income, balanced, and multi-asset mutual funds. |
| Sales And Distribution Fees | Fees generated from the sale and distribution of mutual funds and related investment products. |
| Shareholder Service | Services provided to mutual fund shareholders, including account maintenance and support. |
| Service, Other | Miscellaneous services related to asset management not classified under other categories. |
Franklin Resources, Inc. primarily generates revenue through investment advisory and management services, complemented by sales fees and shareholder services, reflecting its focus on comprehensive asset management solutions.
Main Competitors
There are 11 competitors in the Asset Management industry; the table below lists the top 10 leaders by market capitalization:
| Competitor | Market Cap. |
|---|---|
| Blackstone Inc. | 191B |
| BlackRock, Inc. | 168B |
| KKR & Co. Inc. | 115B |
| The Bank of New York Mellon Corporation | 82B |
| Ares Management Corporation | 55B |
| Ameriprise Financial, Inc. | 46B |
| State Street Corporation | 36B |
| Northern Trust Corporation | 26B |
| T. Rowe Price Group, Inc. | 23B |
| Franklin Resources, Inc. | 12.4B |
Franklin Resources, Inc. ranks 10th among its 11 competitors, with a market cap approximately 6.9% that of the leader, Blackstone Inc. The company falls below both the average market cap of the top 10 competitors (75.4B) and the sector median (45.9B). Notably, it maintains a +75.22% market cap gap above its nearest competitor, indicating a significant distance in scale within the competitive landscape.
Comparisons with competitors
Check out how we compare the company to its competitors:
Does BEN have a competitive advantage?
Franklin Resources, Inc. does not currently present a competitive advantage, as its return on invested capital (ROIC) is significantly below its weighted average cost of capital (WACC), indicating value destruction and declining profitability. The company’s ROIC trend over 2021-2025 is sharply negative, reinforcing concerns about its ability to generate excess returns.
Looking ahead, Franklin Resources maintains a diversified global presence with revenues primarily from the United States and Luxembourg, and offers a range of asset management products including equity, fixed income, and multi-asset mutual funds. Opportunities for growth may arise from expanding services to institutions and pension plans across varied geographic markets.
SWOT Analysis
This SWOT analysis highlights the key internal and external factors affecting Franklin Resources, Inc., guiding strategic investment decisions.
Strengths
- Strong market presence with $13.2B market cap
- Diversified global revenue streams
- Favorable gross margin at 80.34%
Weaknesses
- Declining ROIC and value destruction
- Low ROE at 4.35% indicating weak profitability
- Altman Z-score in distress zone signals financial risk
Opportunities
- Expansion in growing Asia Pacific and Luxembourg markets
- Increasing net margin and EPS growth in short term
- Potential to improve operational efficiency and reduce debt
Threats
- Intense competition in asset management sector
- Economic volatility impacting asset values
- Regulatory changes and geopolitical risks in key markets
Overall, Franklin Resources exhibits stable revenue and strong margins but suffers from declining profitability and financial distress risks. The company’s strategy should focus on restoring value through operational improvements and cautious expansion, while managing debt and market risks carefully.
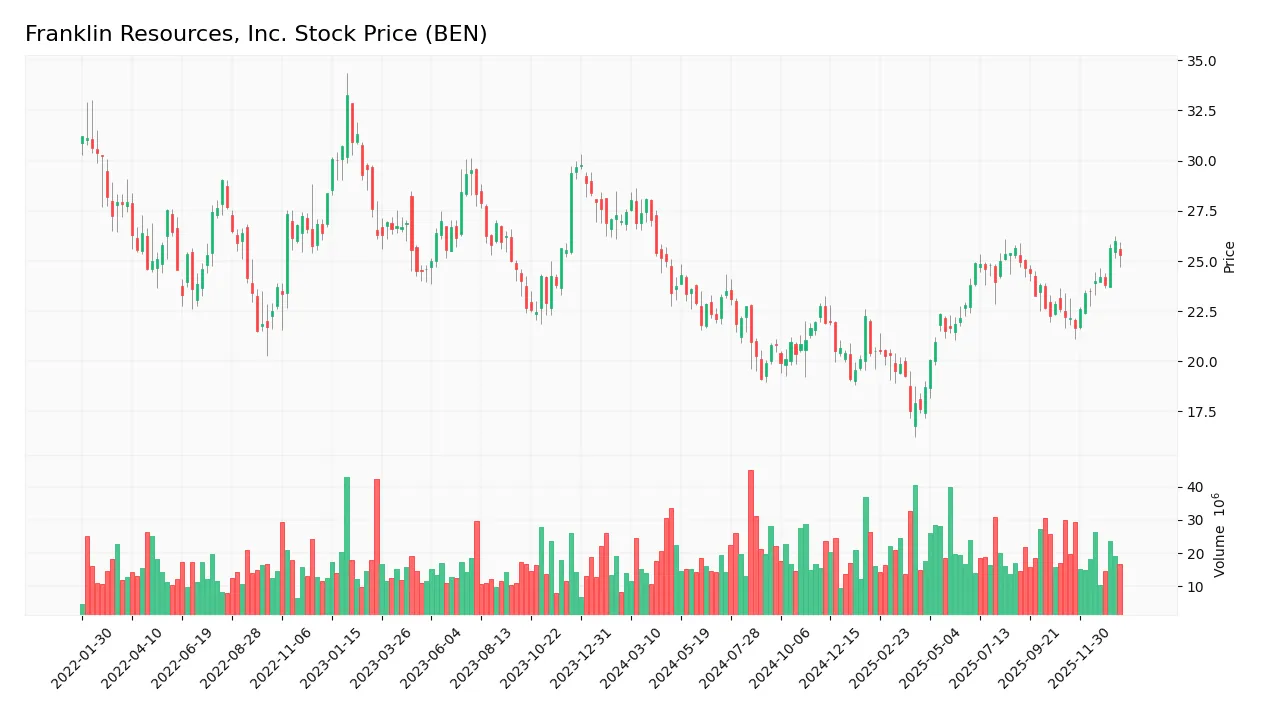
Stock Price Action Analysis
The weekly stock price chart for Franklin Resources, Inc. (BEN) over the past 12 months illustrates the price fluctuations and recent momentum:
Trend Analysis
Over the past 12 months, BEN’s stock price declined by 7.7%, indicating a bearish trend with accelerating downward momentum. Price volatility is moderate, with a standard deviation of 2.31. The stock ranged between a high of 28.11 and a low of 17.51, reflecting significant price variation during the period.
Volume Analysis
In the last three months, trading volume has been increasing, with a slight buyer dominance at 53.71%. Buyer volume exceeds seller volume, suggesting cautious optimism and moderate market participation favoring acquisitions over disposals. This volume pattern indicates a slightly bullish investor sentiment despite the prior overall bearish price trend.
Target Prices
The consensus target price for Franklin Resources, Inc. (BEN) is firmly set at $25.
| Target High | Target Low | Consensus |
|---|---|---|
| 25 | 25 | 25 |
This uniform target suggests analysts expect limited price variation, reflecting a steady outlook for BEN’s stock performance.

Don’t Let Luck Decide Your Entry Point
Optimize your entry points with our advanced ProRealTime indicators. You’ll get efficient buy signals with precise price targets for maximum performance. Start outperforming now!
Analyst & Consumer Opinions
This section reviews recent grades and consumer feedback related to Franklin Resources, Inc. (BEN) to provide insight.
Stock Grades
Here is the latest overview of Franklin Resources, Inc. stock grades from recognized financial institutions:
| Grading Company | Action | New Grade | Date |
|---|---|---|---|
| Barclays | Maintain | Underweight | 2026-01-15 |
| TD Cowen | Maintain | Buy | 2026-01-14 |
| Barclays | Maintain | Underweight | 2025-12-12 |
| JP Morgan | Maintain | Neutral | 2025-11-10 |
| Barclays | Maintain | Underweight | 2025-10-21 |
| Evercore ISI Group | Maintain | Underperform | 2025-10-09 |
| B of A Securities | Maintain | Underperform | 2025-10-02 |
| Morgan Stanley | Maintain | Underweight | 2025-08-12 |
| Evercore ISI Group | Maintain | Underperform | 2025-08-04 |
| Barclays | Maintain | Underweight | 2025-08-04 |
The consensus among these reputable firms leans toward a cautious stance, predominantly maintaining underweight or underperform ratings, while a minority uphold buy or neutral positions. This reflects a broadly conservative outlook with no upgrades in recent months.
Consumer Opinions
Consumers of Franklin Resources, Inc. express a mix of appreciation and concerns that reflect their varied experiences with the company’s services.
| Positive Reviews | Negative Reviews |
|---|---|
| Strong portfolio management with consistent returns | High fees compared to competitors |
| Responsive customer service team | Limited digital tools for self-directed investors |
| Transparent communication regarding market changes | Slow onboarding process for new clients |
| Diverse investment options catering to different needs | Some clients report occasional delays in transactions |
Overall, Franklin Resources is praised for its solid management and customer service, but investors often highlight the need for improved digital platforms and more competitive fee structures.
Risk Analysis
Below is a summary table outlining the primary risks associated with Franklin Resources, Inc., highlighting their category, description, probability, and impact:
| Category | Description | Probability | Impact |
|---|---|---|---|
| Financial Health | Altman Z-Score in distress zone (1.43), indicating moderate bankruptcy risk | Medium | High |
| Profitability | Low ROE (4.35%) and ROIC (1.38%) signal weak returns on equity and capital | High | Medium |
| Leverage | Unfavorable debt/equity ratio (1.1) increases financial risk | Medium | Medium |
| Market Volatility | Beta of 1.466 suggests above-average stock price volatility | High | Medium |
| Dividend Risk | Dividend yield neutral (5.75%) but vulnerable to earnings volatility | Medium | Medium |
| Operational | Low asset turnover (0.27) reflects inefficiency in asset utilization | Medium | Medium |
The most critical concerns are Franklin Resources’ Altman Z-Score, which places it in the distress zone, signaling an increased risk of financial distress, and its low profitability ratios. While the Piotroski Score of 7 shows relative strength, investors should cautiously monitor leverage and operational efficiency, especially amid market volatility.
Should You Buy Franklin Resources, Inc.?
Franklin Resources, Inc. appears to have a moderate profitability profile with declining returns on invested capital, suggesting value erosion and a very unfavorable competitive moat. Despite a substantial leverage profile and distress-level Altman Z-Score, its overall rating could be seen as moderately favorable, reflecting cautious operational efficiency and risk considerations.
Strength & Efficiency Pillars
Franklin Resources, Inc. exhibits solid financial health supported by a strong Piotroski score of 7, indicating robust operational and financial strength. The company maintains favorable liquidity with a current ratio and quick ratio both at 2.71, ensuring short-term obligations are well covered. Despite moderate profitability metrics, including a net margin of 5.98% and an ROE of 4.35%, the weighted average cost of capital (WACC) stands at a favorable 6.64%. However, the ROIC of 1.38% falls below the WACC, signaling that Franklin Resources is currently not a value creator. The Altman Z-score of 1.43 places the company in the distress zone, warranting caution on its financial stability.
Weaknesses and Drawbacks
Key concerns for Franklin Resources center on its profitability and leverage profile. The return on invested capital (ROIC) at 1.38% is significantly below the WACC of 6.64%, implying value destruction rather than creation. The company’s debt-to-equity ratio is a relatively high 1.1, reflecting a leveraged balance sheet which could amplify risk in adverse market conditions. Additionally, the stock is experiencing bearish trends with a 7.7% decline overall and accelerating negative momentum, despite a recent slight buyer dominance of 53.7%. These factors, combined with an Altman Z-score in the distress zone, highlight financial and market pressures that may pose short-term headwinds.
Our Verdict about Franklin Resources, Inc.
Franklin Resources presents an unfavorable long-term fundamental profile due to its value-destructing ROIC and financial distress signals. While recent market activity shows a slightly buyer-dominant behavior and some positive price momentum, the broader trend remains bearish. Despite these short-term improvements, the overall profile may suggest a cautious approach, where investors might consider waiting for a clearer recovery and improved fundamental metrics before increasing exposure.
Disclaimer: This content is for informational purposes only and does not constitute financial, investment, or other professional advice. Investing in financial markets involves a significant risk of loss, and past performance is not indicative of future results.
Additional Resources
- Analysts Estimate Franklin Resources (BEN) to Report a Decline in Earnings: What to Look Out for – Finviz (Jan 23, 2026)
- Franklin Resources (BEN) Target Raised as Barclays Updates Asset Manager Models – Yahoo Finance (Jan 22, 2026)
- Vest Financial LLC Sells 686,345 Shares of Franklin Resources, Inc. $BEN – MarketBeat (Jan 21, 2026)
- Franklin Templeton launches new ETF focused on emerging market debt (BEN:NYSE) – Seeking Alpha (Jan 22, 2026)
- New ETF targets income from emerging market debt while managing currency risk – Stock Titan (Jan 22, 2026)
For more information about Franklin Resources, Inc., please visit the official website: franklinresources.com