Home > Analyses > Communication Services > Fox Corporation
Fox Corporation shapes how millions of Americans consume news, sports, and entertainment daily through its influential cable networks and broadcast platforms. As a dominant player in U.S. media, FOX News, FOX Sports, and the FOX Network define its leadership, while innovative ventures like Tubi and Blockchain Creative Labs push digital boundaries. With a solid reputation for quality content and market influence, the key question remains: can Fox sustain its growth and justify its current valuation in an evolving media landscape?
Table of contents
Business Model & Company Overview
Fox Corporation, founded in 2018 and headquartered in New York City, stands as a leading force in the U.S. entertainment sector. Its core business revolves around an integrated ecosystem of news, sports, and entertainment programming distributed through cable networks, broadcast television, and digital platforms. With flagship assets like FOX News, FOX Sports, and the FOX Network, the company seamlessly blends traditional and innovative media outlets to engage diverse audiences nationwide.
The company’s revenue engine balances substantial cable network programming with broadcast television and fast-growing digital services such as Tubi, an ad-supported video-on-demand platform. Fox Corporation’s strategic footprint spans the Americas, leveraging its 29 broadcast stations and digital ventures to monetize content across multiple channels. This multi-platform approach, combined with proprietary production facilities in Los Angeles, solidifies its competitive advantage and positions Fox as a key architect shaping the future of media consumption.
Financial Performance & Fundamental Metrics
This section examines Fox Corporation’s income statement, key financial ratios, and dividend payout policy to provide a clear view of its fundamental health.
Income Statement
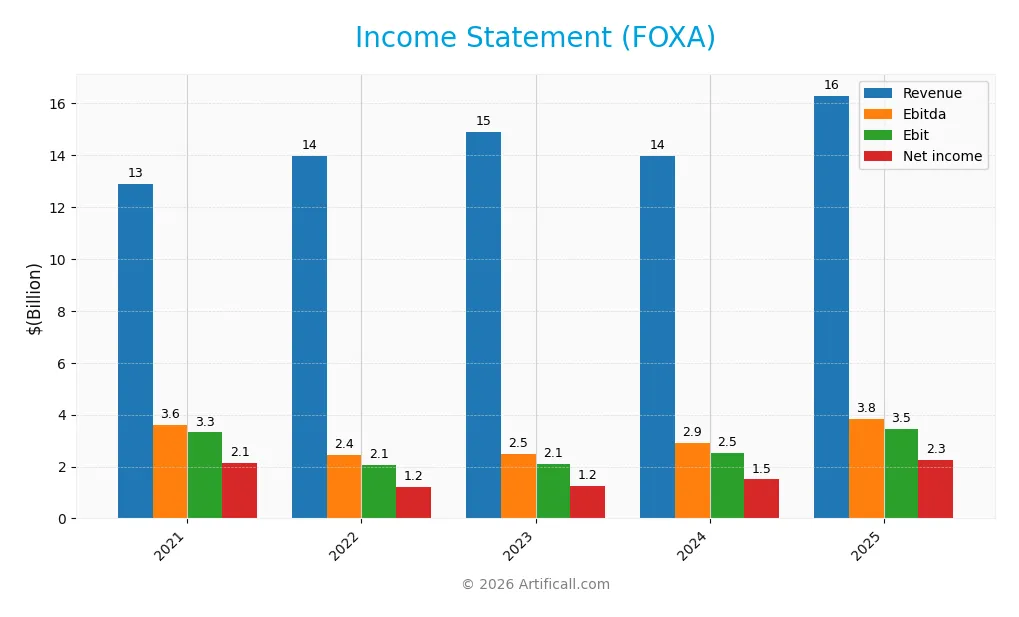
Below is the Income Statement of Fox Corporation (FOXA) for fiscal years 2021 through 2025, reported in USD.
| 2021 | 2022 | 2023 | 2024 | 2025 | |
|---|---|---|---|---|---|
| Revenue | 12.9B | 13.97B | 14.91B | 13.98B | 16.3B |
| Cost of Revenue | 0 | 0 | 0 | 0 | 10.9B |
| Operating Expenses | 10.14B | 11.4B | 12.15B | 11.5B | 2.17B |
| Gross Profit | 12.91B | 13.97B | 14.91B | 13.98B | 5.40B |
| EBITDA | 3.61B | 2.43B | 2.50B | 2.90B | 3.85B |
| EBIT | 3.31B | 2.07B | 2.09B | 2.51B | 3.46B |
| Interest Expense | 0.40B | 0.38B | 0.35B | 0.41B | 0.40B |
| Net Income | 2.15B | 1.21B | 1.24B | 1.50B | 2.26B |
| EPS | 3.64 | 2.13 | 2.34 | 3.14 | 4.97 |
| Filing Date | 2021-08-10 | 2022-08-12 | 2023-08-11 | 2024-08-08 | 2025-08-06 |
Income Statement Evolution
From 2021 to 2025, Fox Corporation’s revenue increased by 26.3%, with a notable 16.6% growth in the latest year. Net income rose more modestly by 5.3% over the entire period but jumped 29.3% in the last year. Despite this, the net margin declined by 16.6% overall, though it improved favorably in the most recent year. Gross margin remained stable and favorable at 33.1%.
Is the Income Statement Favorable?
In 2025, the fundamentals appear generally favorable with revenue reaching $16.3B and net income at $2.26B. Key profitability metrics, including an EBIT margin of 21.3% and a net margin of 13.9%, are positive. The company’s interest expense ratio is low at 2.5%, supporting operating stability. Overall, 85.7% of income statement indicators are favorable, reflecting strong operational efficiency and growth momentum.
Financial Ratios
The following table summarizes key financial ratios for Fox Corporation over the last five fiscal years, providing insight into profitability, leverage, liquidity, valuation, and operational efficiency:
| Ratios | 2021 | 2022 | 2023 | 2024 | 2025 |
|---|---|---|---|---|---|
| Net Margin | 16.7% | 8.6% | 8.3% | 10.7% | 13.9% |
| ROE | 19.3% | 10.6% | 11.9% | 14.0% | 18.9% |
| ROIC | 10.0% | 9.4% | 10.3% | 9.3% | 11.9% |
| P/E | 10.2 | 15.1 | 14.5 | 10.9 | 11.4 |
| P/B | 2.0 | 1.6 | 1.7 | 1.5 | 2.2 |
| Current Ratio | 2.9 | 3.6 | 1.9 | 2.5 | 2.9 |
| Quick Ratio | 2.7 | 3.3 | 1.8 | 2.3 | 2.8 |
| D/E | 0.76 | 0.68 | 0.79 | 0.76 | 0.62 |
| Debt-to-Assets | 37% | 35% | 38% | 37% | 32% |
| Interest Coverage | 7.0 | 6.8 | 7.9 | 6.1 | 8.0 |
| Asset Turnover | 0.56 | 0.63 | 0.68 | 0.64 | 0.70 |
| Fixed Asset Turnover | 5.9 | 6.5 | 5.6 | 5.4 | 6.5 |
| Dividend Yield | 1.5% | 1.7% | 1.7% | 1.7% | 1.1% |
Evolution of Financial Ratios
From 2021 to 2025, Fox Corporation’s Return on Equity (ROE) showed a general upward trend, increasing from 19.33% in 2021 to 18.92% in 2025 with some fluctuations. The Current Ratio improved notably from 2.91 in 2021 to 2.91 in 2025, indicating stable liquidity. The Debt-to-Equity Ratio decreased from 0.76 in 2021 to 0.62 in 2025, reflecting a moderate reduction in leverage. Profitability margins improved steadily, with net profit margin rising from 16.66% in 2021 to 13.88% in 2025.
Are the Financial Ratios Favorable?
In 2025, Fox Corporation’s financial ratios present a largely favorable picture. Profitability metrics, including net margin at 13.88% and ROE at 18.92%, are rated favorable, supported by an interest coverage ratio of 8.6 indicating strong debt servicing capacity. Liquidity ratios such as the current ratio (2.91) and quick ratio (2.76) are also favorable, suggesting good short-term financial health. Leverage ratios, including debt-to-equity at 0.62 and debt-to-assets at 32.18%, are neutral, reflecting balanced financial risk. Market valuation ratios like P/E at 11.42 are favorable, while price-to-book at 2.16 and dividend yield at 1.07% are neutral, resulting in an overall favorable assessment.
Shareholder Return Policy
Fox Corporation maintains a consistent dividend payout, with a payout ratio of 12.2% in 2025 and a dividend per share rising slightly to $0.60. The annual dividend yield stands at about 1.07%, supported by free cash flow coverage near 90%, indicating a balanced distribution. The company also conducts share buybacks, complementing its shareholder return strategy.
This approach reflects prudent capital management, as dividends and buybacks are covered by operating cash flow and free cash flow, reducing risk of unsustainable payouts. The steady yield and moderate payout ratio suggest the policy supports sustainable long-term value creation for shareholders without overextending financial resources.
Score analysis
The radar chart below illustrates Fox Corporation’s key financial scores across multiple valuation and performance metrics:
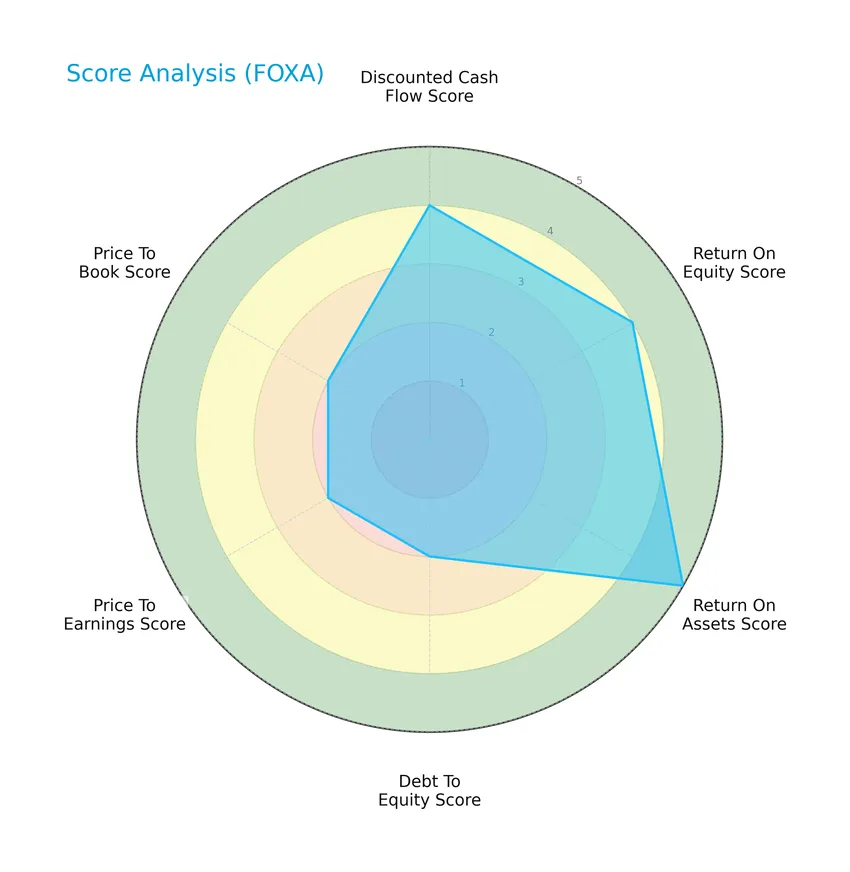
Fox Corporation shows favorable discounted cash flow and return on equity scores (4 each), with a very favorable return on assets score of 5. However, the debt-to-equity, price-to-earnings, and price-to-book scores are moderate at 2, reflecting some caution in leverage and valuation metrics.
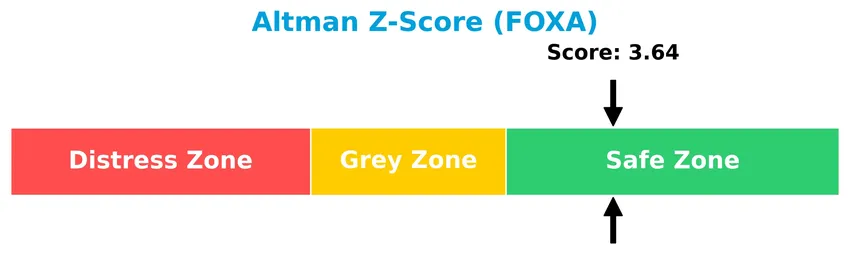
Analysis of the company’s bankruptcy risk
Fox Corporation’s Altman Z-Score of 3.64 places it securely in the safe zone, indicating a low probability of bankruptcy and strong financial stability:
Is the company in good financial health?
The Piotroski F-Score diagram below highlights Fox Corporation’s financial strength based on nine key criteria:

With a Piotroski Score of 8, Fox Corporation demonstrates very strong financial health, suggesting robust profitability, liquidity, and operational efficiency consistent with solid fundamentals.
Competitive Landscape & Sector Positioning
This sector analysis will explore Fox Corporation’s strategic positioning, revenue by segment, key products, main competitors, and competitive advantages. I will examine whether Fox Corporation holds a competitive advantage over its rivals in the communication services industry.
Strategic Positioning
Fox Corporation maintains a concentrated product portfolio focused on Cable Network Programming and Television segments, generating $6.93B and $9.33B in revenue respectively in 2025. Its geographic exposure is heavily centered in the U.S., with over $21B revenue reported in 2018, reflecting a domestic strategic focus.
Revenue by Segment
This pie chart illustrates Fox Corporation’s revenue distribution by segment for the fiscal year 2025, highlighting the contributions of each business area.
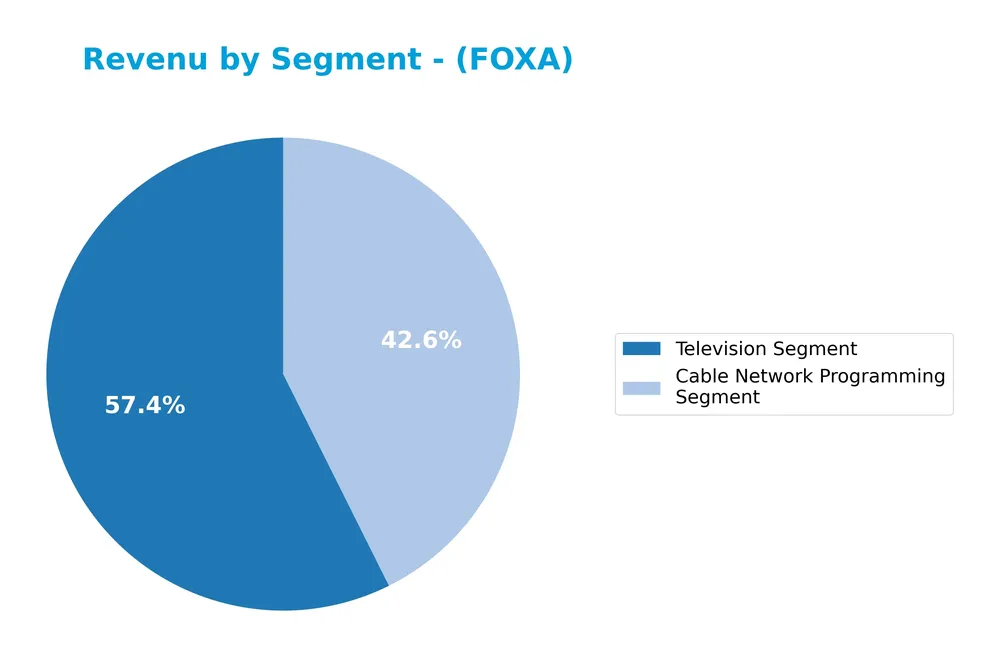
In 2025, Fox Corporation’s revenue was primarily driven by the Television Segment at $9.3B, followed by the Cable Network Programming Segment with $6.9B. Over recent years, both segments have shown steady growth, with Television revenue accelerating notably since 2023. The absence of Filmed Entertainment revenue post-2018 indicates a strategic focus on core broadcasting segments, reducing segment diversification but strengthening concentration in television and cable networks.
Key Products & Brands
The table below presents Fox Corporation’s main products and brands with their respective descriptions:
| Product | Description |
|---|---|
| FOX News | National cable news channel providing news content across the United States. |
| FOX Business | Business news national cable channel focusing on financial and economic reporting. |
| FS1 and FS2 | Multi-sport national networks offering diverse sports programming. |
| FOX Sports Racing | Video programming service featuring motor sports content. |
| FOX Soccer Plus | Video programming network dedicated to live soccer and rugby competitions. |
| FOX Deportes | Spanish-language sports programming service. |
| Big Ten Network | National video programming service focusing on collegiate sports content. |
| The FOX Network | National television broadcast network airing sports programming and entertainment content. |
| Tubi | Advertising-supported video-on-demand (AVOD) streaming service. |
| Fox Alternative Entertainment | Production studio developing and producing unscripted and alternative programming. |
| MyNetworkTV | Programming distribution service offering a variety of television content. |
| Blockchain Creative Labs | Studio focusing on creation, distribution, and monetization of Web3 content. |
| FOX Studios Lot | Production and post-production facility in Los Angeles with sound stages, broadcast studios, theaters, and editing rooms. |
| Broadcast Television Stations | Operates 29 broadcast TV stations across various U.S. markets. |
Fox Corporation’s portfolio spans cable news, sports networks, broadcast television, streaming services, and production facilities, reflecting its diversified presence in U.S. entertainment and media sectors.
Main Competitors
There are 8 competitors in total, with the table below listing the top 8 leaders by market capitalization:
| Competitor | Market Cap. |
|---|---|
| Netflix, Inc. | 385B |
| Warner Bros. Discovery, Inc. | 71B |
| Live Nation Entertainment, Inc. | 34B |
| Fox Corporation | 33B |
| TKO Group Holdings, Inc. | 17B |
| News Corporation | 17B |
| News Corporation | 15B |
| Paramount Skydance Corporation Class B Common Stock | 14B |
Fox Corporation ranks 4th among its competitors with a market cap representing 8.54% of the leading company’s size. It is positioned below the average market cap of the top 10 competitors (73B) but above the median sector market cap (25B). Fox Corporation maintains a 2.54% gap from the next larger competitor, indicating a modest lead in its immediate competitive set.
Comparisons with competitors
Check out how we compare the company to its competitors:
Does FOXA have a competitive advantage?
Fox Corporation (FOXA) demonstrates a clear competitive advantage, supported by a very favorable moat rating and a ROIC exceeding its WACC by over 6%, indicating value creation and efficient capital use. Its growing ROIC trend of 18.4% further confirms increasing profitability and a durable competitive edge in the entertainment sector.
Looking ahead, FOXA’s diverse portfolio including national cable news, sports networks, and digital platforms like Tubi positions it well to capitalize on expanding digital content distribution and Web3 opportunities. Continued innovation in content production and expansion into alternative programming and new markets may sustain its competitive position.
SWOT Analysis
This SWOT analysis highlights the key internal and external factors impacting Fox Corporation’s strategic position and investment potential.
Strengths
- Strong market presence in U.S. news and sports media
- Favorable profitability metrics with 13.88% net margin
- Durable competitive advantage with growing ROIC
Weaknesses
- Declining gross profit growth in short term
- Moderate debt levels affecting flexibility
- Exposure to traditional TV segments facing disruption
Opportunities
- Expansion of digital platforms like Tubi and Web3 content
- Growing demand for diversified sports programming
- Increasing advertising revenue potential in streaming
Threats
- Intense competition from other media conglomerates
- Rapid technological changes and evolving consumer habits
- Regulatory risks impacting content and distribution
Fox Corporation’s strengths in profitability and market niche are balanced by some operational challenges and industry disruption risks. The company should leverage digital innovation and sports content growth while managing debt and adapting to changing media consumption trends.
Stock Price Action Analysis
The weekly stock chart for Fox Corporation (FOXA) over the past 12 months illustrates its price movements and key levels of support and resistance:
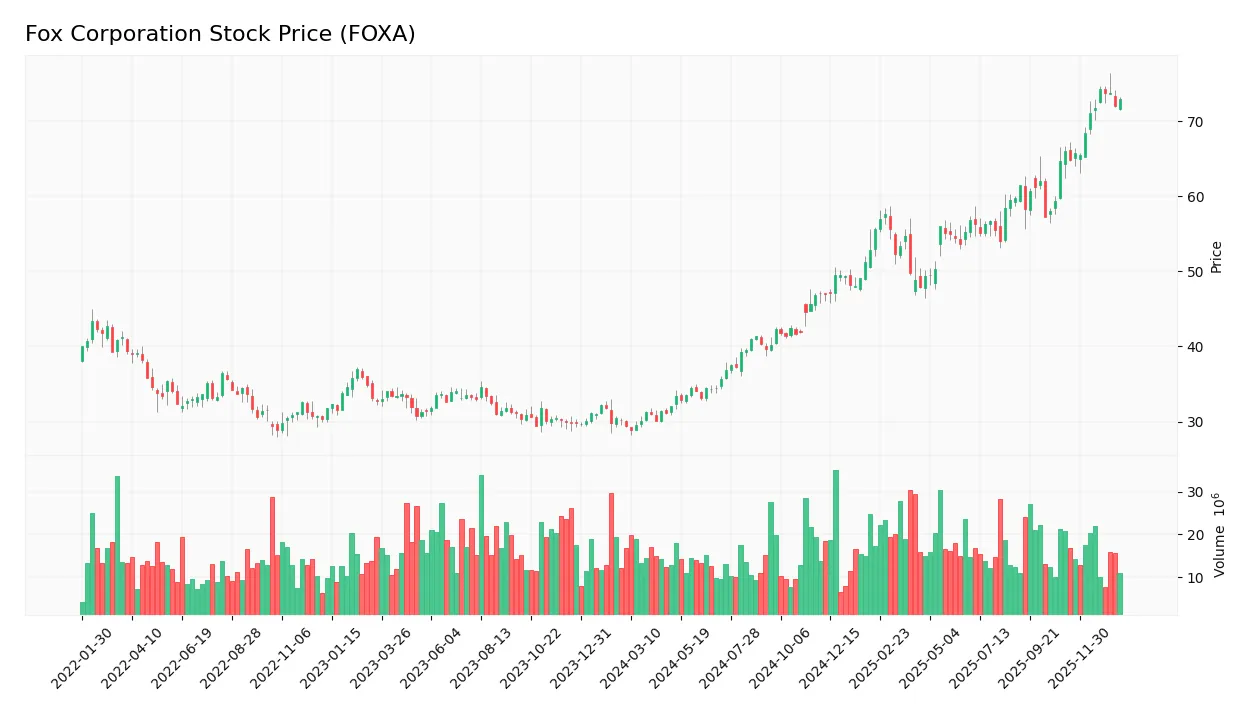
Trend Analysis
Over the past 12 months, FOXA’s stock price increased by 147.72%, indicating a strong bullish trend. The price showed acceleration during this period, moving from a low of 28.86 to a high of 74.3. The standard deviation of 12.15 reflects moderate volatility accompanying this upward momentum.
Volume Analysis
In the last three months, trading volume for FOXA has been increasing, with buyer volume at 116M and seller volume at 69M, representing 62.7% buyer dominance. This buyer-driven volume surge suggests growing investor interest and positive market participation in the stock.
Target Prices
Analysts present a clear target price consensus for Fox Corporation (FOXA).
| Target High | Target Low | Consensus |
|---|---|---|
| 97 | 64 | 76.63 |
The target prices indicate moderate upside potential from current levels, with analysts expecting a price range between 64 and 97, centering near 76.63. This suggests a cautiously optimistic market outlook.

Don’t Let Luck Decide Your Entry Point
Optimize your entry points with our advanced ProRealTime indicators. You’ll get efficient buy signals with precise price targets for maximum performance. Start outperforming now!
Analyst & Consumer Opinions
This section examines the latest analyst ratings and consumer feedback regarding Fox Corporation (FOXA) performance and reputation.
Stock Grades
Below is a summary of recent grade updates from recognized financial institutions regarding Fox Corporation’s stock performance:
| Grading Company | Action | New Grade | Date |
|---|---|---|---|
| Guggenheim | Maintain | Buy | 2025-12-22 |
| B of A Securities | Maintain | Buy | 2025-12-19 |
| Goldman Sachs | Maintain | Buy | 2025-12-19 |
| Morgan Stanley | Maintain | Equal Weight | 2025-12-18 |
| Citigroup | Maintain | Buy | 2025-11-12 |
| JP Morgan | Maintain | Neutral | 2025-10-31 |
| UBS | Maintain | Buy | 2025-10-31 |
| TD Cowen | Maintain | Hold | 2025-10-31 |
| Barclays | Maintain | Equal Weight | 2025-10-31 |
| Evercore ISI Group | Maintain | In Line | 2025-10-31 |
Overall, the majority of grades maintain a Buy stance with several firms assigning Hold or Equal Weight, indicating a generally positive but cautious market perspective on Fox Corporation stock.
Consumer Opinions
Consumers express a mix of admiration and criticism toward Fox Corporation, reflecting diverse experiences with its media offerings and corporate practices.
| Positive Reviews | Negative Reviews |
|---|---|
| “Fox delivers engaging news content with strong journalistic integrity.” | “Some programs show clear political bias, which affects trust.” |
| “Their sports coverage is comprehensive and high-quality.” | “Customer service could be more responsive and helpful.” |
| “Innovative digital platforms enhance user experience significantly.” | “Advertising can be intrusive during live broadcasts.” |
Overall, consumers appreciate Fox Corporation’s compelling content and innovation but often cite concerns about perceived bias and customer service responsiveness. Balancing content neutrality and improving support could enhance consumer satisfaction.
Risk Analysis
The following table summarizes key risks associated with investing in Fox Corporation (FOXA), highlighting their probability and potential impact:
| Category | Description | Probability | Impact |
|---|---|---|---|
| Market Volatility | Moderate fluctuations in stock price due to industry competition and changing consumer preferences. | Medium | Medium |
| Regulatory Risk | Potential changes in U.S. communication and media regulations affecting content and distribution rights. | Medium | High |
| Technological Disruption | Rapid shifts in digital media consumption impacting traditional broadcast and cable networks. | High | High |
| Debt Levels | Moderate leverage with debt-to-equity at 0.62 could pressure cash flow if interest rates rise significantly. | Low | Medium |
| Content Production Costs | Increasing expenses related to producing and acquiring competitive programming and technology upgrades. | Medium | Medium |
Among these, technological disruption poses the most significant risk due to the fast-evolving media landscape and consumer shift towards streaming. Regulatory changes also carry high impact given Fox’s reliance on broadcast licenses. However, Fox’s strong financial health, including a safe Altman Z-score and very strong Piotroski score, helps mitigate bankruptcy risk. Caution remains prudent given moderate market and operational risks.
Should You Buy Fox Corporation?
Fox Corporation appears to be demonstrating robust profitability and strong value creation supported by a durable competitive moat with growing returns on invested capital. While the leverage profile is manageable, the overall rating suggests a B+ status, indicating a cautiously favorable investment profile.
Strength & Efficiency Pillars
Fox Corporation exhibits robust profitability and solid financial health, marked by a net margin of 13.88% and a return on equity (ROE) of 18.92%. The return on invested capital (ROIC) stands at 11.89%, comfortably exceeding the weighted average cost of capital (WACC) of 5.8%, confirming Fox as a clear value creator. The Altman Z-score of 3.64 places the company firmly in the safe zone, while a Piotroski score of 8 indicates very strong financial health. These metrics collectively underscore Fox’s durable competitive advantage and efficient capital deployment.
Weaknesses and Drawbacks
Despite favorable fundamentals, some valuation and leverage indicators suggest moderate caution. The price-to-earnings (P/E) ratio at 11.42 is reasonable but paired with a price-to-book (P/B) of 2.16, it indicates a neutral valuation stance, potentially limiting upside in a volatile market. The debt-to-equity ratio of 0.62 and debt-to-assets of 32.18% reflect moderate leverage, which warrants monitoring, although liquidity ratios remain strong. No evident seller dominance or recent price decline mitigates immediate market pressure risks.
Our Verdict about Fox Corporation
Fox Corporation’s long-term fundamental profile is favorable, supported by strong profitability and financial stability. Both fundamental and technical trends are bullish with buyer dominance at 62.7% in the recent period, suggesting positive momentum. The profile may appear attractive for long-term exposure, with accelerating stock price trends and increasing volume reinforcing investor confidence. However, moderate leverage and valuation levels might encourage a measured approach.
Disclaimer: This content is for informational purposes only and does not constitute financial, investment, or other professional advice. Investing in financial markets involves a significant risk of loss, and past performance is not indicative of future results.
Additional Resources
- Fox Corporation (FOXA): A Bull Case Theory – Yahoo Finance (Jan 19, 2026)
- Fox Corporation (NASDAQ:FOXA) Receives Average Recommendation of “Moderate Buy” from Brokerages – MarketBeat (Jan 22, 2026)
- Fox Corporation (FOXA) Q2 2025 Earnings Call Transcript – AlphaStreet (Jan 23, 2026)
- Fox Corporation Executives to Discuss Second Quarter Fiscal 2026 Financial Results Via Webcast – Financial Times (Jan 21, 2026)
- Fox Corporation Chief Financial Officer Steve Tomsic to Participate in Upcoming UBS Global Media and Communications Conference – PR Newswire (Dec 01, 2025)
For more information about Fox Corporation, please visit the official website: foxcorporation.com