Home > Analyses > Technology > Fortive Corporation
Fortive transforms industries by delivering precision tools and intelligent software that power critical operations worldwide. As a powerhouse in hardware, equipment, and technology solutions, Fortive drives innovation across manufacturing, healthcare, energy, and infrastructure sectors. Its portfolio includes renowned brands like Fluke and Tektronix, known for reliability and cutting-edge quality. As market dynamics shift, I examine whether Fortive’s strong fundamentals still justify its growth potential and market valuation in 2026.

Table of contents
Business Model & Company Overview
Fortive Corporation, founded in 2015 and headquartered in Everett, Washington, commands a leading position in the hardware, equipment, and parts industry. It operates a cohesive ecosystem spanning professional and engineered products, software, and services. Its portfolio includes ruggedized test tools, enterprise software, and calibration instruments, serving diverse sectors like manufacturing, healthcare, and aerospace through well-known brands such as FLUKE and TEKTRONIX.
Fortive’s revenue engine balances hardware sales with recurring software and service subscriptions, including asset lifecycle and safety management solutions. Its global footprint spans the Americas, Europe, and Asia, enabling broad market access. The company’s economic moat lies in its integrated technology offerings and deep vertical market expertise, shaping the future of industrial reliability and precision measurement.
Financial Performance & Fundamental Metrics
I analyze Fortive Corporation’s income statement, key financial ratios, and dividend payout policy to assess its operational efficiency and shareholder returns.
Income Statement
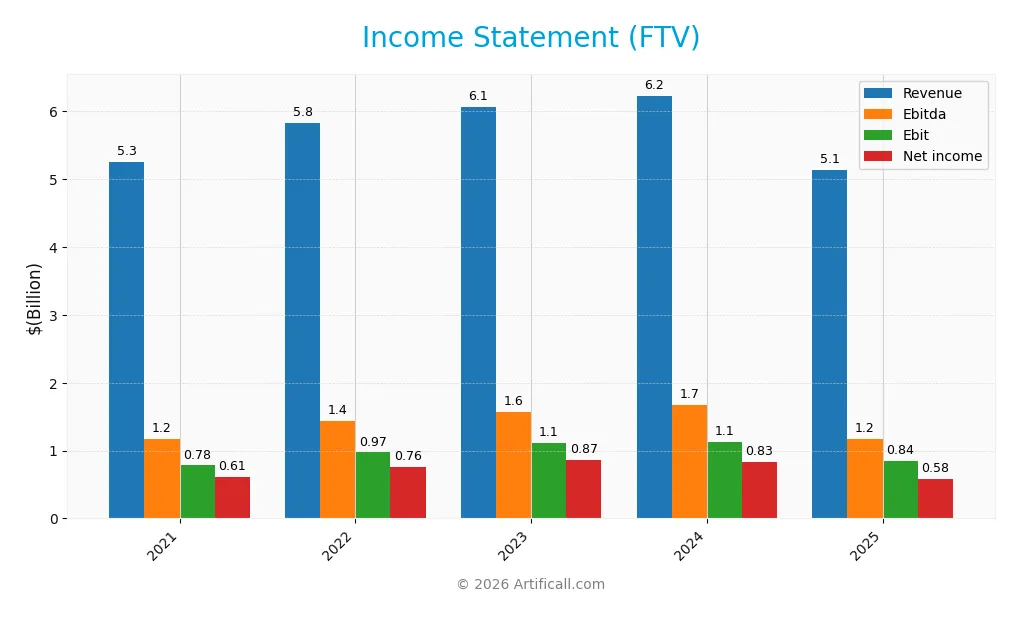
The table below summarizes Fortive Corporation’s key income statement figures from 2021 to 2025, reflecting revenue trends, profitability, and earnings per share.
| 2021 | 2022 | 2023 | 2024 | 2025 | |
|---|---|---|---|---|---|
| Revenue | 5.25B | 5.83B | 6.07B | 6.23B | 5.14B |
| Cost of Revenue | 2.24B | 2.46B | 2.47B | 2.50B | 2.01B |
| Operating Expenses | 2.18B | 2.36B | 2.46B | 2.55B | 2.23B |
| Gross Profit | 3.01B | 3.36B | 3.59B | 3.73B | 3.13B |
| EBITDA | 1.18B | 1.44B | 1.57B | 1.67B | 1.17B |
| EBIT | 781M | 972M | 1.11B | 1.12B | 843M |
| Interest Expense | 103M | 98M | 124M | 153M | 121M |
| Net Income | 608M | 755M | 866M | 833M | 579M |
| EPS | 1.64 | 2.12 | 2.46 | 2.39 | 1.75 |
| Filing Date | 2022-03-01 | 2023-02-28 | 2024-02-27 | 2025-02-25 | 2026-02-25 |
Income Statement Evolution
Fortive’s revenue declined by 17.5% in 2025 after a mixed performance from 2021 to 2024. Net income fell 15.7% year-over-year, reflecting margin compression. Gross and EBIT margins remain favorable at 61.0% and 16.4%, respectively, but both showed weakness compared to prior years. Operating expenses tracked revenue declines, maintaining relative stability in cost control.
Is the Income Statement Favorable?
In 2025, Fortive posted $5.14B revenue and $579M net income, with a net margin of 11.3%. Interest expense is low at 2.34% of revenue, supporting earnings quality. However, the income statement’s overall trend is unfavorable, reflecting declining top-line and bottom-line results. Despite solid margins, deteriorating revenue and net income growth raise caution about near-term profitability sustainability.
Financial Ratios
The following table presents key financial ratios for Fortive Corporation (FTV) over the past five fiscal years, reflecting profitability, liquidity, leverage, and market valuation metrics:
| Ratios | 2021 | 2022 | 2023 | 2024 | 2025 |
|---|---|---|---|---|---|
| Net Margin | 11.6% | 13.0% | 14.3% | 13.4% | 11.3% |
| ROE | 6.40% | 7.80% | 8.39% | 8.17% | 8.98% |
| ROIC | 5.04% | 6.12% | 6.54% | 6.65% | 7.44% |
| P/E | 33.0 | 22.9 | 22.6 | 23.7 | 30.2 |
| P/B | 2.11 | 1.78 | 1.90 | 1.94 | 2.71 |
| Current Ratio | 0.68 | 0.91 | 2.05 | 1.16 | 0.71 |
| Quick Ratio | 0.54 | 0.71 | 1.75 | 0.91 | 0.58 |
| D/E | 0.44 | 0.35 | 0.37 | 0.38 | 0.50 |
| Debt-to-Assets | 25.2% | 21.5% | 22.5% | 22.8% | 27.3% |
| Interest Coverage | 8.06 | 10.23 | 9.18 | 7.70 | 7.54 |
| Asset Turnover | 0.32 | 0.37 | 0.36 | 0.37 | 0.44 |
| Fixed Asset Turnover | 13.3 | 13.8 | 13.8 | 14.4 | 19.1 |
| Dividend Yield | 0.66% | 0.58% | 0.52% | 0.56% | 0.53% |
Evolution of Financial Ratios
Fortive’s Return on Equity (ROE) demonstrated modest improvement, peaking near 8.98% in 2025 but remains below industry leaders. The Current Ratio trended downward, falling from 2.05 in 2023 to 0.71 in 2025, signaling weakening liquidity. Debt-to-Equity Ratio increased moderately, stabilizing around 0.5, suggesting controlled leverage. Profitability margins showed variability but overall remained stable.
Are the Financial Ratios Fovorable?
In 2025, profitability ratios like net margin (11.26%) are favorable despite ROE below expectations. Liquidity ratios, including the Current Ratio (0.71) and Quick Ratio (0.58), are unfavorable, posing short-term risk. Leverage indicators such as Debt-to-Equity (0.5) and Debt-to-Assets (27.31%) are favorable, reflecting prudent capital structure. Mixed efficiency and valuation metrics yield a neutral overall stance on Fortive’s financial health.
Shareholder Return Policy
Fortive Corporation maintains a modest dividend payout ratio near 16%, with a stable dividend per share around $0.29–$0.38 over recent years. Its dividend yield hovers around 0.5%, supported by free cash flow coverage exceeding 90%, indicating prudent distribution levels.
The company also executes share buybacks, enhancing shareholder returns alongside dividends. This balanced approach aligns with sustainable long-term value creation, as payout ratios remain conservative and supported by solid cash generation, minimizing risks of over-distribution or excessive repurchases.
Score analysis
The following radar chart displays Fortive Corporation’s key financial metric scores for a comprehensive view:
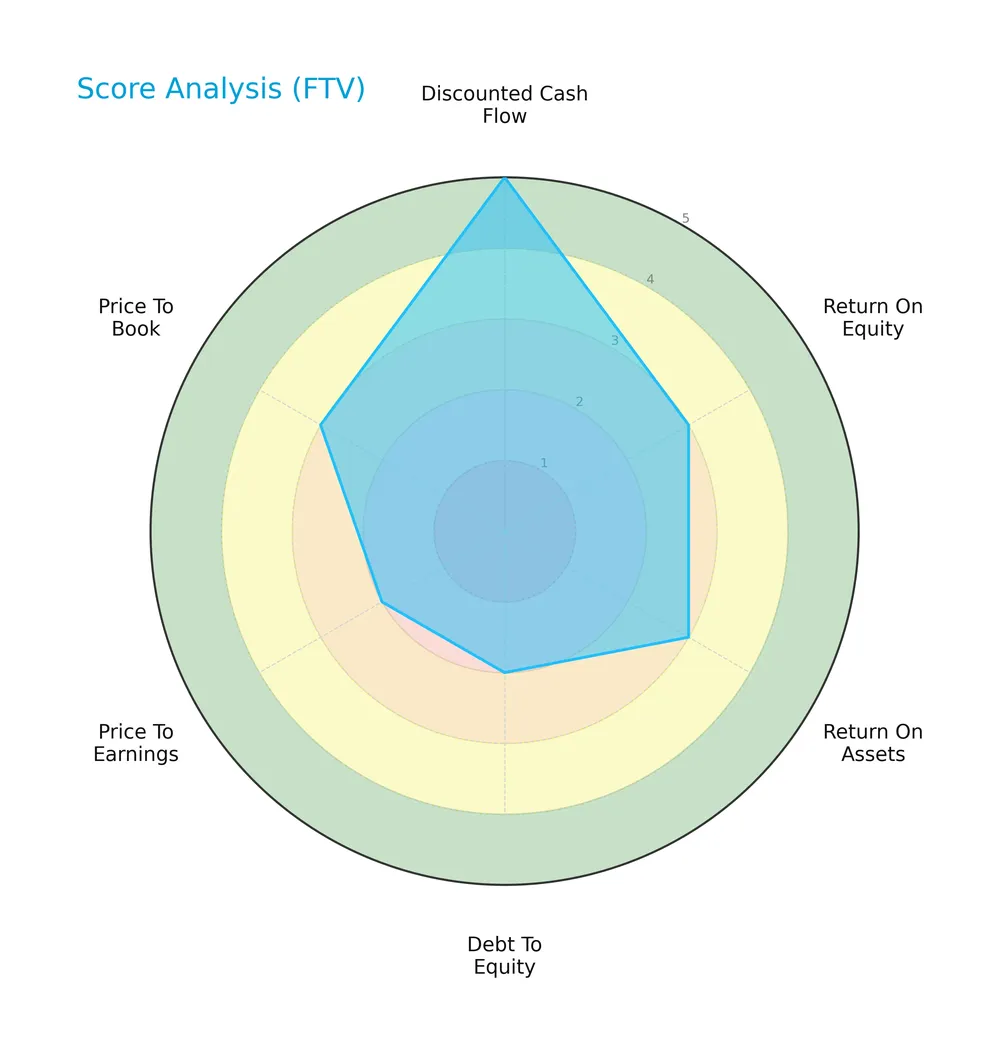
Fortive scores favorably on discounted cash flow (4) and return on assets (4), indicating solid operational efficiency. Return on equity (3) and price-to-book (3) are moderate. Debt-to-equity (2) and price-to-earnings (2) scores appear weak, suggesting leverage and valuation concerns.
Analysis of the company’s bankruptcy risk
Fortive’s Altman Z-Score places it firmly in the safe zone, indicating a low risk of bankruptcy and financial stability:

Is the company in good financial health?
The Piotroski Score diagram illustrates Fortive’s financial strength based on profitability, leverage, and efficiency metrics:

With a strong score of 7, Fortive demonstrates robust financial health. This score reflects solid fundamentals, although not at the highest echelon of financial strength.
Competitive Landscape & Sector Positioning
This section analyzes Fortive Corporation’s strategic positioning within the hardware, equipment, and parts industry. I will examine revenue segments, key products, and main competitors to understand market dynamics. I aim to determine whether Fortive holds a competitive advantage over its peers.
Strategic Positioning
Fortive maintains a diversified product portfolio across three segments: Intelligent Operating Solutions, Advanced Healthcare Solutions, and Precision Technologies. Geographically, it balances exposure with roughly 50% revenue from the U.S., 10-15% from China, and the remainder from other countries, reflecting a broad industrial and healthcare market focus.
Revenue by Segment
This pie chart illustrates Fortive Corporation’s revenue distribution by segment for fiscal year 2025, highlighting contributions from Advanced Healthcare Solutions and Intelligent Operating Solutions.
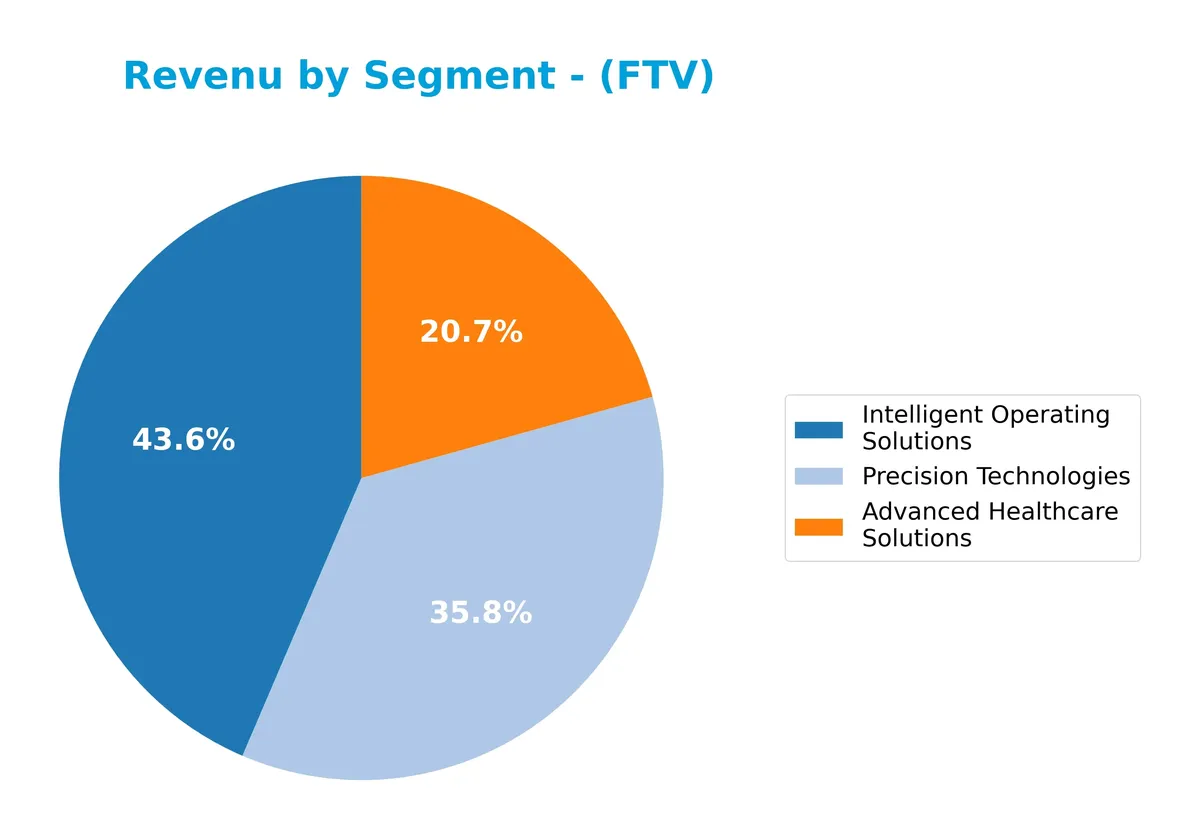
In 2025, Intelligent Operating Solutions leads with $2.86B, showing steady growth since 2021. Advanced Healthcare Solutions follows with $1.30B, nearly flat over recent years. Notably, Precision Technologies no longer appears, indicating a strategic shift or divestiture. The concentration in two key segments marks a streamlined focus, but investors should watch for potential risks tied to reduced diversification.
Key Products & Brands
Fortive Corporation operates through distinct product lines and well-known brand names as follows:
| Product | Description |
|---|---|
| Intelligent Operating Solutions | Offers connected reliability tools, enterprise software for environment, health, safety, quality, facility and asset lifecycle, ruggedized test tools, and calibration devices. Brands include ACCRUENT, FLUKE, GORDIAN, INDUSTRIAL SCIENTIFIC, INTELEX, PRUFTECHNIK, SERVICECHANNEL. Serves manufacturing, healthcare, utilities, and other industries. |
| Precision Technologies | Provides electrical test and measurement instruments, energetic material devices, sensors, and control systems. Brands include ANDERSON-NEGELE, GEMS, SETRA, HENGSTLER-DYNAPAR, QUALITROL, PACIFIC SCIENTIFIC, KEITHLEY, TEKTRONIX. Markets to power, medical, aerospace, and industrial markets. |
| Advanced Healthcare Solutions | Delivers hardware and software products for instrument reprocessing, tracking, biomedical testing, radiation safety, and surgical inventory management. Brands include ASP, CENSIS, CENSITRAC, EVOTECH, FLUKE BIOMEDICAL, INVETECH, LANDAUER, RAYSAFE, STERRAD. Focuses on healthcare compliance and asset management. |
Fortive’s portfolio spans critical industrial and healthcare sectors, supported by a diverse brand lineup tailored to specialized markets.
Main Competitors
There are 20 competitors in the Technology sector, with the table below listing the top 10 leaders by market capitalization:
| Competitor | Market Cap. |
|---|---|
| Amphenol Corporation | 171B |
| Corning Incorporated | 77.7B |
| TE Connectivity Ltd. | 68.6B |
| Sandisk Corporation | 40.0B |
| Garmin Ltd. | 38.9B |
| Keysight Technologies, Inc. | 35.5B |
| Celestica Inc. | 34.0B |
| Coherent, Inc. | 28.7B |
| Jabil Inc. | 25.7B |
| Teledyne Technologies Inc. | 24.4B |
Fortive Corporation ranks 11th in this competitive landscape. Its market cap is 10.8% of the leader’s, Amphenol Corporation. Fortive sits below both the average market cap of the top 10 (54.4B) and the sector median (21.6B). The company leads its closest rival by a 31.5% margin, highlighting a noticeable gap in scale.
Comparisons with competitors
Check out how we compare the company to its competitors:
Does Fortive have a competitive advantage?
Fortive currently shows a slightly unfavorable moat, as its ROIC remains below WACC, indicating value destruction despite improving profitability. Its 60.96% gross margin and 16.4% EBIT margin reflect operational efficiency in a competitive hardware and equipment sector.
Looking ahead, Fortive’s diverse product brands and expansion across industries like healthcare, aerospace, and power suggest growth potential. The company’s focus on connected tools and enterprise software positions it to capture emerging opportunities in digital and industrial markets.
SWOT Analysis
This SWOT analysis highlights Fortive Corporation’s key strategic factors to guide investment decisions.
Strengths
- strong gross margin at 61%
- diversified portfolio across industrial and healthcare sectors
- solid brands like FLUKE and TEKTRONIX
Weaknesses
- declining revenue and net income over 5 years
- low current and quick ratios indicating liquidity risks
- ROIC below WACC signaling value destruction
Opportunities
- growth in healthcare solutions and software segments
- expansion in emerging markets beyond the US
- improving ROIC trend suggests operational leverage
Threats
- market cyclicality impacting industrial demand
- high valuation with PE of 30
- competitive pressure in technology hardware
Fortive faces challenges from shrinking revenues and liquidity constraints despite a strong margin profile. The company must leverage its brand strength and emerging healthcare software opportunities while managing financial risks and valuation pressures.
Stock Price Action Analysis
The weekly stock chart of Fortive Corporation (FTV) displays price movements over the past 100 weeks, highlighting key highs, lows, and trend shifts:
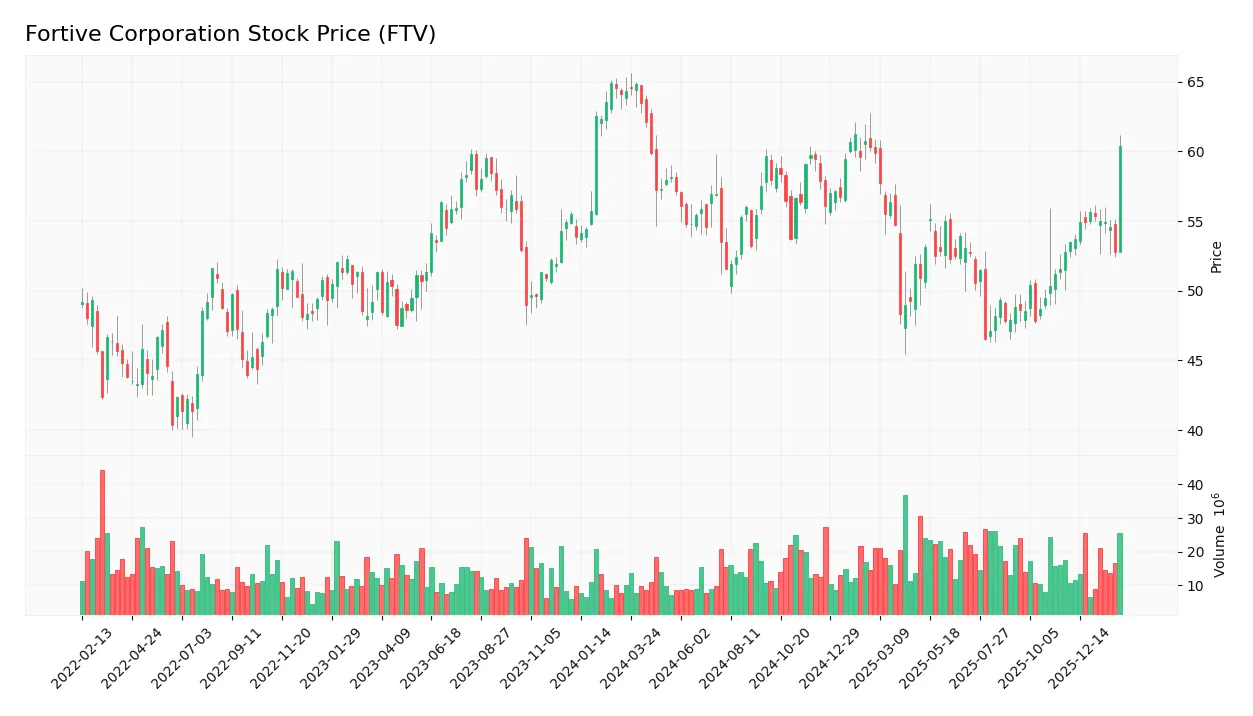
Trend Analysis
Over the past 12 months, FTV’s stock price declined by 8.16%, indicating a bearish trend. The trend shows acceleration with a standard deviation of 3.84. The stock hit a high of 63.5 and a low of 46.55, underscoring significant volatility during this period.
Volume Analysis
Trading volume totals 1.86B shares, with buyer volume at 984M (52.84%) and seller volume at 852M. Volume is increasing overall, suggesting growing market participation. However, in the recent three months, sellers dominate with 63.67% of volume, signaling bearish investor sentiment.
Target Prices
Analysts set a clear target consensus for Fortive Corporation, indicating moderate upside potential.
| Target Low | Target High | Consensus |
|---|---|---|
| 51 | 70 | 61 |
The target range from 51 to 70 reflects cautious optimism. The consensus price of 61 suggests steady growth expectations in line with sector trends.

Don’t Let Luck Decide Your Entry Point
Optimize your entry points with our advanced ProRealTime indicators. You’ll get efficient buy signals with precise price targets for maximum performance. Start outperforming now!
Analyst & Consumer Opinions
This section examines Fortive Corporation’s recent analyst ratings alongside consumer feedback to provide a balanced perspective.
Stock Grades
Here are the latest verified grade updates for Fortive Corporation from leading financial institutions:
| Grading Company | Action | New Grade | Date |
|---|---|---|---|
| JP Morgan | Maintain | Underweight | 2026-02-11 |
| Barclays | Maintain | Equal Weight | 2026-02-09 |
| Wells Fargo | Maintain | Equal Weight | 2026-02-05 |
| RBC Capital | Maintain | Sector Perform | 2026-02-05 |
| Citigroup | Maintain | Neutral | 2026-02-05 |
| JP Morgan | Downgrade | Underweight | 2026-01-16 |
| Mizuho | Downgrade | Underperform | 2026-01-05 |
| Wells Fargo | Maintain | Equal Weight | 2025-12-22 |
| Citigroup | Maintain | Neutral | 2025-12-08 |
| Morgan Stanley | Maintain | Equal Weight | 2025-11-05 |
The consensus leans toward a Hold rating, reflecting a cautious stance. Recent downgrades by JP Morgan and Mizuho suggest tempered expectations amid stable but unspectacular outlooks from other firms.
Consumer Opinions
Fortive Corporation sparks mixed consumer sentiment, reflecting its complex market presence.
| Positive Reviews | Negative Reviews |
|---|---|
| “Reliable industrial solutions with strong innovation.” | “Customer service response times can be slow.” |
| “Consistently high-quality products that improve efficiency.” | “Pricing feels steep compared to competitors.” |
| “Strong commitment to sustainability and corporate responsibility.” | “Occasional issues with product availability.” |
Overall, consumers praise Fortive for product reliability and innovation. However, concerns about pricing and customer support recur, suggesting areas for operational improvement.
Risk Analysis
Below is a summary table outlining Fortive Corporation’s key risks, their likelihood, and potential impact:
| Category | Description | Probability | Impact |
|---|---|---|---|
| Liquidity Risk | Current ratio of 0.71 and quick ratio of 0.58 signal weak short-term liquidity. | High | Medium |
| Valuation Risk | Elevated P/E of 30.16 suggests the stock may be overvalued compared to sector averages. | Medium | High |
| Profitability Risk | Return on equity (8.98%) lags behind cost of capital (7.71%), indicating mediocre returns. | Medium | Medium |
| Debt Risk | Debt-to-equity score unfavorable, though interest coverage of 7.0 is adequate. | Low | Medium |
| Market Volatility | Beta near 1.03 implies sensitivity to market swings, adding price volatility risk. | Medium | Medium |
The most pressing concerns are Fortive’s weak liquidity ratios and rich valuation multiple. The sub-1.0 current ratio signals potential short-term cash flow constraints, a red flag in cyclical sectors like hardware and equipment. Meanwhile, the high P/E ratio demands sustained growth to justify the premium. Although the Altman Z-score of 3.36 places the company safely above bankruptcy risk, prudence suggests monitoring liquidity trends closely.
Should You Buy Fortive Corporation?
Fortive appears to be improving profitability with growing operational efficiency despite a slightly unfavorable moat indicating value erosion. Its leverage profile suggests caution. Supported by a strong Piotroski score and safe Altman Z-Score, the overall rating could be seen as B+.
Strength & Efficiency Pillars
Fortive Corporation delivers solid operational margins with a gross margin of 60.96% and an EBIT margin of 16.4%. The net margin stands at a respectable 11.26%, reflecting consistent profitability. While the ROIC of 7.44% is slightly below the WACC of 7.71%, indicating the company is currently shedding value, the ROIC trend shows a robust 47.5% growth. This suggests improving capital efficiency despite a modest value destruction. The Piotroski score of 7 reinforces strong financial health.
Weaknesses and Drawbacks
Fortive faces headwinds from a bearish stock trend with an 8.16% price decline over the last year and recent seller dominance at 63.7%. Its price-to-earnings ratio of 30.16 signals a premium valuation that could deter value investors. Liquidity is a concern, with a low current ratio of 0.71 and quick ratio at 0.58, indicating potential short-term solvency risks. Additionally, asset turnover at 0.44 hints at less efficient asset utilization, which may limit growth prospects.
Our Final Verdict about Fortive Corporation
Fortive’s financial foundation appears stable, supported by a safe Altman Z-Score of 3.36 and a strong Piotroski score. Despite the company’s improving profitability, its value destruction relative to WACC and recent market pressure suggest caution. The profile might appear attractive for long-term exposure, but recent seller dominance invites a wait-and-see approach for a more favorable entry point.
Disclaimer: This content is for informational purposes only and does not constitute financial, investment, or other professional advice. Investing in financial markets involves a significant risk of loss, and past performance is not indicative of future results.
Additional Resources
- Fortive board declares 6-cent quarterly payout to shareholders – Stock Titan (Feb 25, 2026)
- Decoding Fortive Corp (FTV): A Strategic SWOT Insight – GuruFocus (Feb 26, 2026)
- Envestnet Asset Management Inc. Sells 204,685 Shares of Fortive Corporation $FTV – MarketBeat (Feb 24, 2026)
- 3 Reasons FTV is Risky and 1 Stock to Buy Instead – Finviz (Feb 24, 2026)
- Fortive Faces Softer Demand As Analysts Question Next Growth Phase – simplywall.st (Feb 25, 2026)
For more information about Fortive Corporation, please visit the official website: fortive.com