Home > Analyses > Technology > Fortinet, Inc.
Fortinet, Inc. fortifies the digital backbone of enterprises worldwide, protecting critical data and networks from relentless cyber threats. As a pioneer in cybersecurity infrastructure, it delivers an integrated suite of hardware and software solutions that secure everything from firewalls to endpoint devices. Renowned for innovation and reliability, Fortinet commands a strong position in a rapidly evolving sector. The key question now: does its robust market presence translate into sustainable growth and valuation?
Table of contents
Business Model & Company Overview
Fortinet, Inc., founded in 2000 and headquartered in Sunnyvale, California, commands a dominant position in the cybersecurity landscape. It delivers an integrated ecosystem of hardware and software solutions, including FortiGate firewalls and FortiSwitch secure networking products. Its mission centers on comprehensive, automated security that protects a diverse range of industries from telecommunications to healthcare.
The company’s revenue engine balances robust hardware sales with high-margin software licenses and recurring security subscriptions. Fortinet operates strategically across the Americas, Europe, and Asia, serving global markets with scalable management and advanced endpoint protection. Its well-entrenched ecosystem creates a formidable economic moat, securing its role as an industry architect.
Financial Performance & Fundamental Metrics
I analyze Fortinet, Inc.’s income statement, key financial ratios, and dividend payout policy to assess its profitability, efficiency, and shareholder returns.
Income Statement
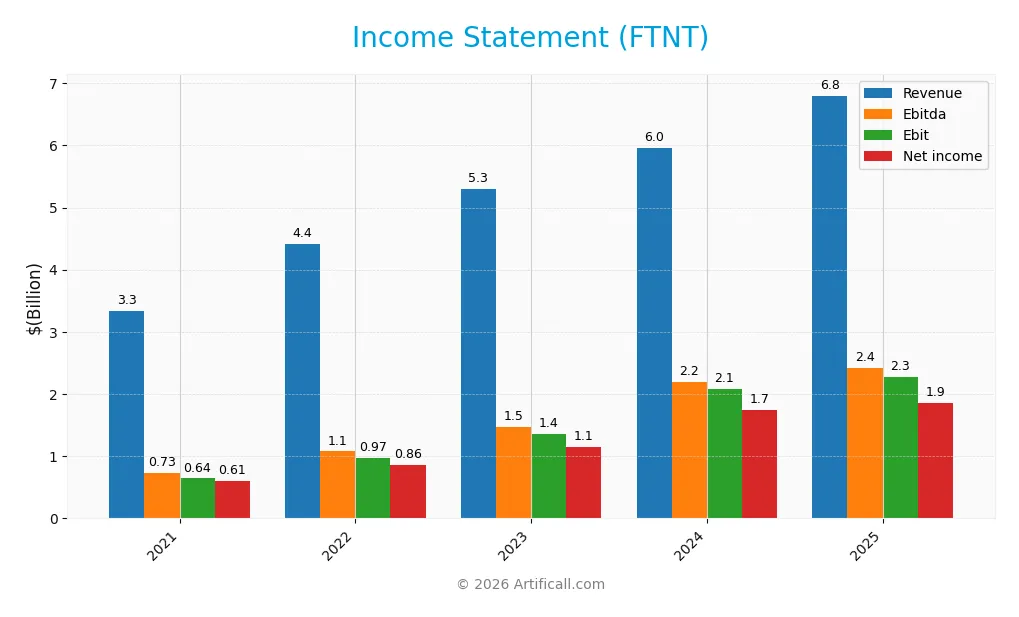
The following table summarizes Fortinet, Inc.’s key income statement metrics for fiscal years 2021 through 2025, reported in USD.
| 2021 | 2022 | 2023 | 2024 | 2025 | |
|---|---|---|---|---|---|
| Revenue | 3.34B | 4.42B | 5.30B | 5.96B | 6.80B |
| Cost of Revenue | 783M | 1.08B | 1.24B | 1.16B | 1.30B |
| Operating Expenses | 1.91B | 2.36B | 2.83B | 2.99B | 3.42B |
| Gross Profit | 2.56B | 3.33B | 4.07B | 4.80B | 5.50B |
| EBITDA | 728M | 1.08B | 1.47B | 2.20B | 2.46B |
| EBIT | 643M | 974M | 1.35B | 2.08B | 2.31B |
| Interest Expense | 15M | 18M | 21M | 20M | 20M |
| Net Income | 607M | 857M | 1.15B | 1.75B | 1.85B |
| EPS | 0.74 | 1.08 | 1.47 | 2.28 | 2.44 |
| Filing Date | 2022-02-25 | 2023-02-24 | 2024-02-26 | 2025-02-21 | 2026-02-25 |
Income Statement Evolution
Fortinet’s revenue more than doubled from 3.34B in 2021 to 6.80B in 2025, reflecting robust top-line growth. Net income surged over 200% to 1.85B, with net margins improving by over 50% during the period. Gross and EBIT margins remained strong and stable, signaling efficient cost management amid expanding operations.
Is the Income Statement Favorable?
In 2025, Fortinet posted an 80.8% gross margin and a 34.0% EBIT margin, both favorable and indicating solid profitability. Interest expense stayed minimal at 0.3% of revenue, supporting strong net margins of 27.3%. Despite a slight 7% net margin dip year-over-year, overall fundamentals remain favorable, driven by double-digit revenue and profit growth.
Financial Ratios
The table below presents key financial ratios for Fortinet, Inc. (FTNT) from 2021 to 2025, reflecting profitability, liquidity, leverage, efficiency, and dividend metrics:
| Ratios | 2021 | 2022 | 2023 | 2024 | 2025 |
|---|---|---|---|---|---|
| Net Margin | 18% | 19% | 22% | 29% | 27% |
| ROE | 78% | -304% | -248% | 117% | 150% |
| ROIC | 18% | 30% | 31% | 27% | 29% |
| P/E | 97 | 45 | 40 | 41 | 32 |
| P/B | 75 | -137 | -98 | 48 | 48 |
| Current Ratio | 1.55 | 1.24 | 1.19 | 1.47 | 1.17 |
| Quick Ratio | 1.48 | 1.15 | 1.06 | 1.39 | 1.09 |
| D/E | 1.26 | -3.52 | -2.14 | 0.67 | 0.81 |
| Debt-to-Assets | 17% | 16% | 14% | 10% | 10% |
| Interest Coverage | 44 | 54 | 59 | 90 | 104 |
| Asset Turnover | 0.56 | 0.71 | 0.73 | 0.61 | 0.65 |
| Fixed Asset Turnover | 4.86 | 4.92 | 5.08 | 4.41 | 4.20 |
| Dividend Yield | 0% | 0% | 0% | 0% | 0% |
Evolution of Financial Ratios
Fortinet’s Return on Equity (ROE) surged sharply to 150% in 2025, reflecting strong profitability improvement. The Current Ratio declined from 1.55 in 2021 to 1.17 in 2025, signaling reduced liquidity but remaining above 1. Debt-to-Equity ratio rose moderately to 0.81, indicating steady leverage without aggressive borrowing. Profit margins expanded steadily, confirming enhanced profitability.
Are the Financial Ratios Favorable?
In 2025, Fortinet shows a robust net margin of 27.3% and high ROE at 150%, both favorable. Liquidity is adequate with a quick ratio of 1.09, though the current ratio is neutral at 1.17. Leverage metrics are neutral to favorable, with debt-to-assets at 9.6% and interest coverage strong at 115x. Market valuation ratios like P/E (31.8) and P/B (47.7) appear unfavorable, tempering the overall slightly favorable ratio assessment.
Shareholder Return Policy
Fortinet, Inc. does not pay dividends, reflecting a reinvestment strategy aligned with its growth phase. The company focuses on capital allocation towards R&D and acquisitions, supporting innovation and competitive positioning in cybersecurity. Fortinet also engages in share buybacks, indicating a commitment to returning value through capital structure management.
This approach favors sustainable long-term value creation by prioritizing growth and operational cash flow reinvestment. The absence of dividends coupled with share repurchases suggests prudence, balancing shareholder returns with strategic expansion.
Score analysis
The following radar chart illustrates Fortinet, Inc.’s key financial scores across valuation and profitability metrics:
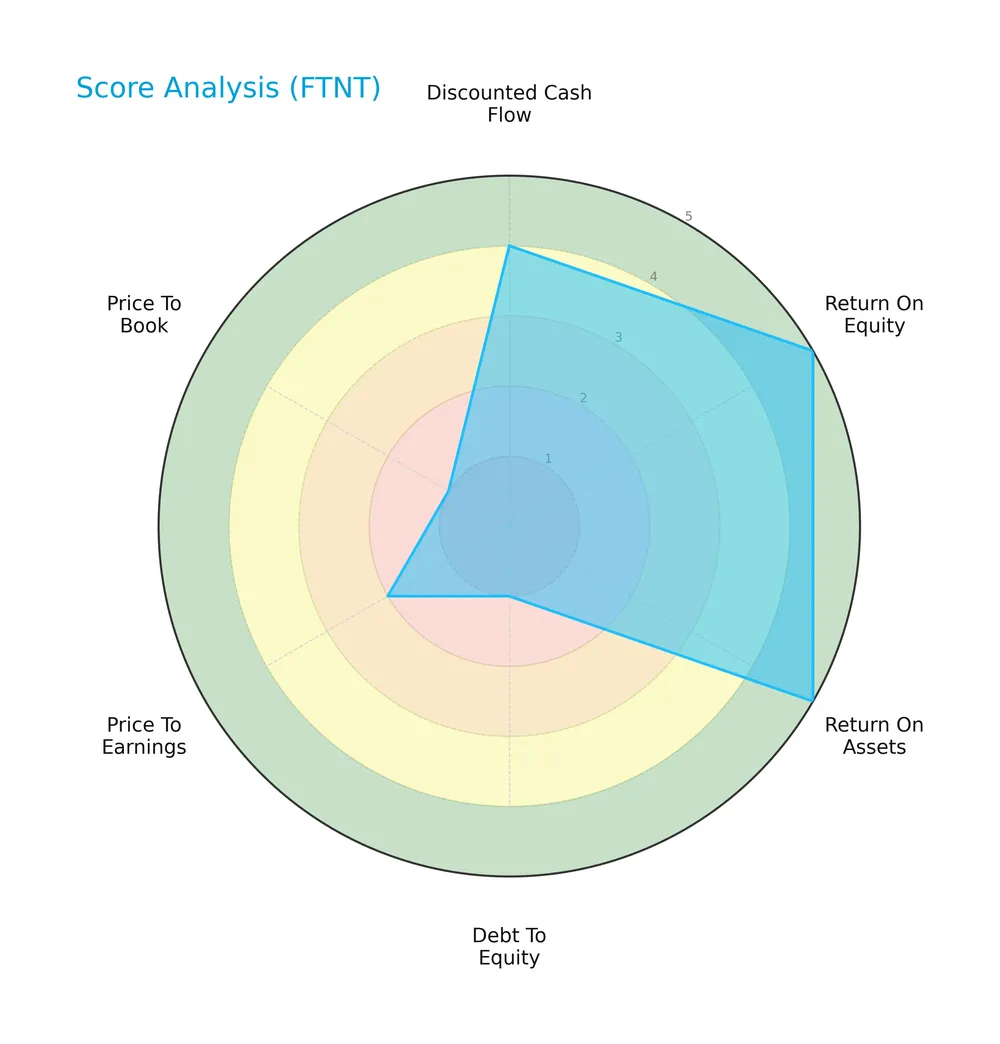
Fortinet scores very favorably in return on equity and assets, reflecting strong profitability. The discounted cash flow score is favorable, but valuation metrics show weakness, with very unfavorable debt-to-equity and price-to-book ratios, and an unfavorable price-to-earnings score.
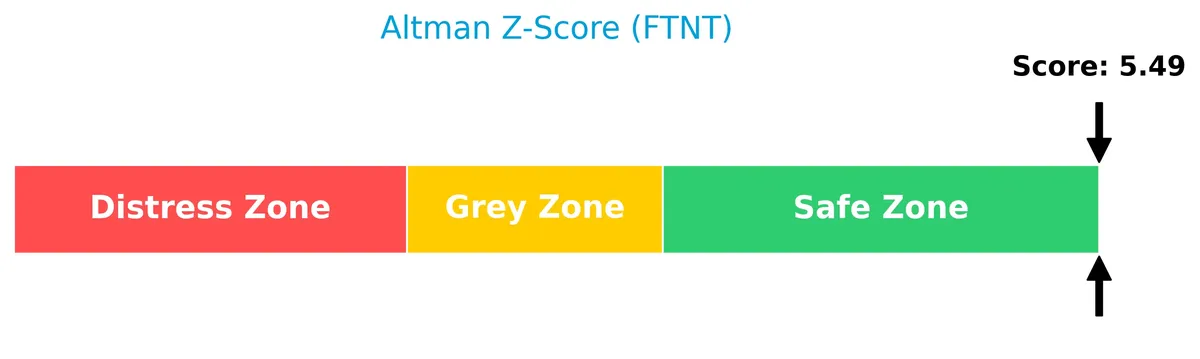
Analysis of the company’s bankruptcy risk
Fortinet’s Altman Z-Score places it well within the safe zone, indicating a low risk of bankruptcy:
Is the company in good financial health?
The Piotroski Score diagram below highlights Fortinet’s financial health assessment:

With a Piotroski Score of 6, Fortinet demonstrates average financial strength, suggesting moderate operational efficiency and profitability but leaving room for improvement compared to stronger peers.
Competitive Landscape & Sector Positioning
This sector analysis reviews Fortinet, Inc.’s strategic positioning, revenue streams, and key products. I will assess whether Fortinet holds a competitive advantage over its main rivals.
Strategic Positioning
Fortinet maintains a diversified product portfolio spanning hardware, software licenses, and security services, with revenues growing consistently across product, subscription, and technical support segments. Geographically, it balances exposure among Americas (2.7B), EMEA (2.8B), and Asia Pacific (1.3B), reflecting broad global reach in cybersecurity infrastructure.
Revenue by Segment
The pie chart illustrates Fortinet’s revenue breakdown by segment for fiscal year 2025, highlighting product sales, security subscriptions, and technical support contributions.
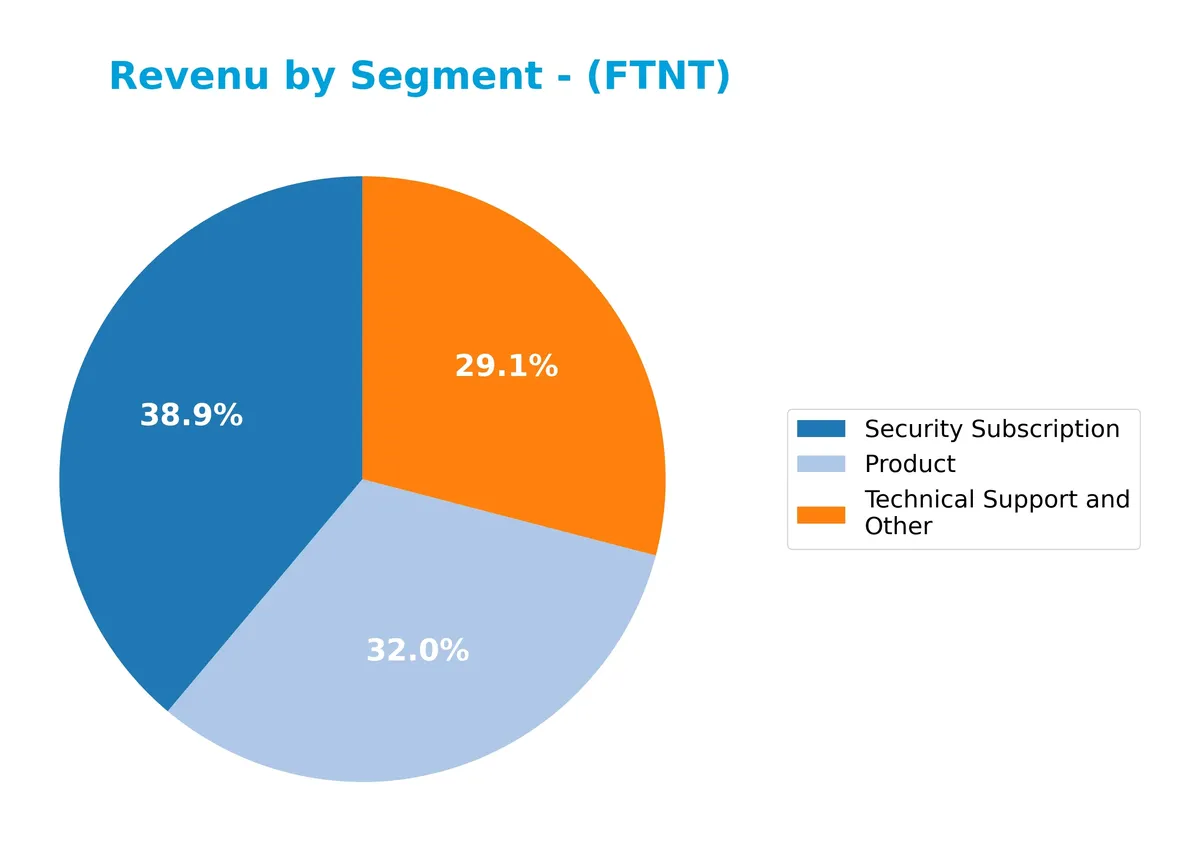
Fortinet’s 2025 revenue shows robust growth across all segments, with Security Subscription leading at $2.63B, followed by Product at $2.22B and Technical Support at $1.95B. Subscription revenue now drives the business, reflecting strong recurring demand and higher customer retention. The steady increase in Technical Support also supports long-term client relationships. This shift toward subscription models indicates Fortinet’s strategic focus on stable, predictable cash flows amid evolving cybersecurity needs.
Key Products & Brands
Fortinet’s product and brand portfolio includes cybersecurity hardware, software, and services designed for comprehensive network protection:
| Product | Description |
|---|---|
| FortiGate | Hardware and software licenses offering firewall, intrusion prevention, VPN, malware defense, and web filtering. |
| FortiSwitch | Secure switching solutions connecting end devices to customer networks. |
| FortiAP | Secure wireless networking solutions. |
| FortiExtender | Hardware appliance supporting extended network connectivity. |
| FortiAnalyzer | Centralized network logging, analysis, and reporting solutions. |
| FortiManager | Centralized, scalable management for FortiGate products. |
| FortiWeb | Web application firewall solutions. |
| FortiMail | Secure email gateway solutions. |
| FortiSandbox | Proactive detection and mitigation technology. |
| FortiClient | Endpoint protection with anti-malware, exploit protection, web filtering, and application firewall. |
| FortiToken & FortiAuthenticator | Multi-factor authentication products securing systems and data. |
| FortiEDR/XDR | Endpoint detection and response solutions with machine-learning anti-malware capabilities. |
Fortinet supplements its hardware and software with security subscriptions, technical support, and professional services, targeting diverse industries worldwide. The company’s integrated approach reflects strong recurring revenue growth in security subscriptions, surpassing $2.6B in 2025.
Main Competitors
There are 32 competitors in total, with the table below listing the top 10 leaders by market capitalization:
| Competitor | Market Cap. |
|---|---|
| Microsoft Corporation | 3.52T |
| Oracle Corporation | 553B |
| Palantir Technologies Inc. | 383B |
| Adobe Inc. | 140B |
| Palo Alto Networks, Inc. | 120B |
| CrowdStrike Holdings, Inc. | 113B |
| Synopsys, Inc. | 92B |
| Cloudflare, Inc. | 69B |
| Fortinet, Inc. | 59B |
| Block, Inc. | 40B |
Fortinet ranks 9th among 32 competitors, with a market cap at 1.69% of Microsoft’s lead. It sits below the average top-10 market cap of 508B but above the sector median of 18.8B. The 16.5% gap from its next closest rival highlights a modest buffer in its competitive positioning.
Comparisons with competitors
Check out how we compare the company to its competitors:
Does Fortinet have a competitive advantage?
Fortinet demonstrates a sustainable competitive advantage, supported by a very favorable moat rating and a ROIC exceeding its WACC by over 20%. Its profitability has grown strongly, signaling efficient capital use and value creation.
The company’s broad cybersecurity portfolio spans hardware, software, and services across multiple regions, including Americas and EMEA. Expansion opportunities lie in new product innovation and increasing demand in Asia Pacific and Japan markets.
SWOT Analysis
This analysis highlights Fortinet’s key internal and external factors shaping its competitive position and growth prospects.
Strengths
- strong gross margin at 80.8%
- robust ROIC of 28.7% well above WACC
- diversified product suite across cybersecurity functions
Weaknesses
- high price-to-book ratio at 47.7 signals valuation risk
- moderate current ratio at 1.17 limits liquidity cushion
- net margin declined 7% last year
Opportunities
- expanding global cybersecurity demand
- growth in Asia Pacific and Europe markets
- increasing adoption of integrated security platforms
Threats
- intense competition in cybersecurity sector
- rapid tech changes require continuous innovation
- regulatory and geopolitical risks impacting sales
Fortinet demonstrates a solid moat with high profitability and expanding revenues. However, valuation premiums and a slight margin contraction warrant caution. The company’s strategy must emphasize innovation and global expansion to sustain its competitive edge amid rising industry risks.
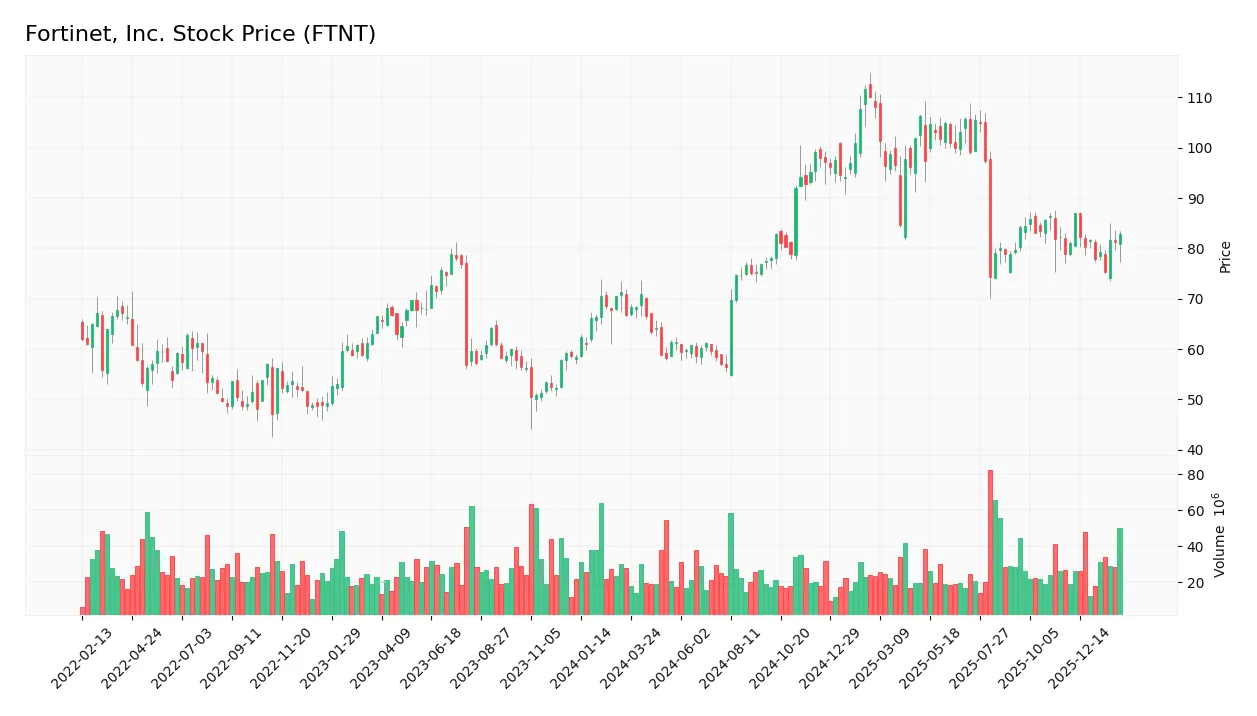
Stock Price Action Analysis
The weekly stock chart of Fortinet, Inc. (FTNT) over the past 12 months reveals significant price movements and volatility patterns:
Trend Analysis
Over the past 12 months, FTNT’s stock price increased by 9.08%, indicating a bullish trend. Volatility remains elevated with a 14.83 standard deviation. The stock reached a high of 111.64 and a low of 56.51. However, the trend shows deceleration despite the overall upward movement.
Volume Analysis
In the last three months, trading volume increased but was slightly seller-driven, with buyers accounting for 44.93%. This shift suggests cautious investor sentiment and a modest decline in buyer participation amid rising market activity.
Target Prices
Analysts set a confident target consensus for Fortinet, Inc., reflecting solid growth expectations.
| Target Low | Target High | Consensus |
|---|---|---|
| 70 | 95 | 85.71 |
The target prices suggest analysts anticipate Fortinet’s stock to appreciate, with a balanced outlook between conservative and optimistic valuations.

Don’t Let Luck Decide Your Entry Point
Optimize your entry points with our advanced ProRealTime indicators. You’ll get efficient buy signals with precise price targets for maximum performance. Start outperforming now!
Analyst & Consumer Opinions
This section examines Fortinet, Inc.’s analyst grades and consumer feedback to provide a balanced market perspective.
Stock Grades
Here are the latest verified stock grades from prominent financial institutions for Fortinet, Inc.:
| Grading Company | Action | New Grade | Date |
|---|---|---|---|
| BMO Capital | Maintain | Market Perform | 2026-02-09 |
| Citigroup | Maintain | Neutral | 2026-02-09 |
| Mizuho | Maintain | Underperform | 2026-02-06 |
| RBC Capital | Maintain | Sector Perform | 2026-02-06 |
| Rosenblatt | Maintain | Buy | 2026-02-06 |
| Wedbush | Maintain | Outperform | 2026-02-06 |
| JP Morgan | Maintain | Underweight | 2026-02-06 |
| Scotiabank | Downgrade | Sector Perform | 2026-02-02 |
| JP Morgan | Maintain | Underweight | 2026-01-30 |
| Rosenblatt | Upgrade | Buy | 2026-01-29 |
The consensus grades indicate a mixed but stable outlook with most firms maintaining their prior ratings. Notably, Rosenblatt upgraded to Buy recently, while Scotiabank downgraded slightly, reflecting cautious sentiment.
Consumer Opinions
Fortinet, Inc. enjoys strong customer loyalty, but some users voice concerns about support and pricing.
| Positive Reviews | Negative Reviews |
|---|---|
| Robust security features that adapt well to threats | Customer service response times can be slow |
| Intuitive interface simplifies complex setups | Licensing costs are higher than some competitors |
| High performance with minimal network impact | Occasional software bugs disrupt operations |
Overall, Fortinet wins praise for its powerful, user-friendly security solutions. However, pricing and customer support emerge as consistent pain points among users.
Risk Analysis
Below is a summary of key risks facing Fortinet, Inc., including their likelihood and potential impact:
| Category | Description | Probability | Impact |
|---|---|---|---|
| Valuation Risk | Elevated P/E (31.8) and PB (47.7) ratios suggest overvaluation concerns. | High | High |
| Competitive Risk | Intense cybersecurity market competition could pressure margins and growth. | Medium | High |
| Debt Risk | Debt-to-equity ratio is relatively high (0.81), increasing financial leverage. | Medium | Medium |
| Market Volatility | Beta of 1.05 indicates sensitivity to market swings, impacting stock price. | Medium | Medium |
| Dividend Risk | No dividend yield, which may deter income-focused investors. | High | Low |
The most pressing risks are valuation and competitive pressures. Fortinet trades at a premium versus sector averages, exposing it to correction if growth slows. Competition in cybersecurity intensifies, potentially eroding Fortinet’s 27% net margin despite strong ROIC at 28.7%. Its solid Altman Z-Score (5.19) confirms financial stability, but leverage and market sensitivity warrant caution.
Should You Buy Fortinet, Inc.?
Fortinet appears to be a robust value creator with a very favorable, durable moat supported by growing ROIC well above WACC. Despite an unfavorable leverage profile, the company’s overall B+ rating suggests moderate financial health and operational efficiency.
Strength & Efficiency Pillars
Fortinet, Inc. demonstrates robust profitability with a net margin of 27.26% and an exceptional return on equity of 149.77%. Its return on invested capital (ROIC) stands at 28.75%, substantially exceeding its weighted average cost of capital (WACC) of 8.46%, confirming Fortinet as a clear value creator. The company’s gross margin is a strong 80.84%, reflecting operational efficiency. Interest expense remains minimal at 0.3%, supporting sustainable earnings. These metrics collectively indicate a firm with a durable competitive advantage and growing profitability.
Weaknesses and Drawbacks
Fortinet faces valuation challenges, with a high price-to-earnings ratio of 31.84 and an excessively elevated price-to-book ratio of 47.68, signaling a potentially overvalued stock. While leverage metrics are mixed—debt-to-equity at a moderate 0.81 and a current ratio of 1.17—the company carries some risk from premium pricing. Additionally, the lack of dividend yield may deter income-focused investors. Recent market behavior shows slight seller dominance (44.93% buyers), presenting short-term headwinds despite the overall bullish trend.
Our Final Verdict about Fortinet, Inc.
Fortinet’s long-term fundamentals appear solid, supported by strong profitability and value creation. Despite a recent seller-dominant phase, the bullish overall trend suggests potential upside. However, premium valuation metrics warrant caution. This profile may appear attractive for long-term exposure but suggests a wait-and-see approach for a better entry point given near-term market pressures.
Disclaimer: This content is for informational purposes only and does not constitute financial, investment, or other professional advice. Investing in financial markets involves a significant risk of loss, and past performance is not indicative of future results.
Additional Resources
- Decoding Fortinet Inc (FTNT): A Strategic SWOT Insight – GuruFocus (Feb 26, 2026)
- Fortinet, Inc. (FTNT) Downgraded to Hold Despite Strong Q4 as Analysts Warn of Margin Pressures – Yahoo Finance (Feb 22, 2026)
- Fortinet, Inc. SEC 10-K Report – TradingView (Feb 25, 2026)
- Fortinet, Inc. $FTNT Shares Purchased by Lansforsakringar Fondforvaltning AB publ – MarketBeat (Feb 23, 2026)
- Is Fortinet Entering Its Next Phase? – Forbes (Feb 23, 2026)
For more information about Fortinet, Inc., please visit the official website: fortinet.com