Home > Analyses > Consumer Cyclical > Ford Motor Company
Ford shapes how millions move daily, blending rugged trucks with sleek luxury in a rapidly evolving auto landscape. The company commands respect through its Ford Blue, Model e, and Pro segments, pushing innovation in electric and commercial vehicles alike. With a legacy stretching over a century and a workforce of 170K, Ford balances heritage with modern ambition. The key question: can its fundamentals sustain growth amid intensifying competition and technological disruption?

Table of contents
Business Model & Company Overview
Ford Motor Company, founded in 1903 and headquartered in Dearborn, Michigan, commands a dominant position in the global auto manufacturing industry. It delivers a cohesive ecosystem of Ford trucks, commercial cars, SUVs, and Lincoln luxury vehicles, blending innovation with tradition. Operating through Ford Blue, Ford Model e, Ford Pro, Ford Next, and Ford Credit segments, it integrates manufacturing, services, and financing in a unified mission to serve diverse customer needs worldwide.
Ford’s revenue engine balances vehicle sales with recurring services such as financing, leasing, and dealer loans, creating a resilient cash flow framework. It reaches customers across the Americas, Europe, and Asia, leveraging its broad distribution network. I view Ford’s competitive advantage as its deep integration of product and financial services, securing its economic moat and shaping the future of mobility.
Financial Performance & Fundamental Metrics
I analyze Ford Motor Company’s income statement, key financial ratios, and dividend payout policy to assess its core profitability and capital return strategy.
Income Statement
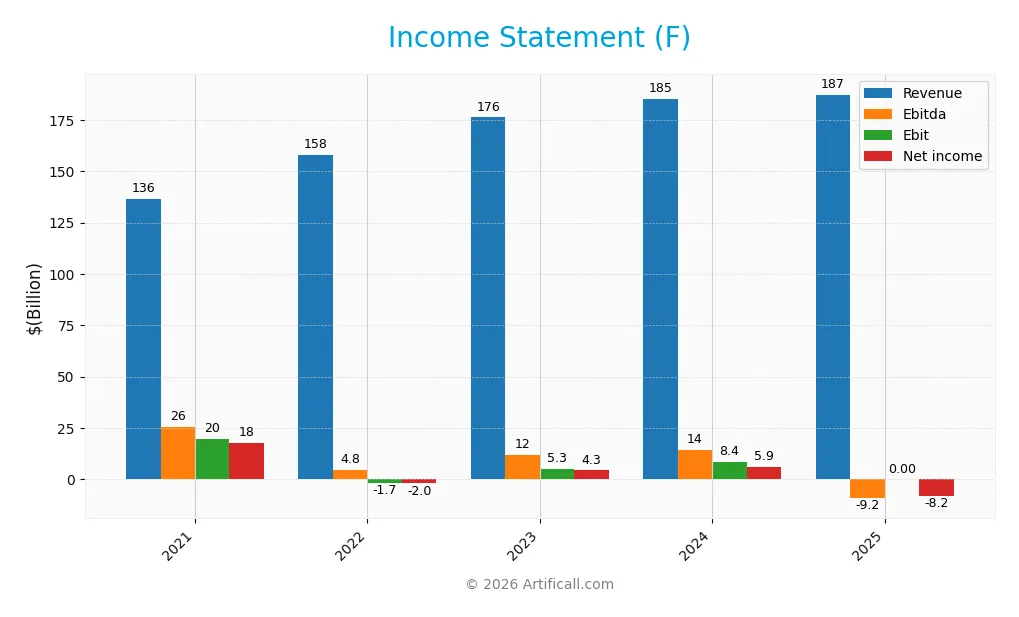
The table below summarizes Ford Motor Company’s key income statement figures for fiscal years 2021 through 2025 in USD.
| 2021 | 2022 | 2023 | 2024 | 2025 | |
|---|---|---|---|---|---|
| Revenue | 136.3B | 158.1B | 176.2B | 185.0B | 187.3B |
| Cost of Revenue | 119.9B | 140.9B | 160.0B | 169.5B | 0 |
| Operating Expenses | 11.9B | 10.9B | 10.7B | 10.3B | 10.8B |
| Gross Profit | 16.4B | 17.2B | 16.2B | 15.5B | 0 |
| EBITDA | 25.5B | 4.8B | 11.8B | 14.2B | -9.2B |
| EBIT | 19.6B | -1.7B | 5.3B | 8.4B | 0 |
| Interest Expense | 1.8B | 1.3B | 1.3B | 1.1B | 11.1B |
| Net Income | 17.9B | -2.0B | 4.3B | 5.9B | -8.2B |
| EPS | 4.49 | -0.49 | 1.09 | 1.48 | -2.06 |
| Filing Date | 2022-02-04 | 2023-02-03 | 2024-02-06 | 2025-02-11 | 2026-02-11 |
Income Statement Evolution
Ford’s revenue grew modestly by 1.2% in 2025, reaching $187B, continuing a favorable 37% rise since 2021. However, net income declined sharply, turning negative at -$8.2B in 2025 from $5.9B in 2024. Margins deteriorated significantly, with gross and EBIT margins collapsing to zero, signaling severe profitability pressure over the period.
Is the Income Statement Favorable?
The 2025 income statement reveals unfavorable fundamentals. Operating income fell to -$9.2B, driven by high operating expenses of $10.8B and heavy interest costs of $11.1B. The net margin is deeply negative at -4.4%, reflecting high leverage and weak profitability. This contrasts starkly with previous years’ positive earnings, highlighting substantial financial strain.
Financial Ratios
The following table summarizes key financial ratios for Ford Motor Company over the last five fiscal years, providing a snapshot of profitability, liquidity, valuation, leverage, and efficiency:
| Ratios | 2021 | 2022 | 2023 | 2024 | 2025 |
|---|---|---|---|---|---|
| Net Margin | 13% | -1.3% | 2.5% | 3.2% | -4.4% |
| ROE | 37% | -4.6% | 10% | 13% | -23% |
| ROIC | 2.1% | 2.1% | 2.5% | 1.8% | -2.7% |
| P/E | 4.6 | -23.6 | 11.2 | 6.7 | -6.4 |
| P/B | 1.7 | 1.1 | 1.1 | 0.9 | 1.5 |
| Current Ratio | 1.20 | 1.20 | 1.20 | 1.16 | 1.07 |
| Quick Ratio | 1.07 | 1.06 | 1.04 | 1.02 | 0.94 |
| D/E | 2.9 | 3.2 | 3.5 | 3.6 | 4.5 |
| Debt-to-Assets | 54% | 55% | 55% | 56% | 56% |
| Interest Coverage | 2.5 | 4.9 | 4.1 | 4.6 | -0.8 |
| Asset Turnover | 0.53 | 0.62 | 0.64 | 0.65 | 0.65 |
| Fixed Asset Turnover | 2.1 | 2.6 | 2.8 | 2.9 | 2.8 |
| Dividend Yield | 0.5% | 4.3% | 10.2% | 7.9% | 5.7% |
Evolution of Financial Ratios
Ford’s Return on Equity (ROE) declined sharply to -22.76% in 2025, signaling deteriorating profitability. The Current Ratio decreased slightly to 1.07, indicating stable but modest liquidity. The Debt-to-Equity ratio rose to 4.54, reflecting increased leverage and financial risk. Profitability margins weakened significantly, with net margin turning negative.
Are the Financial Ratios Favorable?
Profitability metrics such as ROE and net margin are unfavorable, highlighting operational challenges. Liquidity ratios like Current and Quick Ratios remain neutral, suggesting adequate short-term asset coverage. Leverage ratios, including Debt-to-Equity and Debt-to-Assets, are unfavorable, indicating elevated financial risk. Market value multiples show mixed signals, with some favorable metrics but overall the financial ratios present a slightly unfavorable profile.
Shareholder Return Policy
Ford Motor Company consistently pays dividends, with a dividend yield around 5.7% in 2025 and a payout ratio reflecting negative net income, indicating distributions may exceed earnings. The company also conducts share buybacks, supported by positive free cash flow coverage.
Despite losses in 2025, Ford’s dividend and buyback policy relies on cash flow rather than net income. This approach carries risks of unsustainable payouts, but the combination suggests management aims to maintain shareholder returns while navigating profitability challenges.
Score analysis
The radar chart below illustrates Ford Motor Company’s key financial scores across valuation, profitability, and leverage metrics:
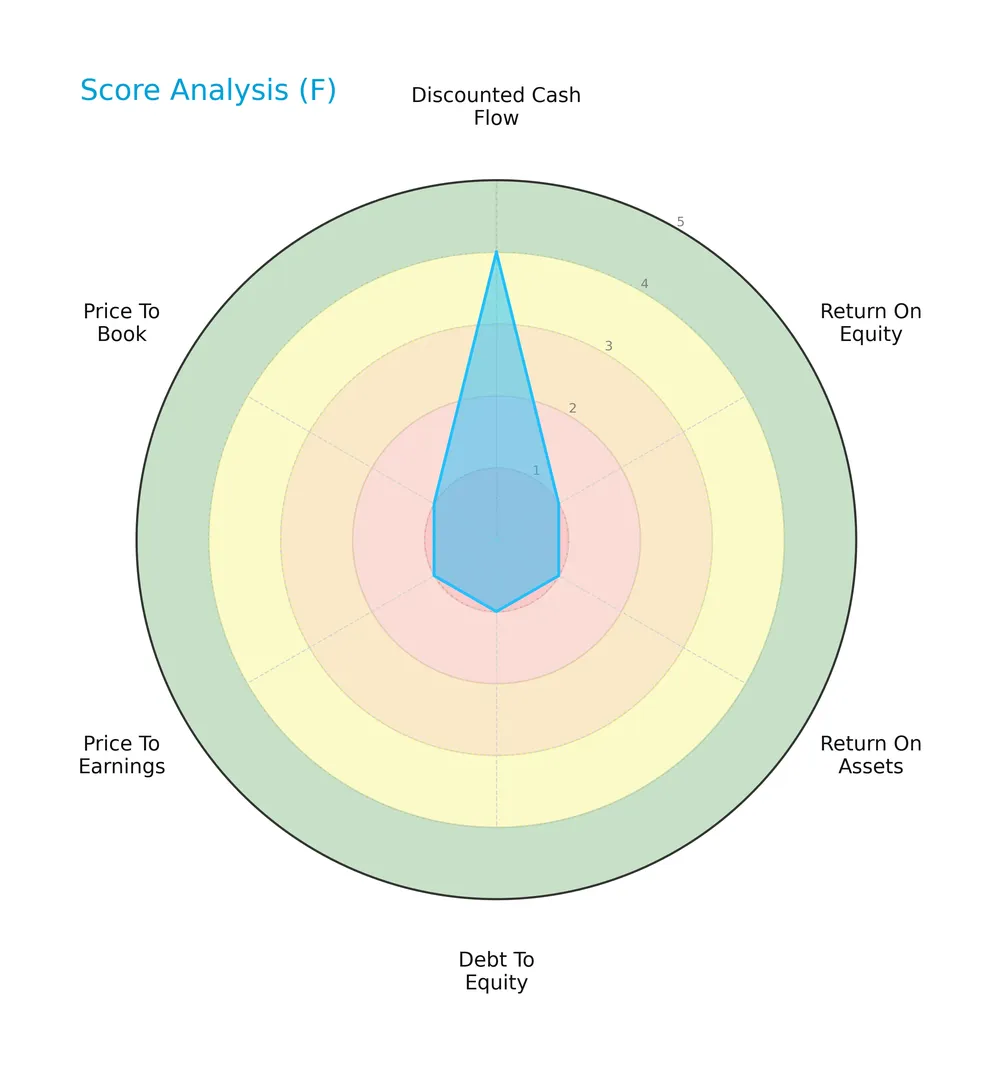
Ford’s discounted cash flow score registers as favorable at 4, but all other scores—return on equity, return on assets, debt to equity, price to earnings, and price to book—are very unfavorable, reflecting challenges in profitability and valuation compared to typical industry benchmarks.
Analysis of the company’s bankruptcy risk
Ford’s Altman Z-Score places it firmly in the distress zone, indicating a high risk of bankruptcy and financial instability:

Is the company in good financial health?
The Piotroski Score diagram below summarizes key financial strength indicators for Ford:

With a very weak Piotroski Score of 2, Ford exhibits poor financial health, signaling weak profitability, inefficient asset use, and potential liquidity concerns relative to stronger peers.
Competitive Landscape & Sector Positioning
This analysis covers Ford Motor Company’s strategic positioning, revenue segments, key products, and main competitors. I will assess whether Ford holds a competitive advantage over its industry peers.
Strategic Positioning
Ford Motor Company maintains a diversified product portfolio, including trucks, commercial cars, SUVs, and luxury vehicles under Ford and Lincoln brands. It operates multiple segments: Ford Blue, Model e, Pro, Next, and Ford Credit. Geographic exposure spans the US (122.6B in 2025), Canada (14.5B), the UK (12.3B), Mexico, and other regions totaling 35.4B, demonstrating a broad global footprint.
Revenue by Segment
This pie chart displays Ford Motor Company’s revenue distribution by segment for fiscal year 2025, highlighting the division between Ford Credit and the rest of the company.
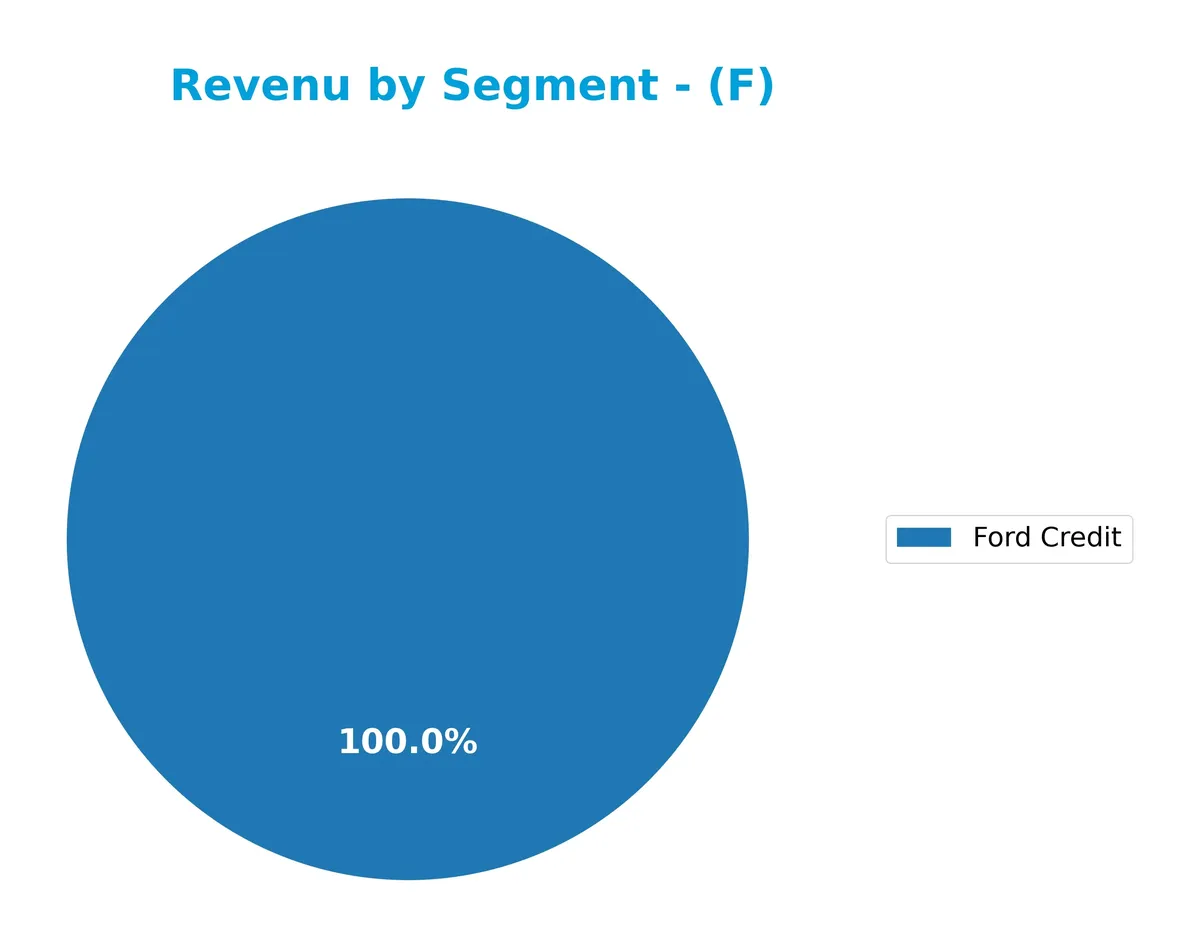
Ford Credit generated $13.3B in 2025, showing steady growth from $8.0B in 2011, while the remainder of the company reached $173B in 2024, illustrating the dominance of automotive and related operations. The company’s core excluding Ford Credit carries most revenue, but Ford Credit steadily increases its share, signaling diversification. The 2025 data reveals no new segments, concentrating risk primarily in automotive and financing.
Key Products & Brands
The following table summarizes Ford Motor Company’s main products, brands, and business segments:
| Product | Description |
|---|---|
| Ford Blue | Traditional Ford trucks, commercial cars, vans, and sport utility vehicles sold globally. |
| Ford Model e | Electric vehicle lineup under Ford, focusing on innovation and sustainability. |
| Ford Pro | Commercial vehicle services and solutions for fleet customers and businesses. |
| Lincoln | Luxury vehicle brand offering premium cars and SUVs worldwide. |
| Ford Credit | Vehicle-related financing, leasing, and dealer loans supporting retail and commercial customers. |
Ford’s business spans from manufacturing gasoline and electric vehicles to providing comprehensive financing solutions. The company balances volume sales with growing electric offerings and credit services.
Main Competitors
Ford Motor Company faces competition from 3 key players, with the table showing the top 3 leaders by market capitalization:
| Competitor | Market Cap. |
|---|---|
| Tesla, Inc. | 1.41T |
| General Motors Company | 75.5B |
| Ford Motor Company | 52.2B |
Ford ranks 3rd among its competitors, with a market cap just 3.84% of Tesla’s. It trades below both the average market cap of the top 10 (513B) and the sector median (75.5B). Ford maintains a 39.37% market cap gap below General Motors, its closest rival.
Comparisons with competitors
Check out how we compare the company to its competitors:
Does Ford have a competitive advantage?
Ford currently does not present a competitive advantage, as it is destroying value with ROIC well below WACC and a sharply declining profitability trend over 2021-2025. The company faces unfavorable income statement metrics, including negative net margins and shrinking earnings per share, which signal challenges in capital efficiency and value creation.
Looking ahead, Ford’s broad geographic reach, led by the U.S. market at 123B in revenue for 2025, offers opportunities for growth through product innovation and market expansion. Continued development in electric vehicles and commercial segments may provide avenues to improve margins and reverse the current unfavorable trends.
SWOT Analysis
This SWOT analysis highlights Ford Motor Company’s strategic position by identifying key internal and external factors affecting its performance.
Strengths
- Strong brand recognition
- Large global footprint with diversified markets
- Established dealer and financing network
Weaknesses
- Negative net margin and ROIC indicates value destruction
- High debt-to-equity ratio (4.54) increases financial risk
- Weak profitability metrics and declining EPS growth
Opportunities
- Growing electric vehicle market through Ford Model e
- Expansion in commercial fleet solutions
- Potential for operational improvements to boost margins
Threats
- Intense competition in auto manufacturing
- Technological disruption from new entrants
- Economic cycles affecting consumer demand
Ford faces severe profitability and leverage challenges, demanding strategic shifts to capture EV growth and improve capital efficiency. The company must manage financial risks prudently while navigating a volatile industry landscape.
Stock Price Action Analysis
The weekly stock chart below illustrates Ford Motor Company’s price movements over the past 12 months:
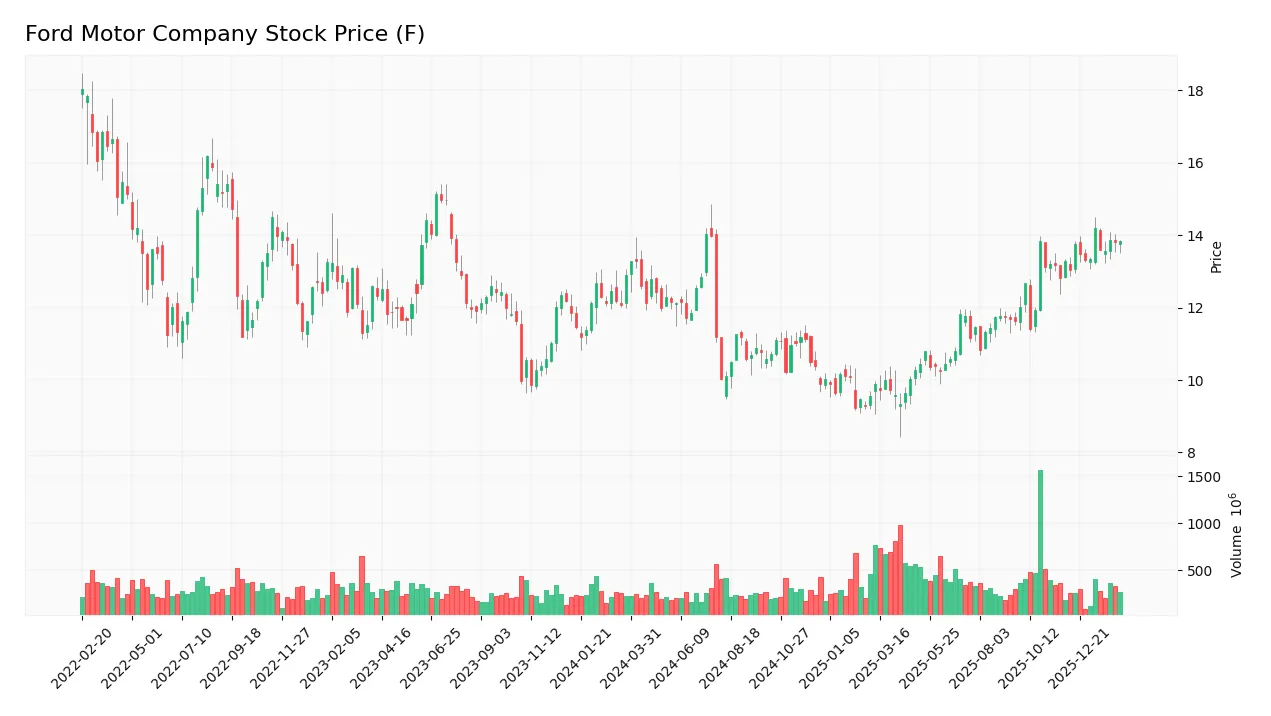
Trend Analysis
Ford’s stock price increased 7.28% over the past year, indicating a bullish trend with accelerating momentum. The price ranged between 9.24 and 14.2, showing moderate volatility with a standard deviation of 1.36. Recent months confirm continued upward slope and deceleration in volatility to 0.31.
Volume Analysis
Trading volume is increasing, with buyers slightly dominating at 52.07% over the last three months. Buyer activity remains neutral, suggesting balanced investor sentiment and stable market participation during this period.
Target Prices
Analysts set a target price consensus indicating moderate upside potential for Ford Motor Company.
| Target Low | Target High | Consensus |
|---|---|---|
| 12 | 16 | 13.19 |
The consensus target price range from $12 to $16 reflects cautious optimism about Ford’s near-term performance.

Don’t Let Luck Decide Your Entry Point
Optimize your entry points with our advanced ProRealTime indicators. You’ll get efficient buy signals with precise price targets for maximum performance. Start outperforming now!
Analyst & Consumer Opinions
This section examines Ford Motor Company’s recent analyst ratings and consumer feedback to gauge market sentiment and brand perception.
Stock Grades
Here are the latest verified stock grades from established financial institutions for Ford Motor Company:
| Grading Company | Action | New Grade | Date |
|---|---|---|---|
| RBC Capital | Maintain | Sector Perform | 2026-02-11 |
| Barclays | Maintain | Equal Weight | 2026-01-23 |
| JP Morgan | Maintain | Overweight | 2026-01-21 |
| UBS | Maintain | Neutral | 2026-01-14 |
| HSBC | Maintain | Hold | 2026-01-13 |
| TD Cowen | Maintain | Hold | 2026-01-13 |
| Piper Sandler | Upgrade | Overweight | 2026-01-08 |
| Evercore ISI Group | Maintain | In Line | 2025-12-22 |
| Morgan Stanley | Maintain | Equal Weight | 2025-12-08 |
| Evercore ISI Group | Maintain | In Line | 2025-11-24 |
Most analysts maintain a cautious stance, favoring hold or equal weight ratings. Piper Sandler stands out with an upgrade to overweight, signaling selective optimism.
Consumer Opinions
Ford Motor Company generates a mixed but passionate consumer sentiment reflecting its legacy and innovation efforts.
| Positive Reviews | Negative Reviews |
|---|---|
| Strong build quality with rugged design | Occasional reliability issues reported |
| Good value for price in the pickup segment | Infotainment system can be unintuitive |
| Impressive towing capacity and power | Fuel efficiency lags behind competitors |
Overall, consumers praise Ford’s robust performance and value, especially in trucks. However, some criticize its tech features and fuel economy, signaling areas needing improvement to maintain loyalty.
Risk Analysis
The table below summarizes key risks Ford Motor Company faces in 2026, highlighting probability and impact levels:
| Category | Description | Probability | Impact |
|---|---|---|---|
| Financial Health | Altman Z-Score of 0.86 signals high bankruptcy risk | High | Severe |
| Profitability | Negative net margin (-4.37%) and ROE (-22.76%) | High | Severe |
| Leverage | Debt-to-equity ratio of 4.54 indicates heavy debt | High | High |
| Liquidity | Current ratio of 1.07 and quick ratio 0.94 are weak | Medium | Moderate |
| Interest Coverage | Zero interest coverage signals inability to pay debt | High | Severe |
| Market Volatility | Beta of 1.666 means stock is highly sensitive | High | Moderate |
Ford’s most alarming risks are its financial distress signals and poor profitability. The Altman Z-Score places it in the distress zone, implying a real bankruptcy threat. Heavy debt and zero interest coverage compound this danger. Investors must weigh these risks carefully against the company’s market position.
Should You Buy Ford Motor Company?
Ford appears to be shedding value with declining profitability and a very unfavorable moat profile. Despite manageable liquidity, its leverage profile and operational efficiency suggest challenges ahead. The overall rating of C- reflects a cautious analytical interpretation.
Strength & Efficiency Pillars
Ford Motor Company’s operational margins remain weak, with a net margin of -4.37% and ROIC at -2.73%. These figures underscore ongoing profitability challenges. The weighted average cost of capital (WACC) stands at a favorable 7.17%, but ROIC falling below WACC signals value destruction rather than creation. While the company struggles to generate returns above its capital cost, some stability is reflected in a neutral current ratio of 1.07 and a dividend yield of 5.73%, offering modest income potential despite operational headwinds.
Weaknesses and Drawbacks
Ford is in financial distress, with an Altman Z-Score of 0.86 firmly in the Distress Zone, signaling a high bankruptcy risk. Its debt-to-equity ratio of 4.54 is alarmingly high, indicating excessive leverage that compounds solvency concerns. Interest coverage is effectively zero, reflecting difficulty servicing debt costs. Valuation metrics show a mixed picture: a negative P/E of -6.38 and a price-to-book ratio of 1.45, which may signal market skepticism. These factors create a precarious financial structure and elevate the risk profile significantly.
Our Final Verdict about Ford Motor Company
Despite a bullish price trend and acceleration in stock momentum, Ford’s distressed financial condition, as evidenced by its Altman Z-Score of 0.86, renders the investment highly speculative. Operational weaknesses and severe leverage issues overshadow any positive price action. This profile suggests a risky proposition, especially for conservative investors who prioritize solvency and stable returns. Caution is warranted before considering exposure.
Disclaimer: This content is for informational purposes only and does not constitute financial, investment, or other professional advice. Investing in financial markets involves a significant risk of loss, and past performance is not indicative of future results.
Additional Resources
- Ford reports worst quarterly earnings miss in four years, guides for better 2026 – CNBC (Feb 10, 2026)
- Ford eyes offering more affordable models in the next few years (F:NYSE) – Seeking Alpha (Feb 11, 2026)
- Ford Shares In Focus Ahead Of Q4 Earnings Report – Benzinga (Feb 10, 2026)
- Ford Motor Company (F) Deep Dive: Navigating the Hybrid Pivot and the Future of Ford Pro – FinancialContent (Feb 11, 2026)
- ProShare Advisors LLC Boosts Holdings in Ford Motor Company $F – MarketBeat (Feb 11, 2026)
For more information about Ford Motor Company, please visit the official website: ford.com