Home > Analyses > Technology > Fiserv, Inc.
Fiserv, Inc. powers the financial transactions that drive daily commerce for millions worldwide. Its cutting-edge payment platforms, from Clover’s cloud-based point-of-sale systems to advanced fraud protection, shape how businesses and consumers interact with money. As a technology titan in fintech services, Fiserv combines innovation with scale to maintain industry leadership. The key question now: does its current valuation reflect sustainable growth amid evolving digital finance trends?

Table of contents
Business Model & Company Overview
Fiserv, Inc. is a leading player in the Information Technology Services sector, founded in 1984 and headquartered in Milwaukee, Wisconsin. It operates a cohesive ecosystem spanning payment technology and financial services. The company integrates merchant acquiring, digital commerce, and cloud-based platforms to streamline transactions and business management globally. With 38K employees and a market cap of $33B, Fiserv commands a strong foothold in its industry.
The company’s revenue engine balances hardware, software, and recurring services across three core segments: Acceptance, Fintech, and Payments. Its solutions power transactions for merchants, banks, and financial institutions across the Americas, Europe, and Asia. Fiserv’s strategic global presence and diversified offerings form a robust economic moat, positioning it as a vital architect of the future digital payments landscape.
Financial Performance & Fundamental Metrics
I analyze Fiserv, Inc.’s income statement, key financial ratios, and dividend payout policy to assess its profitability, efficiency, and shareholder returns.
Income Statement
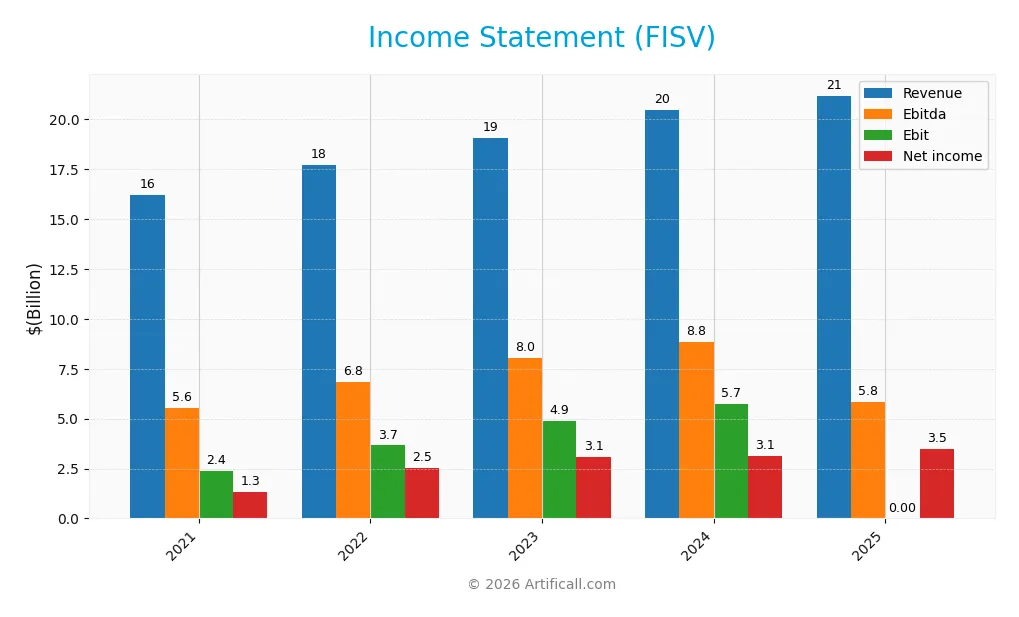
The table below summarizes Fiserv, Inc.’s annual income statement figures from 2021 through 2025, showing key profitability and expense metrics in USD.
| 2021 | 2022 | 2023 | 2024 | 2025 | |
|---|---|---|---|---|---|
| Revenue | 16.2B | 17.7B | 19.1B | 20.5B | 21.2B |
| Cost of Revenue | 8.1B | 8.0B | 7.7B | 8.0B | 8.6B |
| Operating Expenses | 5.8B | 6.0B | 6.4B | 6.6B | 6.9B |
| Gross Profit | 8.1B | 9.7B | 11.4B | 12.4B | 12.6B |
| EBITDA | 5.6B | 6.8B | 8.0B | 8.8B | 8.9B |
| EBIT | 2.4B | 3.7B | 4.9B | 5.7B | 5.8B |
| Interest Expense | 696M | 746M | 1.0B | 1.2B | 1.5B |
| Net Income | 1.3B | 2.5B | 3.1B | 3.1B | 3.5B |
| EPS | 2.01 | 3.94 | 5.02 | 5.41 | 6.34 |
| Filing Date | 2022-02-24 | 2023-02-23 | 2024-02-22 | 2025-02-20 | 2026-02-19 |
Income Statement Evolution
Fiserv’s revenue rose steadily from $16.2B in 2021 to $21.2B in 2025, a 30.6% increase. Net income surged 161% to $3.48B, reflecting strong profitability gains. Margins improved significantly, with gross margin at 59.4% and net margin at 16.4%, indicating enhanced cost control and pricing power over this period.
Is the Income Statement Favorable?
In 2025, Fiserv posted $21.2B revenue, growing 3.6% year-on-year, while EBITDA and EBIT margins held steady near 42% and 27%, respectively. Despite a 7% rise in operating expenses relative to revenue, net margin expanded 7.3%, supported by effective tax management. Interest expense at 7% of revenue remains neutral, making the overall income statement fundamentals favorable.
Financial Ratios
Below is a summary of key financial ratios for Fiserv, Inc. over the past five fiscal years:
| Ratios | 2021 | 2022 | 2023 | 2024 | 2025 |
|---|---|---|---|---|---|
| Net Margin | 8.2% | 14.3% | 16.1% | 15.3% | 16.4% |
| ROE | 4.3% | 8.2% | 10.3% | 11.6% | 13.5% |
| ROIC | 3.1% | 5.3% | 6.9% | 8.7% | 8.0% |
| P/E | 51.6 | 25.7 | 26.5 | 38.0 | 10.6 |
| P/B | 2.2 | 2.1 | 2.7 | 4.4 | 1.4 |
| Current Ratio | 1.03 | 1.04 | 1.04 | 1.06 | 1.03 |
| Quick Ratio | 1.03 | 1.04 | 1.04 | 1.06 | 1.03 |
| D/E | 0.69 | 0.70 | 0.80 | 0.92 | 1.12 |
| Debt-to-Assets | 27.9% | 25.7% | 26.3% | 32.3% | 36.2% |
| Interest Coverage | 3.3 | 5.0 | 5.0 | 4.7 | 3.8 |
| Asset Turnover | 0.21 | 0.21 | 0.21 | 0.27 | 0.26 |
| Fixed Asset Turnover | 9.3 | 9.1 | 6.8 | 8.6 | 6.9 |
| Dividend Yield | 0.0% | 0.0% | 0.0% | 0.0% | 0.0% |
Evolution of Financial Ratios
From 2021 to 2025, Fiserv’s Return on Equity (ROE) improved steadily, reaching 13.5% in 2025. The Current Ratio remained stable around 1.03, indicating consistent liquidity. However, the Debt-to-Equity Ratio rose to 1.12 by 2025, signaling increased leverage. Profitability margins strengthened modestly, reflecting gradual operational improvements.
Are the Financial Ratios Favorable?
Fiserv’s 2025 profitability is favorable with a 16.4% net margin and a return on invested capital exceeding the 5.8% WACC, indicating value creation. Liquidity ratios are neutral to favorable, while leverage metrics like debt-to-equity at 1.12 appear unfavorable. Asset turnover is weak, but fixed asset turnover is strong. Overall, ratios are slightly favorable, balancing growth with rising debt concerns.
Shareholder Return Policy
Fiserv, Inc. does not pay dividends, reflecting its focus on reinvestment and growth rather than immediate shareholder payouts. The company does not disclose share buyback programs, indicating an emphasis on capital allocation towards operational expansion and innovation.
This approach aligns with sustainable long-term value creation by prioritizing free cash flow reinvestment. Given Fiserv’s stable profit margins and positive net income per share, this policy supports enduring shareholder wealth without the risks of unsustainable distributions.
Score analysis
The following radar chart illustrates the company’s key valuation and financial performance scores:
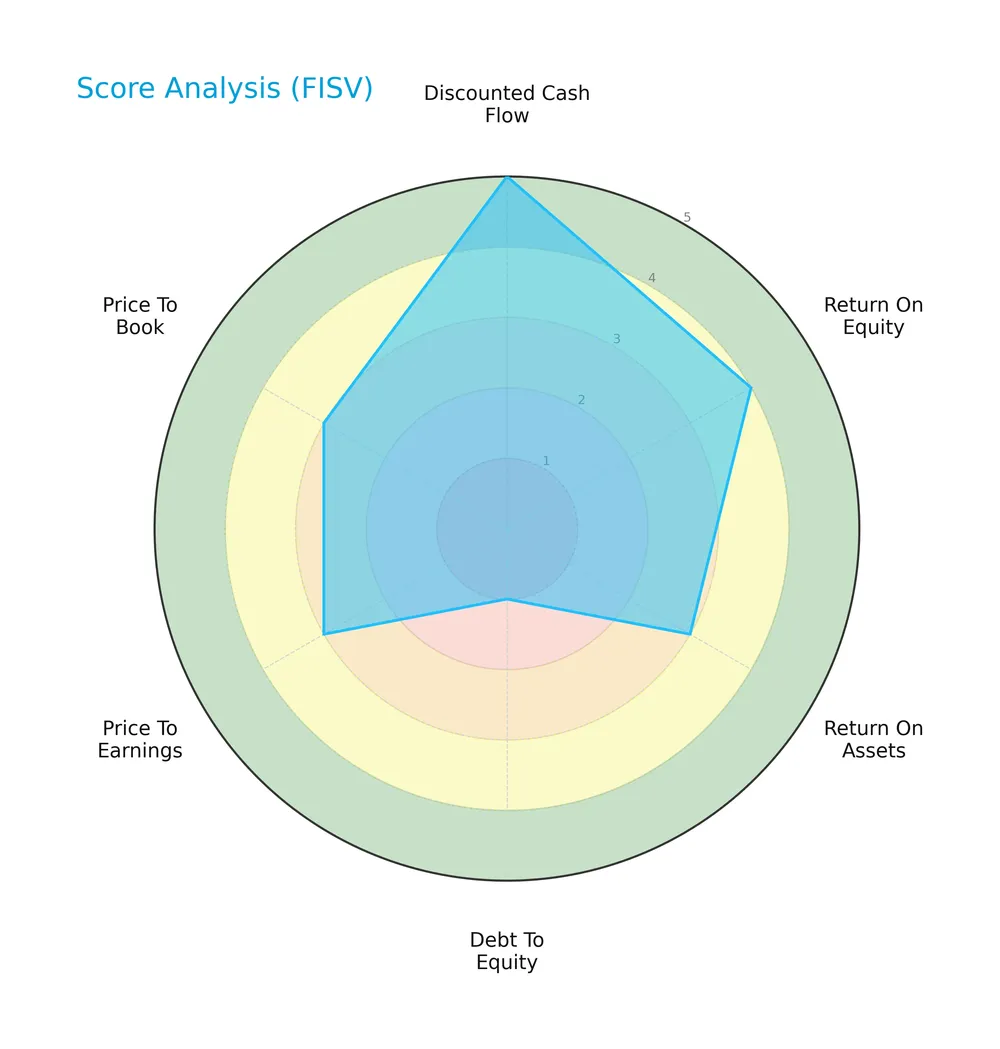
Fiserv scores very favorably in discounted cash flow and well in return on equity, price-to-earnings, and price-to-book ratios. However, its debt-to-equity score is very unfavorable, signaling high leverage risk. Return on assets is moderate.
Analysis of the company’s bankruptcy risk
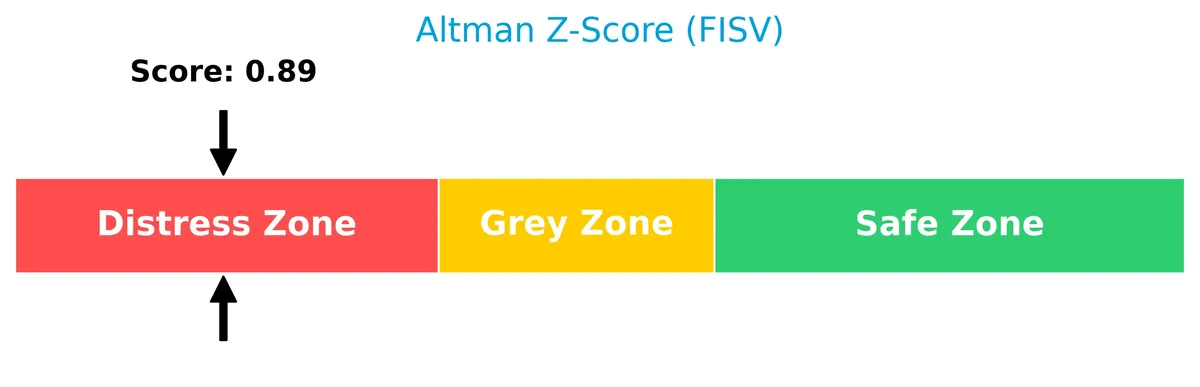
The Altman Z-Score places the company in the distress zone, indicating a high risk of financial distress and potential bankruptcy:
Is the company in good financial health?
The Piotroski Score diagram below shows the company’s financial strength based on nine criteria:

With a Piotroski Score of 6, the company’s financial health is average, reflecting moderate profitability and efficiency but room for improvement in balance sheet strength.
Competitive Landscape & Sector Positioning
This section analyzes Fiserv, Inc.’s strategic positioning, revenue segments, key products, and main competitors. I will evaluate whether Fiserv holds a competitive advantage within the information technology services sector.
Strategic Positioning
Fiserv, Inc. operates a diversified product portfolio across Acceptance, Fintech, and Payments segments, generating multi-billion revenues. It serves global markets with a strong U.S. focus, reflecting broad technological solutions in payment and financial services but with limited geographic revenue diversification outside the U.S.
Revenue by Segment
This pie chart illustrates Fiserv, Inc.’s revenue distribution by business segment for the fiscal year 2024, highlighting the relative contributions of its main operational areas.
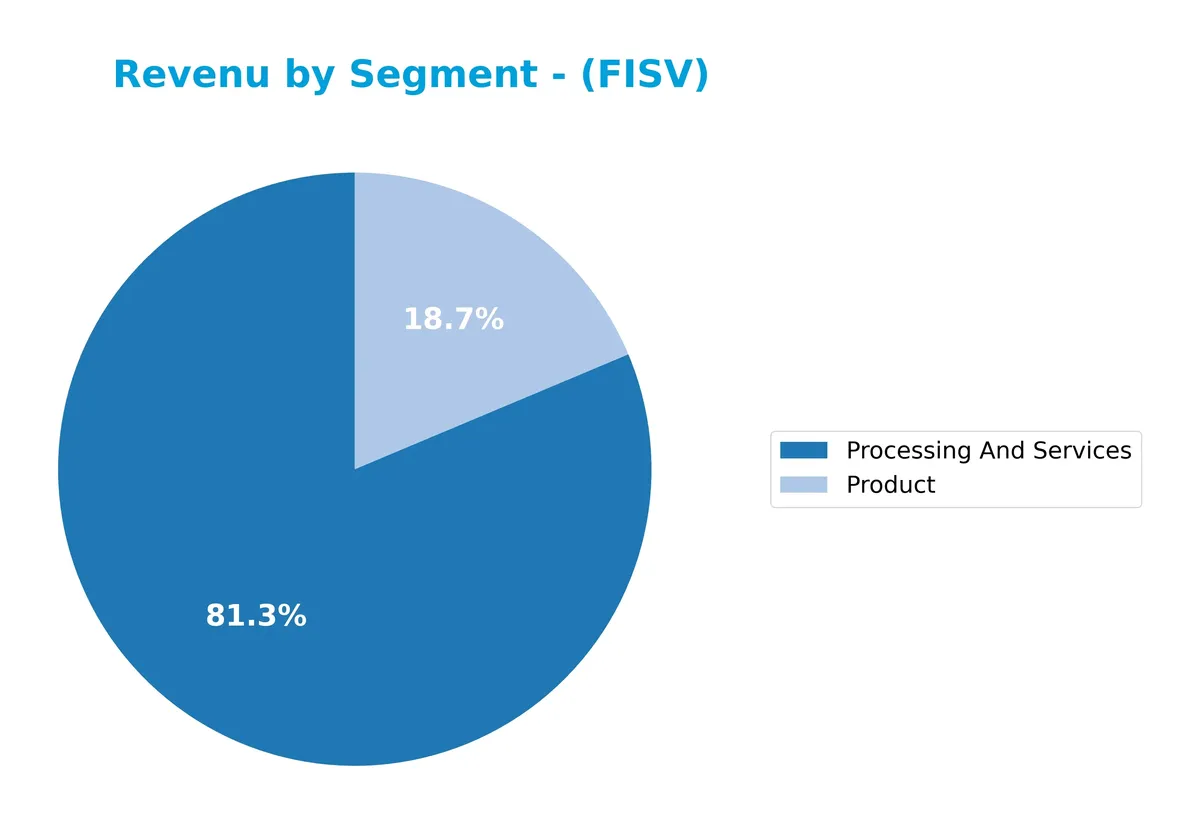
In 2024, Processing And Services dominate Fiserv’s revenue with $16.6B, reflecting its core strength in transaction processing. The Product segment contributes $3.8B, showing a smaller yet significant role. Compared to prior years, the data reveals a concentration in processing services, signaling potential exposure to industry shifts but also affirming Fiserv’s moat in scalable payment infrastructure. The absence of more diversified segment data limits visibility on emerging growth drivers.
Key Products & Brands
The table below details Fiserv’s key products and brands across its major business segments:
| Product | Description |
|---|---|
| Acceptance Segment | Point-of-sale merchant acquiring, digital commerce services, mobile payments, and fraud protection. Includes Carat omnichannel and Clover POS platforms. |
| Fintech Segment | Customer deposit and loan accounts, digital banking, financial and risk management, and consulting services. Manages general ledger and central info files. |
| Payments Segment | Debit, credit, prepaid card processing, card production, print services, and non-card digital payment software like bill pay and person-to-person transfers. |
| Hardware, Print, and Card Production | Physical card manufacturing, printing, and postage output solutions supporting payment services. |
| Professional Services | Consulting and implementation services supporting clients’ technology and payment infrastructure. |
| Software Maintenance | Ongoing support and updates for Fiserv’s software products. |
| License and Termination Fees | Revenue from software licensing agreements and contract terminations. |
Fiserv’s portfolio spans technology-driven payment processing, fintech solutions, and card production. Its brands like Clover and Carat underpin a diverse revenue base across merchant services, financial institutions, and corporate clients.
Main Competitors
The sector includes 16 competitors, with the table listing the top 10 leaders by market capitalization:
| Competitor | Market Cap. |
|---|---|
| International Business Machines Corporation | 272B |
| Accenture plc | 162B |
| Cognizant Technology Solutions Corporation | 40B |
| Fiserv, Inc. | 36B |
| Fidelity National Information Services, Inc. | 34B |
| Wipro Limited | 30B |
| Leidos Holdings, Inc. | 23B |
| Gartner, Inc. | 18B |
| CDW Corporation | 17B |
| Jack Henry & Associates, Inc. | 13B |
Fiserv ranks 4th among its competitors, with a market cap just 12.26% of the leader, IBM. The company sits below the average market cap of the top 10 (64.6B) but remains above the median for the sector (17.8B). It holds a significant 19.56% market cap gap above its nearest competitor, indicating a solid competitive cushion.
Comparisons with competitors
Check out how we compare the company to its competitors:
Does Fiserv have a competitive advantage?
Fiserv demonstrates a sustainable competitive advantage, evidenced by an ROIC exceeding WACC by over 2.2%, signaling efficient capital use and consistent value creation. Its growing ROIC trend further confirms increasing profitability and a very favorable moat status.
Looking ahead, Fiserv’s diverse segments—Acceptance, Fintech, and Payments—position it well to leverage expanding digital commerce and payment technologies. Opportunities in omnichannel solutions and cloud-based platforms support its potential for growth in established and emerging markets.
SWOT Analysis
This analysis highlights Fiserv, Inc.’s strategic position by identifying key internal and external factors affecting its performance.
Strengths
- strong gross margin at 59%
- favorable EBIT margin of 27%
- growing ROIC well above WACC
- robust net margin growth over 5 years
- very favorable moat indicating sustainable advantage
Weaknesses
- high debt-to-equity ratio signals leverage risk
- Altman Z-score in distress zone warns financial fragility
- asset turnover is low, indicating efficiency issues
Opportunities
- expanding fintech and digital payments markets
- growth potential in emerging markets
- innovation in cloud-based solutions and security products
Threats
- intense competition in financial technology
- regulatory changes in payment processing
- economic downturn affecting client spending
Fiserv’s strengths in profitability and competitive moat underpin a solid foundation. However, high leverage and financial distress signals require caution. The company must leverage growth opportunities while managing regulatory and competitive risks to sustain its value creation.
Stock Price Action Analysis
The weekly stock chart below illustrates Fiserv, Inc. (FISV) price movements over the past 12 months, highlighting key support and resistance levels:
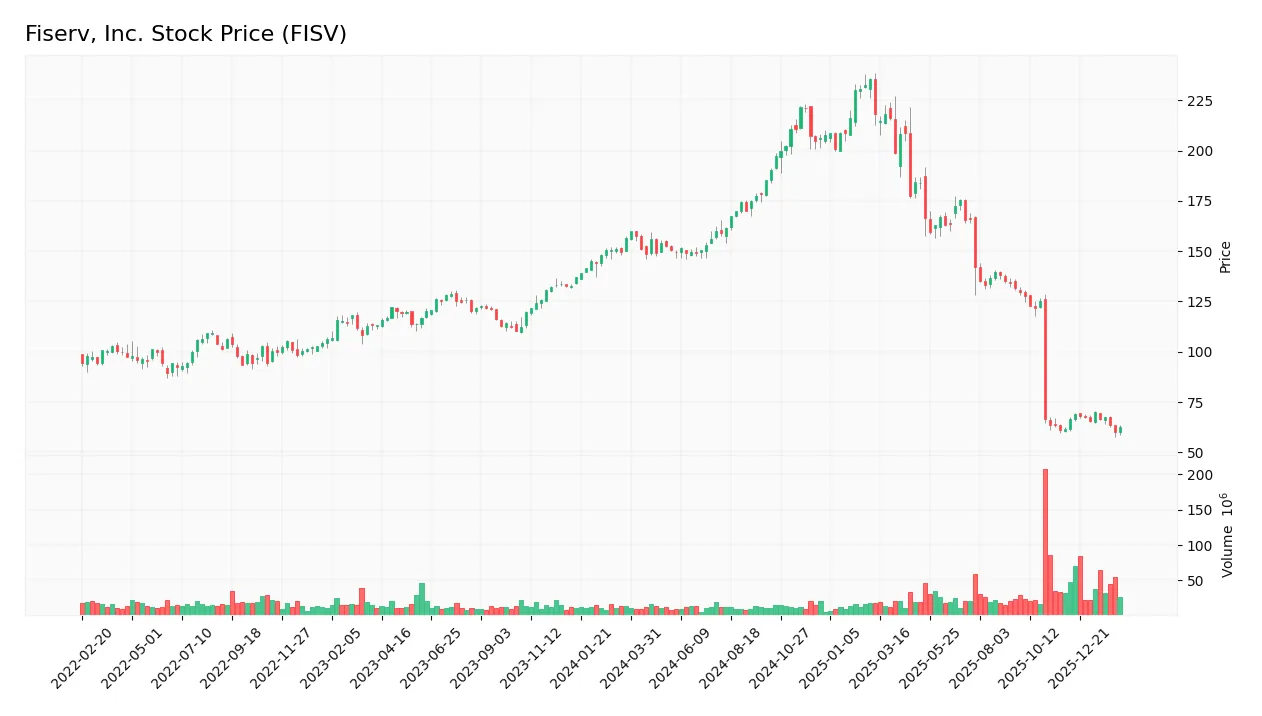
Trend Analysis
Fiserv’s stock declined sharply by 61.54% over the past year, confirming a bearish trend with accelerating downward momentum. The highest price reached 235.69, while the lowest dropped to 59.36, reflecting significant volatility with a 49.77 standard deviation. Recent two-month data show a continued moderate decline of 7.26%.
Volume Analysis
Trading volume has increased over the last three months, with sellers dominating at 61%. Buyer participation dropped to 39%, signaling bearish investor sentiment and intensified selling pressure during this period.
Target Prices
Analysts present a wide target price range for Fiserv, Inc., reflecting diverse outlooks but a moderate consensus near current valuations.
| Target Low | Target High | Consensus |
|---|---|---|
| 62 | 180 | 104.18 |
The target prices suggest cautious optimism with upside potential balanced by significant downside risk. Investors should weigh this spread carefully.

Don’t Let Luck Decide Your Entry Point
Optimize your entry points with our advanced ProRealTime indicators. You’ll get efficient buy signals with precise price targets for maximum performance. Start outperforming now!
Analyst & Consumer Opinions
This section examines recent analyst grades and consumer feedback to provide insights on Fiserv, Inc.’s market perception.
Stock Grades
The latest analyst grades for Fiserv, Inc. demonstrate a cautious but generally positive outlook from reputable firms:
| Grading Company | Action | New Grade | Date |
|---|---|---|---|
| UBS | Maintain | Neutral | 2026-02-11 |
| Stephens & Co. | Maintain | Equal Weight | 2026-02-11 |
| B. Riley Securities | Maintain | Neutral | 2026-02-11 |
| Citigroup | Maintain | Neutral | 2026-02-11 |
| Tigress Financial | Maintain | Buy | 2025-12-31 |
| Mizuho | Maintain | Outperform | 2025-12-22 |
| Truist Securities | Downgrade | Hold | 2025-10-30 |
| RBC Capital | Maintain | Outperform | 2025-10-30 |
| Goldman Sachs | Downgrade | Neutral | 2025-10-30 |
| JP Morgan | Maintain | Overweight | 2025-10-30 |
Grades show a mix of Neutral and Buy/Outperform ratings, with some recent downgrades reflecting caution. The consensus remains a Buy, indicating moderate confidence despite measured reservations.
Consumer Opinions
Consumers express a mix of enthusiasm and frustration toward Fiserv, reflecting the company’s complex service landscape.
| Positive Reviews | Negative Reviews |
|---|---|
| Reliable payment processing with minimal downtime. | Customer support response times are often slow. |
| User-friendly mobile app enhances transaction ease. | Occasional glitches in online account management. |
| Strong security features reassure users. | Some fees are not clearly communicated upfront. |
Overall, customers praise Fiserv’s security and usability but consistently flag support delays and unclear fee structures as areas needing improvement. This feedback suggests operational execution gaps despite solid product foundations.
Risk Analysis
Below is a table summarizing key risks Fiserv, Inc. faces, with their likelihood and potential impact:
| Category | Description | Probability | Impact |
|---|---|---|---|
| Financial Health | Altman Z-Score signals distress zone, indicating bankruptcy risk | High | High |
| Leverage | High debt-to-equity ratio (1.12) raises refinancing concerns | Medium | Medium |
| Market Volatility | Stock price volatility with a wide trading range (57.8-238.59) | Medium | Medium |
| Profitability | ROIC (8.04%) barely exceeds WACC (5.83%), limiting economic profit | Medium | Medium |
| Liquidity | Current ratio near 1.03 signals tight short-term liquidity | Medium | Low |
| Dividend Policy | No dividend payout may deter income-focused investors | Low | Low |
Fiserv’s most pressing risk is financial distress, as its Altman Z-Score (0.88) lies deep in the distress zone. Coupled with an unfavorable debt-to-equity ratio, refinancing pressures could intensify if interest rates rise. Profitability margins remain modest, suggesting limited buffer against economic shocks.
Should You Buy Fiserv, Inc.?
Fiserv, Inc. appears to be a profitable company with a durable competitive moat, demonstrated by its growing ROIC and value creation above WACC. Despite a very unfavorable debt profile and Altman Z-score in the distress zone, its overall A- rating suggests a cautiously favorable investment outlook.
Strength & Efficiency Pillars
Fiserv, Inc. demonstrates solid operational efficiency with a net margin of 16.42% and an EBIT margin of 27.16%. Its return on equity stands at a moderate 13.49%, while the return on invested capital (ROIC) of 8.04% comfortably exceeds its weighted average cost of capital (WACC) at 5.83%. This confirms Fiserv as a value creator, generating returns above its capital cost. The company’s growing ROIC trend further signals a sustainable competitive advantage and improving profitability.
Weaknesses and Drawbacks
Fiserv is currently in financial distress, reflected by an Altman Z-Score of 0.88, indicating a high bankruptcy risk. This solvency concern overshadows its profitability. Additionally, leverage is a significant risk with a debt-to-equity ratio of 1.12, rated very unfavorable, and a thin current ratio at 1.03, limiting liquidity buffers. The stock’s bearish trend, with a 61.5% price decline overall and seller dominance (39% buyers recently), adds further market pressure and short-term headwinds.
Our Final Verdict about Fiserv, Inc.
Despite its operational strengths and clear value creation, Fiserv’s distressed financial condition makes its investment profile highly speculative. The risk of insolvency outweighs favorable margins and long-term competitive advantages. Investors seeking conservative capital preservation may find the profile too risky. A cautious stance remains prudent until solvency metrics improve and market sentiment stabilizes.
Disclaimer: This content is for informational purposes only and does not constitute financial, investment, or other professional advice. Investing in financial markets involves a significant risk of loss, and past performance is not indicative of future results.
Additional Resources
- UBS Lowers its Price Target on Fiserv, Inc. (FISV) to $70 and Maintains a Neutral Rating – Yahoo Finance (Feb 21, 2026)
- ANTIPODES PARTNERS Ltd Invests $16.46 Million in Fiserv, Inc. $FISV – MarketBeat (Feb 21, 2026)
- Fiserv Reports Fourth Quarter and Full Year 2025 Results – Fiserv (Feb 10, 2026)
- Fiserv stock jumps on report of Jana Partners building stake, pushing for changes (FISV:NASDAQ) – Seeking Alpha (Feb 17, 2026)
- Exclusive | Activist Jana Builds Stake in Payments Business Fiserv – The Wall Street Journal (Feb 17, 2026)
For more information about Fiserv, Inc., please visit the official website: fiserv.com