Home > Analyses > Utilities > FirstEnergy Corp.
FirstEnergy powers millions across six states, fueling homes and businesses with diverse energy sources. It commands a vast network spanning 24,000+ transmission miles and nearly 274,000 distribution miles, blending traditional and renewable power. Known for operational reliability and steady dividends, it stands as a pillar in the regulated electric sector. As the energy landscape shifts, I ask: does FirstEnergy’s current strategy and asset base position it well for sustainable growth and shareholder value?

Table of contents
Business Model & Company Overview
FirstEnergy Corp., founded in 1996 and headquartered in Akron, Ohio, stands as a dominant player in the regulated electric industry. It operates a cohesive energy ecosystem spanning coal, nuclear, hydroelectric, natural gas, wind, and solar generation. The company manages an extensive network of transmission and distribution lines, serving roughly 6M customers across six key states, reflecting its integrated utility presence.
The company’s revenue engine balances regulated transmission and distribution services, providing steady cash flows from essential electricity delivery. Its geographic reach covers the Americas with a stronghold in Ohio, Pennsylvania, and neighboring states, underpinning stable demand. FirstEnergy’s economic moat arises from its vast infrastructure and regulatory framework, positioning it as a cornerstone shaping the U.S. energy landscape.
Financial Performance & Fundamental Metrics
I will analyze FirstEnergy Corp.’s income statement, key financial ratios, and dividend payout policy to reveal its core financial health and shareholder value approach.
Income Statement
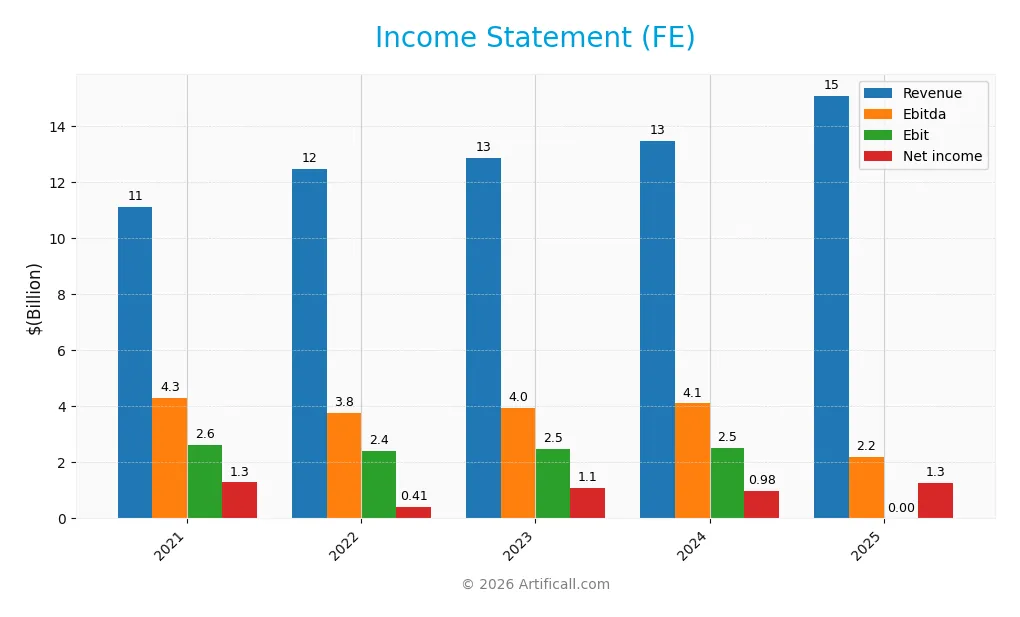
The table below summarizes FirstEnergy Corp.’s key income statement figures for fiscal years 2021 through 2025, showing revenue trends and profitability metrics.
| 2021 | 2022 | 2023 | 2024 | 2025 | |
|---|---|---|---|---|---|
| Revenue | 11.1B | 12.5B | 12.9B | 13.5B | 15.1B |
| Cost of Revenue | 3.4B | 4.6B | 4.6B | 4.4B | 5.2B |
| Operating Expenses | 6.0B | 6.0B | 6.0B | 6.7B | 12.9B |
| Gross Profit | 7.7B | 7.9B | 8.2B | 9.1B | 9.9B |
| EBITDA | 4.3B | 3.8B | 4.0B | 4.1B | 2.2B |
| EBIT | 2.6B | 2.4B | 2.5B | 2.5B | 0.0B |
| Interest Expense | 1.1B | 955M | 1.0B | 1.0B | 1.2B |
| Net Income | 1.3B | 406M | 1.1B | 978M | 1.3B |
| EPS | 2.35 | 0.71 | 1.92 | 1.70 | 1.77 |
| Filing Date | 2022-02-16 | 2023-02-13 | 2024-02-13 | 2025-02-27 | 2026-02-18 |
Income Statement Evolution
FirstEnergy’s revenue rose 36% from 2021 to 2025, with a notable 12% increase in 2025 alone. Gross margin improved to 65.3%, reflecting efficient cost control. However, net income declined slightly over the period, dragging net margin down 27%. Operating expenses grew in line with revenue, pressuring EBIT, which fell sharply in 2025 to zero.
Is the Income Statement Favorable?
In 2025, revenue grew 12% to $15.1B and gross profit increased 8%, supporting a solid 65% gross margin. Despite zero EBIT, net margin improved to 8.4%, aided by favorable interest expense ratios. EPS grew 3.5% to $1.77. While EBIT’s collapse signals operational strain, the overall fundamentals remain generally favorable given top-line strength and margin resilience.
Financial Ratios
The table below summarizes key financial ratios for FirstEnergy Corp. over the past five fiscal years, providing insights into profitability, leverage, liquidity, and valuation:
| Ratios | 2021 | 2022 | 2023 | 2024 | 2025 |
|---|---|---|---|---|---|
| Net Margin | 11.53% | 3.26% | 8.56% | 7.26% | 8.42% |
| ROE | 14.79% | 3.99% | 10.56% | 7.85% | 10.16% |
| ROIC | 3.22% | 1.37% | 4.08% | 3.66% | 44.25% |
| P/E | 17.67 | 58.98 | 19.06 | 23.39 | 20.32 |
| P/B | 2.61 | 2.36 | 2.01 | 1.84 | 2.06 |
| Current Ratio | 0.73 | 0.61 | 0.48 | 0.56 | 0.00 |
| Quick Ratio | 0.67 | 0.50 | 0.38 | 0.45 | 0.00 |
| D/E | 2.75 | 2.13 | 2.39 | 1.95 | 2.10 |
| Debt-to-Assets | 52.50% | 47.00% | 51.08% | 46.63% | 46.92% |
| Interest Coverage | 1.62 | 2.00 | 2.21 | 2.35 | -1.81 |
| Asset Turnover | 0.25 | 0.27 | 0.26 | 0.26 | 0.27 |
| Fixed Asset Turnover | 0.32 | 0.34 | 0.34 | 0.33 | 0.00 |
| Dividend Yield | 3.75% | 3.72% | 4.31% | 4.24% | 3.93% |
Evolution of Financial Ratios
From 2021 to 2025, FirstEnergy’s Return on Equity (ROE) fluctuated, peaking at 14.79% in 2021 before settling at 10.16% in 2025. The Current Ratio steadily declined, reaching an alarming 0.002 in 2025, indicating deteriorating liquidity. Debt-to-Equity Ratio remained high and volatile, ending at 2.1 in 2025, reflecting sustained leverage pressure. Profitability showed mixed trends, with net margins hovering near 8%.
Are the Financial Ratios Favorable?
In 2025, FirstEnergy’s profitability is neutral with ROE at 10.16% and net margin at 8.42%. Liquidity ratios are unfavorable, with a critically low current ratio near zero. Leverage remains high, evidenced by a debt-to-equity ratio of 2.1 and negative interest coverage. Efficiency metrics like asset turnover are also weak. Dividend yield at 3.93% stands out favorably. Overall, the ratios skew slightly unfavorable.
Shareholder Return Policy
FirstEnergy Corp. maintains a dividend payout ratio near 80%, with a dividend yield around 3.9%. Dividend per share has steadily increased, supported by free cash flow coverage and complemented by ongoing share buybacks.
This payout strategy balances distributions with capital returns, reflecting prudent management amid moderately leveraged financials. It supports sustainable long-term shareholder value, though high payout ratios warrant monitoring for cash flow consistency.
Score analysis
The following radar chart displays FirstEnergy Corp.’s key financial scores across valuation and profitability metrics:
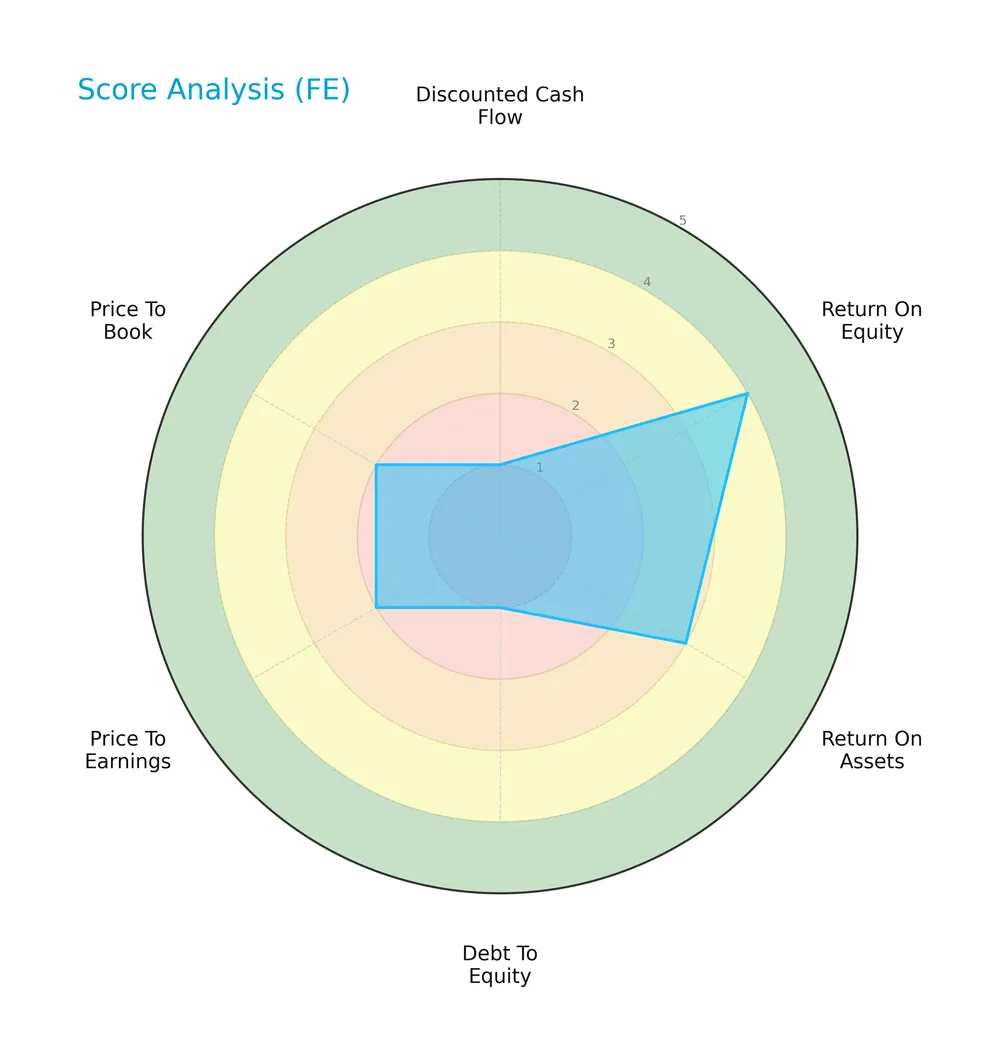
FirstEnergy scores poorly on discounted cash flow and debt-to-equity, indicating financial stress. Return on equity is strong, while return on assets is moderate. Valuation metrics (PE and PB) remain unfavorable, suggesting market caution.
Analysis of the company’s bankruptcy risk
FirstEnergy’s Altman Z-Score places it in the distress zone, signaling a high risk of bankruptcy based on its financial ratios:

Is the company in good financial health?
The Piotroski Score diagram highlights FirstEnergy’s financial health with a moderate rating:

With a score of 6, the company shows average financial strength. This suggests some operational and profitability stability but leaves room for improvement in financial robustness.
Competitive Landscape & Sector Positioning
This section examines FirstEnergy Corp.’s strategic positioning, revenue breakdown, key products, and main competitors. I will assess whether the company holds a competitive advantage within the regulated electric utilities sector.
Strategic Positioning
FirstEnergy Corp. concentrates its operations in the US, serving about 6M customers across six states. Its revenue derives primarily from regulated distribution (~7.5B in 2025) and transmission (~1.9B), reflecting a focused portfolio within regulated electric utilities.
Revenue by Segment
The pie chart illustrates FirstEnergy Corp.’s revenue breakdown by segment for fiscal year 2025, highlighting the relative contributions of regulated distribution and transmission.
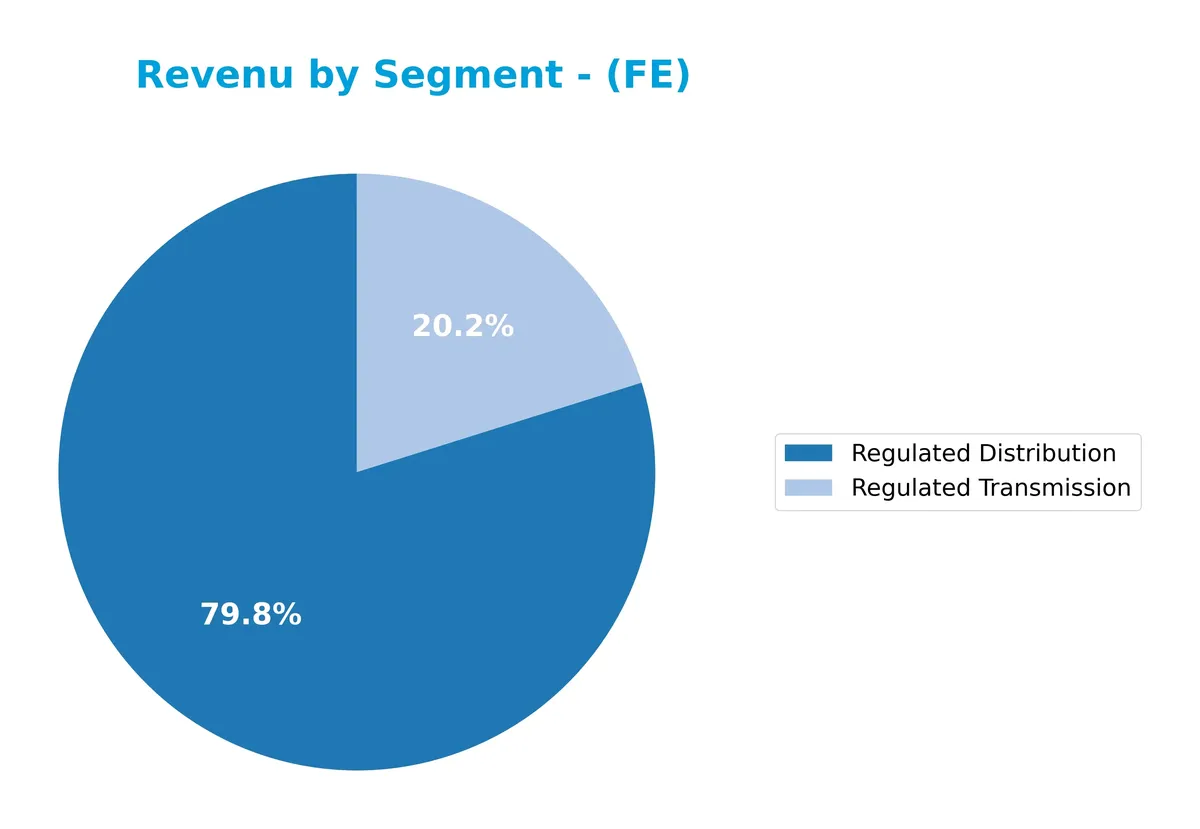
Regulated Distribution dominates with $7.55B, reflecting its core role in FirstEnergy’s business model. Regulated Transmission contributes $1.91B, showing steady support but less scale. Compared to prior years, Distribution revenue accelerated from $6.86B in 2024 to $7.55B in 2025, signaling growth in the regulated utility base. Transmission revenue also increased modestly, maintaining a balanced but concentrated segment mix. Risk remains moderate due to reliance on regulated segments.
Key Products & Brands
The table below outlines FirstEnergy Corp.’s primary products and services as of the latest fiscal year:
| Product | Description |
|---|---|
| Regulated Distribution | Electricity distribution services across Ohio, Pennsylvania, West Virginia, Maryland, New Jersey, and New York. |
| Regulated Transmission | Operation and maintenance of electric transmission lines spanning 24,074 circuit miles. |
FirstEnergy Corp. focuses on regulated electric distribution and transmission. It serves approximately 6M customers, operating extensive infrastructure across six U.S. states. These core segments drive the majority of its revenue, reflecting its utility sector positioning.
Main Competitors
The sector includes 23 competitors, with the table showing the top 10 leaders by market capitalization:
| Competitor | Market Cap. |
|---|---|
| NextEra Energy, Inc. | 169B |
| The Southern Company | 96B |
| Duke Energy Corporation | 91B |
| American Electric Power Company, Inc. | 62B |
| Dominion Energy, Inc. | 51B |
| Exelon Corporation | 44B |
| Xcel Energy Inc. | 44B |
| Entergy Corporation | 42B |
| Public Service Enterprise Group Incorporated | 40B |
| Consolidated Edison, Inc. | 36B |
FirstEnergy Corp. ranks 15th among 23 competitors. Its market cap is 16.8% of NextEra Energy’s, the sector leader. FirstEnergy sits below both the average market cap of the top 10 (67.5B) and the sector median (34B). The company trails its nearest higher competitor by approximately 4.24%, reflecting a moderate gap in scale.
Comparisons with competitors
Check out how we compare the company to its competitors:
Does FE have a competitive advantage?
FirstEnergy Corp. displays a very favorable competitive advantage with a ROIC exceeding WACC by nearly 40%, signaling strong value creation and efficient capital use. Its growing ROIC trend confirms a sustainable competitive position within the regulated electric utility sector.
Looking ahead, FirstEnergy’s diverse energy generation portfolio—including coal, nuclear, hydro, natural gas, wind, and solar—positions it to capitalize on evolving energy markets and regulatory shifts. This broad mix supports potential growth opportunities across multiple U.S. states it serves.
SWOT Analysis
This SWOT analysis highlights FirstEnergy Corp.’s key internal and external factors shaping its strategic positioning.
Strengths
- strong regulated utility footprint
- diverse energy mix including nuclear and renewables
- very favorable moat with growing ROIC
- solid revenue growth of 35.6% over five years
Weaknesses
- low liquidity ratios signal short-term risk
- high debt-to-equity ratio weakens balance sheet
- negative EBIT growth highlights operational challenges
Opportunities
- expanding renewable energy investments
- potential regulatory support for clean energy
- increasing demand for reliable transmission infrastructure
Threats
- regulatory uncertainties and policy shifts
- competition from decentralized energy sources
- exposure to commodity price volatility
FirstEnergy’s moat and revenue growth offer a robust foundation. However, financial leverage and operational efficiency require urgent attention. The company must leverage its regulatory position while mitigating balance sheet risks.
Stock Price Action Analysis
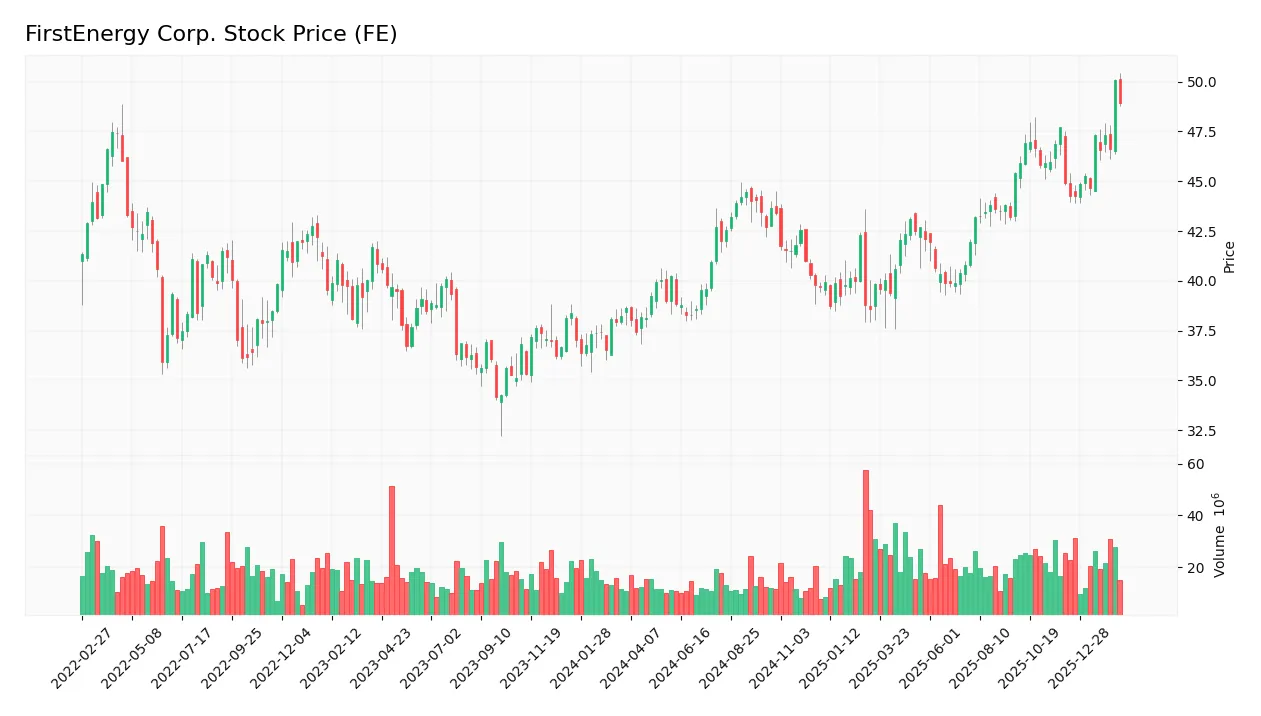
The weekly stock chart illustrates FirstEnergy Corp.’s price movements, highlighting key levels and momentum over the past 12 months:
Trend Analysis
Over the past 12 months, FE’s stock price rose 26.72%, indicating a bullish trend with clear acceleration. The price ranged from a low of 37.41 to a high of 50.1, supported by a volatility measure of 2.84%, confirming steady upward momentum.
Volume Analysis
Trading volume is increasing overall, with buyers representing 51.15% of total activity historically. However, in the recent three months, sellers dominated with 62.94% of volume, signaling cautious investor sentiment and possible short-term selling pressure.
Target Prices
Analysts set a target consensus that reflects cautious optimism for FirstEnergy Corp.
| Target Low | Target High | Consensus |
|---|---|---|
| 46 | 54 | 49.5 |
This range suggests moderate upside potential, with analysts expecting steady performance near the $50 mark.

Don’t Let Luck Decide Your Entry Point
Optimize your entry points with our advanced ProRealTime indicators. You’ll get efficient buy signals with precise price targets for maximum performance. Start outperforming now!
Analyst & Consumer Opinions
This section reviews the latest analyst grades and consumer feedback related to FirstEnergy Corp.’s market performance and reputation.
Stock Grades
Here are the latest verified stock grades for FirstEnergy Corp. from leading research firms:
| Grading Company | Action | New Grade | Date |
|---|---|---|---|
| Wolfe Research | Upgrade | Outperform | 2026-01-27 |
| Barclays | Maintain | Overweight | 2026-01-22 |
| Wells Fargo | Maintain | Overweight | 2026-01-20 |
| UBS | Maintain | Neutral | 2025-12-17 |
| Mizuho | Maintain | Neutral | 2025-10-24 |
| Scotiabank | Maintain | Sector Outperform | 2025-10-24 |
| UBS | Maintain | Neutral | 2025-10-24 |
| Jefferies | Maintain | Hold | 2025-10-21 |
| Morgan Stanley | Maintain | Overweight | 2025-10-21 |
| Keybanc | Downgrade | Sector Weight | 2025-10-15 |
The majority of recent grades cluster around neutral to overweight, with Wolfe Research notably upgrading to outperform in early 2026. This pattern suggests a cautious but generally positive sentiment among analysts.
Consumer Opinions
FirstEnergy Corp. elicits mixed reactions from its consumer base, reflecting both reliable service and areas needing improvement.
| Positive Reviews | Negative Reviews |
|---|---|
| “Consistent energy supply with minimal outages.” | “Customer service response times are slow.” |
| “Billing is straightforward and easy to understand.” | “Rates have increased noticeably over the last year.” |
| “Proactive communication during storms and outages.” | “Limited options for renewable energy sources.” |
Overall, consumers appreciate FirstEnergy’s dependable supply and clear billing. However, slow customer support and rising rates remain common complaints, signaling areas for strategic focus.
Risk Analysis
The following table summarizes FirstEnergy Corp.’s key risks, highlighting their likelihood and potential impact:
| Category | Description | Probability | Impact |
|---|---|---|---|
| Financial Health | Altman Z-Score in distress zone signals high bankruptcy risk. | High | Severe |
| Liquidity | Current and quick ratios at 0.0 indicate critical liquidity issues. | High | Severe |
| Leverage | Debt-to-equity ratio of 2.1 is very unfavorable and risky. | High | High |
| Profitability | Moderate net margin of 8.4% and ROE of 10.2% are neutral. | Medium | Medium |
| Operational Efficiency | Low asset turnover (0.27) limits revenue generation from assets. | Medium | Medium |
| Dividend Stability | Dividend yield near 3.9% is favorable but could strain cash flow. | Medium | Low |
FirstEnergy faces significant financial distress risks, with liquidity and leverage metrics raising red flags. The Altman Z-score below 1.8 confirms a high probability of financial distress. Operational inefficiencies and moderate profitability compound risks amid a challenging regulatory environment for utilities. Investors must weigh these factors carefully.
Should You Buy FirstEnergy Corp.?
FirstEnergy Corp. appears to be generating strong value creation with a very favorable competitive moat supported by a growing ROIC. Despite substantial leverage and a distressed Altman Z-Score, the overall C+ rating suggests cautious operational efficiency and financial health.
Strength & Efficiency Pillars
FirstEnergy Corp. shows strong operational efficiency with a solid net margin of 8.42%. The return on invested capital (ROIC) stands at 44.25%, vastly exceeding the weighted average cost of capital (WACC) of 4.59%, marking the company as a clear value creator. This robust ROIC trend signals a sustainable competitive advantage. However, return on equity (ROE) at 10.16% is moderate, reflecting mixed capital allocation effectiveness. Overall, operational profitability remains a key strength despite some financial challenges.
Weaknesses and Drawbacks
The company is in financial distress, evidenced by a dangerously low Altman Z-Score of 0.83, indicating a high bankruptcy risk. Leverage is excessive with a debt-to-equity ratio of 2.1, and liquidity is critically weak as both current and quick ratios are zero. Interest coverage is negative, signaling difficulty servicing debt. Valuation metrics are neutral but coupled with seller dominance in recent trading (37.06% buyers), FirstEnergy faces significant short-term headwinds and solvency concerns that overshadow its operational gains.
Our Final Verdict about FirstEnergy Corp.
Despite operational strengths and value creation, FirstEnergy’s distressed solvency position makes its investment profile highly speculative. The Altman Z-Score below 1.8 demands caution, as the risk of bankruptcy is material. Investors might consider this a risky proposition unsuitable for conservative capital. The company’s potential remains, but financial instability clouds near-term outlook and warrants a wait-and-see stance until balance sheet health improves.
Disclaimer: This content is for informational purposes only and does not constitute financial, investment, or other professional advice. Investing in financial markets involves a significant risk of loss, and past performance is not indicative of future results.
Additional Resources
- FirstEnergy Announces 2025 Financial Results, Affirms 2026 Guidance and Provides Long-Term Financial Outlook Focused on Delivering Value to Customers, Communities and Investors – FirstEnergy (Feb 17, 2026)
- New Potomac Edison Substation Delivers More Reliable Power for Berkeley County Customers – FirstEnergy (Feb 18, 2026)
- Decoding FirstEnergy Corp (FE): A Strategic SWOT Insight – GuruFocus (Feb 19, 2026)
- FirstEnergy Q4 Earnings Top Estimates, Revenues Increase Y/Y – Yahoo Finance Singapore (Feb 18, 2026)
- FirstEnergy Pennsylvania Outlines New Plan for Buying Electricity Starting in 2027 – FirstEnergy (Feb 04, 2026)
For more information about FirstEnergy Corp., please visit the official website: firstenergycorp.com