Home > Analyses > Energy > First Solar, Inc.
First Solar transforms sunlight into power that fuels homes and businesses worldwide. It leads the solar industry with cutting-edge cadmium telluride modules, known for efficiency and durability. Its global footprint spans key markets, from the U.S. to India, reinforcing its reputation for innovation and quality. As clean energy demands surge, I ask: does First Solar’s financial strength and growth outlook still justify its premium market valuation?

Table of contents
Business Model & Company Overview
First Solar, Inc., founded in 1999 and headquartered in Tempe, Arizona, stands as a leader in the solar industry. It crafts an integrated ecosystem by designing, manufacturing, and selling cadmium telluride solar modules that convert sunlight into electricity. Serving a diverse clientele—from utilities to commercial operators—its mission centers on delivering scalable photovoltaic solutions worldwide.
The company’s revenue engine balances hardware sales with global service support across the Americas, Europe, and Asia. This strategic footprint underpins steady demand from developers and independent power producers. First Solar’s competitive advantage lies in its advanced technology and global reach, securing a durable economic moat that shapes the future of sustainable energy.
Financial Performance & Fundamental Metrics
I analyze First Solar, Inc.’s income statement, key financial ratios, and dividend payout policy to assess its profitability, efficiency, and shareholder returns.
Income Statement
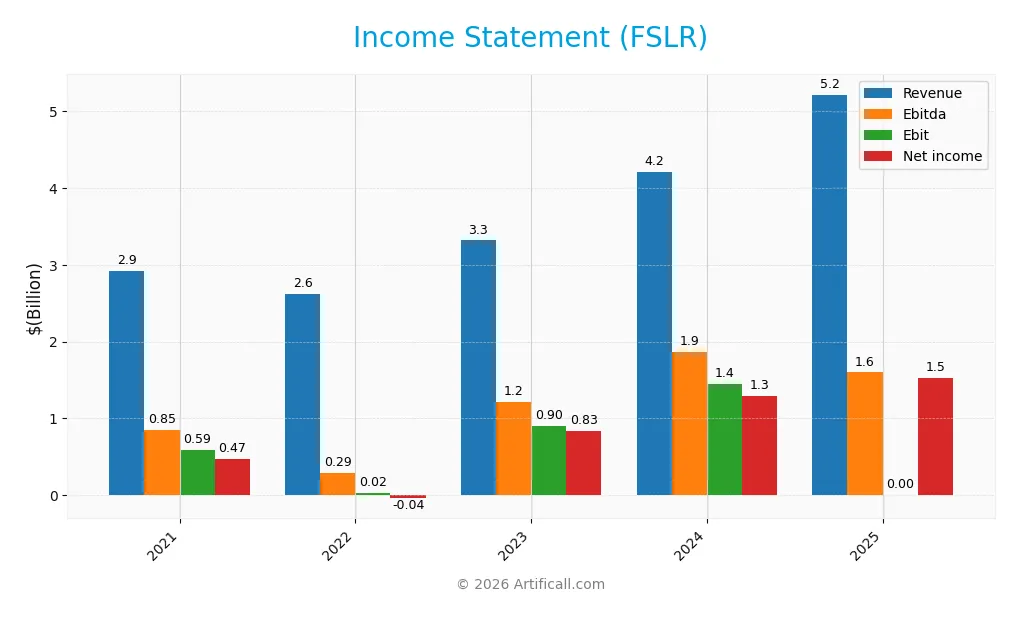
Below is First Solar, Inc.’s Income Statement for fiscal years 2021 through 2025, showing key profitability and expense metrics in USD.
| 2021 | 2022 | 2023 | 2024 | 2025 | |
|---|---|---|---|---|---|
| Revenue | 2.92B | 2.62B | 3.32B | 4.21B | 5.22B |
| Cost of Revenue | 2.19B | 2.55B | 2.02B | 2.35B | 3.10B |
| Operating Expenses | 143M | 97M | 443M | 463M | 523M |
| Gross Profit | 730M | 70M | 1.30B | 1.86B | 2.12B |
| EBITDA | 845M | 291M | 1.21B | 1.87B | 1.60B |
| EBIT | 585M | 21M | 904M | 1.45B | 0 |
| Interest Expense | 13M | 12M | 13M | 39M | -44M |
| Net Income | 469M | -44M | 831M | 1.29B | 1.53B |
| EPS | 4.41 | -0.41 | 7.78 | 12.07 | 14.25 |
| Filing Date | 2022-03-01 | 2023-02-28 | 2024-02-27 | 2025-02-25 | 2026-02-24 |
Income Statement Evolution
First Solar, Inc. shows strong revenue growth, up 24.1% in 2025 and 78.5% since 2021. Net income surged 226% over five years but dipped 4.7% last year. Gross margins expanded to 40.6%, reflecting improved cost control, while net margins remain robust near 29.3%. EBIT margin dropped sharply to zero in 2025, indicating operational challenges.
Is the Income Statement Favorable?
In 2025, revenue reached $5.22B with net income of $1.53B, generating a favorable 29.3% net margin. Operating income of $1.60B contrasts with a zero EBIT margin, signaling non-operating factors affecting profitability. Interest expense remains low at -0.85% of revenue. Overall, fundamentals appear favorable but the EBIT margin decline warrants close monitoring.
Financial Ratios
The following table presents key financial ratios for First Solar, Inc. over the last five fiscal years:
| Ratios | 2021 | 2022 | 2023 | 2024 | 2025 |
|---|---|---|---|---|---|
| Net Margin | 16% | -2% | 25% | 31% | 29% |
| ROE | 8% | -1% | 12% | 16% | 16% |
| ROIC | 7% | 2% | 9% | 12% | 14% |
| P/E | 20 | -361 | 22 | 15 | 18 |
| P/B | 1.55 | 2.73 | 2.75 | 2.36 | 2.94 |
| Current Ratio | 4.39 | 3.65 | 3.55 | 2.45 | 2.67 |
| Quick Ratio | 3.26 | 2.90 | 2.77 | 1.80 | 2.35 |
| D/E | 0.07 | 0.04 | 0.09 | 0.09 | 0.05 |
| Debt-to-Assets | 5% | 3% | 6% | 6% | 4% |
| Interest Coverage | 45x | -2.2x | 66x | 36x | -36x |
| Asset Turnover | 0.39 | 0.32 | 0.32 | 0.35 | 0.39 |
| Fixed Asset Turnover | 0.95 | 0.72 | 0.74 | 0.76 | 0.92 |
| Dividend Yield | 0% | 0% | 0% | 0% | 0% |
Evolution of Financial Ratios
From 2021 to 2025, First Solar’s Return on Equity (ROE) improved steadily, rising from 7.86% to 16.02%. The Current Ratio showed a downward trend but remained robust above 2.5, indicating consistent liquidity. Debt-to-Equity Ratio declined from 6.7% to 5.2%, reflecting a slight reduction in leverage. Profitability improved significantly, with net margins rising from 16.03% in 2021 to 29.28% in 2025.
Are the Financial Ratios Fovorable?
In 2025, profitability ratios like net margin (29.28%) and ROE (16.02%) are favorable, supported by a strong ROIC (14.15%) above WACC (11.12%). Liquidity remains solid with a current ratio of 2.67 and quick ratio of 2.35. Leverage is low and favorable at 5% debt-to-equity. However, asset turnover (0.39) and interest coverage are unfavorable, and valuation ratios like P/E (18.33) sit neutral. Overall, the financial profile appears slightly favorable.
Shareholder Return Policy
First Solar, Inc. does not pay dividends, reflecting its focus on reinvestment and growth rather than direct shareholder payouts. The company’s free cash flow has improved, supporting capital expenditures and potential buybacks.
FSLR’s lack of dividends aligns with its strategy to prioritize long-term value through reinvestment. While no share buyback data is provided, this approach suits a high-growth sector. The policy appears consistent with sustainable shareholder value creation.
Score analysis
The following radar chart displays First Solar, Inc.’s key financial scores, highlighting strengths and weaknesses across valuation and profitability metrics:

First Solar posts very favorable returns on equity and assets with scores of 5 each. Its debt-to-equity score is moderate at 3. However, valuation scores lag, with very unfavorable discounted cash flow and price-to-book scores at 1, and an unfavorable price-to-earnings score of 2.
Analysis of the company’s bankruptcy risk
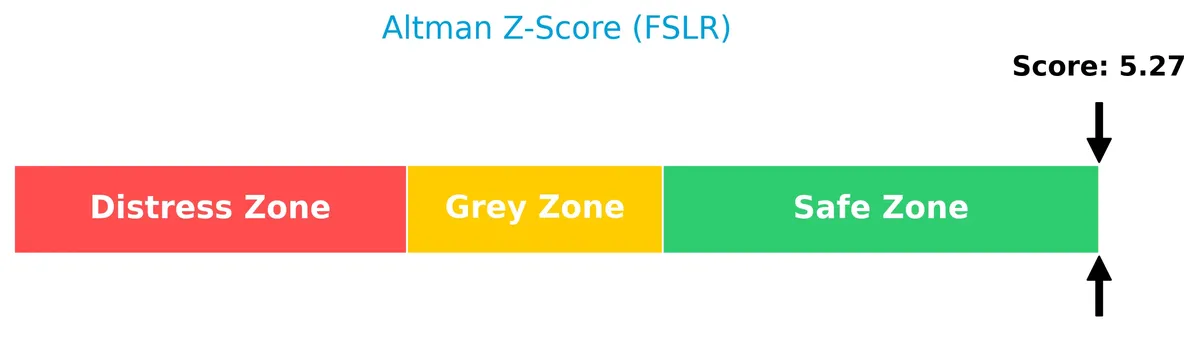
First Solar’s Altman Z-Score firmly places the company in the safe zone, indicating a low risk of bankruptcy:
Is the company in good financial health?
The Piotroski Score diagram reflects First Solar’s strong financial health and robust fundamentals:

With a Piotroski Score of 8, the company demonstrates very strong financial strength, signaling solid profitability, liquidity, and operational efficiency.
Competitive Landscape & Sector Positioning
This section analyzes First Solar, Inc.’s strategic positioning, revenue segments, key products, and main competitors. I will assess whether First Solar holds a competitive advantage within the solar energy sector.
Strategic Positioning
First Solar, Inc. concentrates its revenue primarily on photovoltaic solar modules, generating over $4.2B in 2024. Its geographic exposure is diversified across the United States, India, and France, with the U.S. market contributing the largest share of $3.9B, indicating a focused yet internationally spread portfolio.
Revenue by Segment
This pie chart illustrates First Solar, Inc.’s revenue distribution by segment for the fiscal year 2024, highlighting the contribution of each business line in that period.
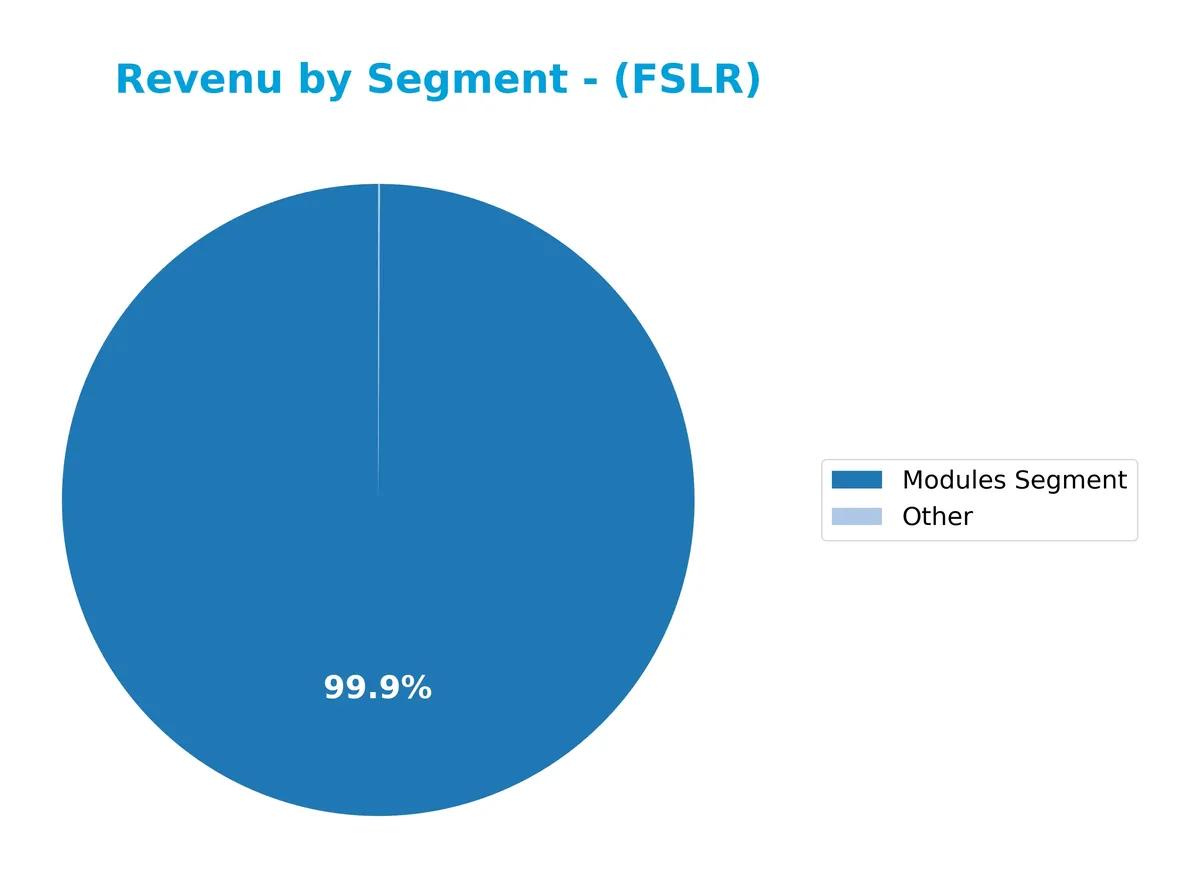
First Solar’s Modules Segment dominates revenue with $4.2B in 2024, showing significant growth from $3.3B in 2023. The Other segment is negligible at $3.6M, indicating a strong concentration in solar modules. This sharp revenue acceleration underscores First Solar’s focus and market strength in module manufacturing, though reliance on a single segment may pose concentration risks if market conditions shift.
Key Products & Brands
The table below presents First Solar’s main products and their descriptions:
| Product | Description |
|---|---|
| Cadmium Telluride Solar Modules | Photovoltaic solar modules that convert sunlight into electricity, designed and manufactured by First Solar. |
| Solar Energy Solutions | Integrated solar power systems offered to utilities, developers, operators, and commercial clients. |
| Other | Miscellaneous products and services related to solar energy, representing a minor revenue segment. |
First Solar primarily generates revenue from its cadmium telluride solar modules, which dominate its product portfolio. The company’s offerings support a diverse range of clients across multiple countries. Other products contribute marginally to total sales.
Main Competitors
First Solar, Inc. competes in a field of 34 companies, with the following top 10 leaders ranked by market capitalization:
| Competitor | Market Cap. |
|---|---|
| Exxon Mobil Corporation | 517B |
| Chevron Corporation | 312B |
| ConocoPhillips | 120B |
| The Williams Companies, Inc. | 74B |
| Kinder Morgan, Inc. | 62B |
| SLB N.V. | 60B |
| EOG Resources, Inc. | 59B |
| Phillips 66 | 53B |
| Valero Energy Corporation | 52B |
| Marathon Petroleum Corporation | 50B |
First Solar, Inc. ranks 18th among 34 competitors. Its market cap stands at just 5.05% of the sector leader, Exxon Mobil. The company is below both the average market cap of the top 10 competitors (136B) and the sector median (31B). It maintains a 27.83% market cap gap above its nearest competitor, reflecting a modest but clear separation in scale.
Comparisons with competitors
Check out how we compare the company to its competitors:
Aucun article trouvé pour ces critères.
Does FSLR have a competitive advantage?
First Solar, Inc. demonstrates a sustainable competitive advantage, evidenced by a ROIC exceeding WACC by over 3%, indicating efficient capital use and value creation. Its ROIC has grown nearly 100% over five years, signaling strong profitability momentum.
Looking ahead, First Solar leverages its cadmium telluride module technology across diverse markets including the US, India, and France. Expanding international presence and advancing solar solutions position the company for continued growth opportunities in the evolving renewable energy sector.
SWOT Analysis
This SWOT analysis highlights First Solar, Inc.’s core competitive position and strategic challenges.
Strengths
- Strong 40.6% gross margin
- Robust 29.3% net margin
- Very favorable moat with growing ROIC
- Low debt levels with 0.05 D/E ratio
- High liquidity with 2.67 current ratio
Weaknesses
- Zero dividend yield limits income investors
- Unfavorable EBIT margin at 0%
- Weak asset turnover (0.39) signals efficiency issues
- Interest coverage near zero raises risk concerns
Opportunities
- Expanding U.S. market presence with $5B revenue
- Growing demand for clean energy globally
- Innovation in cadmium telluride technology
- Opportunity to improve operational efficiency
Threats
- Intense competition in solar industry
- Regulatory changes in key markets like U.S. and India
- Supply chain disruptions for solar materials
- Volatility due to high beta of 1.63
First Solar’s robust profitability and expanding market footprint form a solid foundation. However, operational inefficiencies and zero dividend policy require strategic attention. The company must leverage innovation and market growth while managing industry risks prudently.
Stock Price Action Analysis
The weekly stock chart illustrates First Solar, Inc.’s price movements over the past 12 months, highlighting key highs and lows:
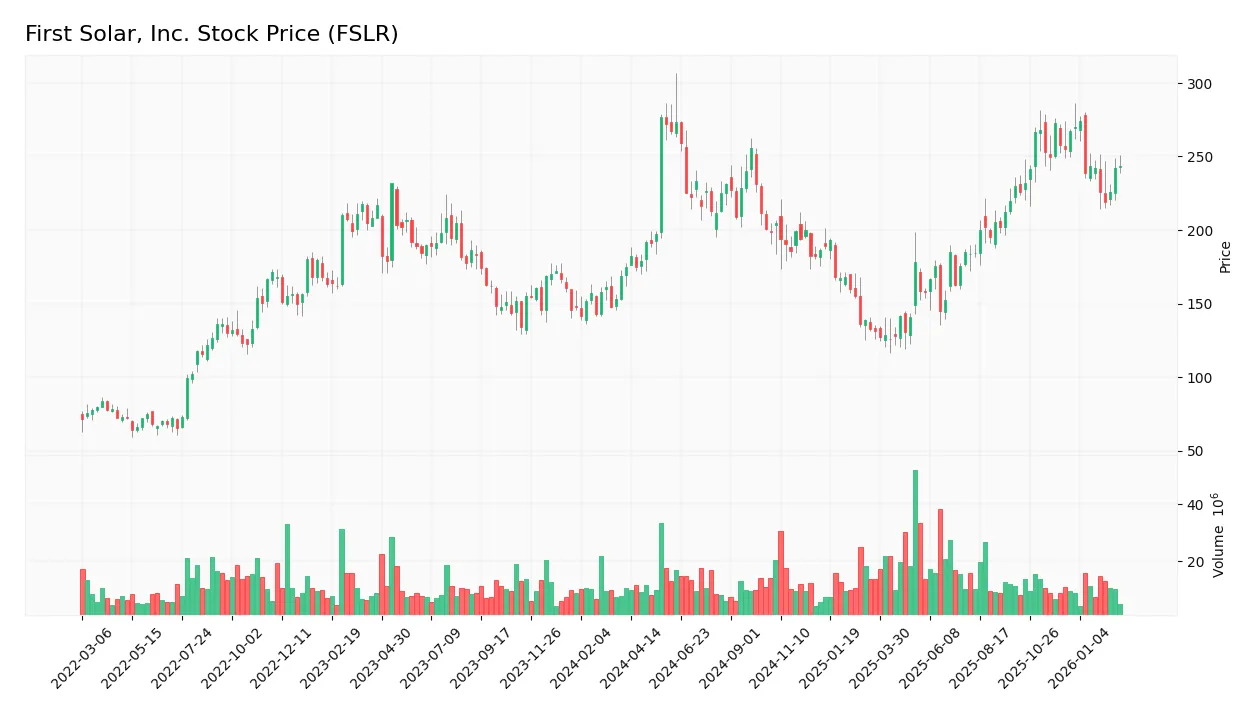
Trend Analysis
Over the past 12 months, FSLR’s stock price rose 39.3%, indicating a bullish trend with decelerating momentum. The price ranged between 125.93 and 276.74, showing significant volatility with a 40.78 standard deviation. However, from December 2025 to March 2026, the trend reversed, falling 4.55%, reflecting a recent bearish movement.
Volume Analysis
Trading volume shows an increasing trend overall, with buyers slightly ahead at 51.92% of total volume. In the recent three months, seller volume marginally exceeded buyers at 50.85%, signaling neutral buyer behavior and balanced market participation during this period.
Target Prices
Analysts present a bullish consensus for First Solar, Inc., reflecting strong confidence in its growth prospects.
| Target Low | Target High | Consensus |
|---|---|---|
| 150 | 330 | 280.71 |
The target range spans from 150 to 330, with a consensus near 281, indicating robust upside potential supported by industry tailwinds and execution capabilities.

Don’t Let Luck Decide Your Entry Point
Optimize your entry points with our advanced ProRealTime indicators. You’ll get efficient buy signals with precise price targets for maximum performance. Start outperforming now!
Analyst & Consumer Opinions
This section examines grades and consumer feedback regarding First Solar, Inc. (FSLR) to assess market sentiment.
Stock Grades
The latest verified analyst grades for First Solar, Inc. reveal a consistent yet cautious consensus across major firms:
| Grading Company | Action | New Grade | Date |
|---|---|---|---|
| B of A Securities | Maintain | Buy | 2026-01-22 |
| Guggenheim | Maintain | Buy | 2026-01-08 |
| Jefferies | Downgrade | Hold | 2026-01-07 |
| Wells Fargo | Maintain | Overweight | 2025-12-19 |
| GLJ Research | Maintain | Buy | 2025-11-04 |
| UBS | Maintain | Buy | 2025-11-03 |
| TD Cowen | Maintain | Buy | 2025-10-31 |
| Keybanc | Maintain | Underweight | 2025-10-31 |
| JP Morgan | Maintain | Overweight | 2025-10-31 |
| Roth Capital | Maintain | Buy | 2025-10-27 |
The majority of grades sustain a Buy or Overweight stance, with only Jefferies lowering its rating to Hold and Keybanc maintaining Underweight. Overall, the trend reflects moderate confidence tempered by some caution.
Consumer Opinions
First Solar, Inc. garners a mix of enthusiasm and constructive criticism from its customer base, reflecting its evolving role in renewable energy.
| Positive Reviews | Negative Reviews |
|---|---|
| “Impressive efficiency and reliability in solar panels.” | “Installation delays have been frustrating.” |
| “Strong commitment to sustainability and innovation.” | “Customer service response times need improvement.” |
| “Competitive pricing compared to other solar providers.” | “Limited availability in some regions.” |
Consumers praise First Solar for its advanced technology and eco-friendly approach. However, recurring concerns involve service delays and regional accessibility.
Risk Analysis
Below is a summary table of key risks facing First Solar, Inc. as of 2026:
| Category | Description | Probability | Impact |
|---|---|---|---|
| Market Volatility | Elevated beta (1.63) indicates sensitivity to market swings. | Medium | Medium |
| Technology Risk | Rapid solar tech evolution may erode competitive advantage. | Medium | High |
| Debt Servicing | Negative interest coverage signals challenges in covering interest. | Low | High |
| Asset Efficiency | Low asset and fixed asset turnover ratios suggest underutilization. | Medium | Medium |
| Dividend Policy | No dividend yield may deter income-focused investors. | High | Low |
| Regulatory | Changes in subsidies or trade policies could impact profitability. | Medium | High |
The most pressing risks combine technology disruption and regulatory shifts, both carrying high impact potential. Despite strong profitability and a safe Altman Z-Score (5.27), First Solar’s negative interest coverage warns of financing stress. I see this as a red flag demanding close monitoring.
Should You Buy First Solar, Inc.?
First Solar, Inc. appears to be a company with robust profitability and a durable competitive moat, supported by a very favorable moat status and growing ROIC. Despite some moderate leverage, its overall rating suggests a strong value creation profile within a safe financial zone.
Strength & Efficiency Pillars
First Solar, Inc. exhibits solid profitability with a net margin of 29.28% and a return on equity (ROE) of 16.02%. Its return on invested capital (ROIC) stands at 14.15%, notably above its weighted average cost of capital (WACC) at 11.12%, confirming it as a value creator. The company shows sustained revenue growth of 78.54% over the period 2021-2025 and a robust Piotroski score of 8, indicating strong financial health. Operational efficiency is supported by a favorable gross margin of 40.62%.
Weaknesses and Drawbacks
First Solar’s valuation metrics show some caution: the price-to-earnings (P/E) ratio is neutral at 18.33, and price-to-book (P/B) ratio is also neutral at 2.94, suggesting the market prices in moderate growth expectations. While leverage is low with a debt-to-equity ratio of 0.05 and a strong current ratio of 2.67, the company faces weaknesses in asset turnover (0.39) and fixed asset turnover (0.92), signaling inefficiencies in asset utilization. Interest coverage is unfavorable, which may pressure profitability if interest rates rise.
Our Final Verdict about First Solar, Inc.
First Solar presents a fundamentally strong profile characterized by value creation and solid profitability. Despite a bullish long-term stock trend with a 39.3% price increase, recent short-term weakness with a -4.55% price decline and neutral buyer dominance suggests a cautious entry. The company could appeal to investors seeking exposure to renewable energy but may appear better suited for those willing to wait for stabilization in market sentiment.
Disclaimer: This content is for informational purposes only and does not constitute financial, investment, or other professional advice. Investing in financial markets involves a significant risk of loss, and past performance is not indicative of future results.
Additional Resources
- First Solar, Inc. Announces Fourth Quarter and Full Year 2025 Financial Results and 2026 Guidance – Business Wire (Feb 24, 2026)
- Decoding First Solar Inc (FSLR): A Strategic SWOT Insight – GuruFocus (Feb 25, 2026)
- First Solar (FSLR) Q4 Earnings Miss Estimates – Yahoo Finance (Feb 25, 2026)
- First Solar sinks after big Q4 miss, downside full-year sales guidance (FSLR:NASDAQ) – Seeking Alpha (Feb 25, 2026)
- Earnings Summary: First Solar Q4 – Benzinga (Feb 24, 2026)
For more information about First Solar, Inc., please visit the official website: firstsolar.com