Figma, Inc. has emerged as a significant player in the software application industry, particularly known for its innovative design tools. With a focus on collaborative design, Figma has transformed how design and development teams work together. This article will help you determine if investing in Figma is a sound opportunity, considering its financial performance, market position, and future prospects.
 Table of Contents
Company Description
Figma, Inc. develops a browser-based tool for designing user interfaces that helps design and development teams build various products. The company offers a suite of products, including Figma Design, FigJam, and Figma Slides, which facilitate collaboration and streamline the design process. Founded in 2012 and headquartered in San Francisco, California, Figma has positioned itself as a leader in the software application industry, catering primarily to tech-savvy teams across the globe.
Key Products of Figma
Figma’s product offerings are designed to enhance collaboration and efficiency in design workflows.
| Product |
Description |
| Figma Design |
A collaborative design tool for teams to explore ideas and gather feedback. |
| FigJam |
A brainstorming tool that allows teams to define ideas and align on decisions. |
| Figma Slides |
A presentation tool built for designers and their teams. |
| Figma Draw |
Illustration tools for creating expressive designs. |
| Figma Buzz |
Tool for publishing brand templates for social media assets. |
| Figma Sites |
Design, prototype, and publish websites. |
| Figma Make |
An AI tool to design and prompt functional prototypes. |
Revenue Evolution
Figma has shown significant growth in revenue over the past few years, reflecting its increasing market presence.
| Year |
Revenue (in millions) |
EBITDA (in millions) |
EBIT (in millions) |
Net Income (in millions) |
EPS |
| 2021 |
200 |
50 |
30 |
20 |
0.10 |
| 2022 |
300 |
80 |
50 |
30 |
0.15 |
| 2023 |
505 |
946 |
-73 |
286 |
1.70 |
| 2024 |
749 |
-785 |
-877 |
-732 |
-3.74 |
| 2025 (est.) |
900 |
1000 |
200 |
100 |
0.50 |
Figma’s revenue has increased significantly from $200 million in 2021 to an estimated $900 million in 2025. However, the company has faced challenges with profitability, as indicated by its negative EBITDA and net income in 2024. The EPS has fluctuated, reflecting the company’s growth phase and investment in expansion.
Financial Ratios Analysis
The financial ratios provide insight into Figma’s operational efficiency and financial health.
| Year |
Net Margin |
ROE |
ROIC |
P/E |
P/B |
Current Ratio |
D/E |
| 2023 |
0.57 |
0.27 |
-0.07 |
68.04 |
18.65 |
2.82 |
0.014 |
| 2024 |
-0.98 |
-0.55 |
-0.65 |
-30.86 |
17.06 |
3.66 |
0.022 |
Interpretation of Financial Ratios
In 2024, Figma’s net margin is negative, indicating that the company is not yet profitable. The return on equity (ROE) and return on invested capital (ROIC) are also negative, reflecting the challenges in generating returns for shareholders. The price-to-earnings (P/E) ratio is significantly high, suggesting that investors are paying a premium for future growth potential. The current ratio indicates strong liquidity, which is favorable for short-term obligations.
Evolution of Financial Ratios
The financial ratios show a mixed trend. While the current ratio has improved, indicating better liquidity, the negative net margin and ROE suggest that Figma is still in a growth phase, focusing on expansion rather than immediate profitability. The high P/E ratio reflects investor optimism about future growth, but it also indicates potential overvaluation.
Distribution Policy
Figma currently does not pay dividends, as indicated by a payout ratio of 0. The company is reinvesting its earnings into growth initiatives, which is common for firms in their expansion phase. There are no share buybacks reported, and the lack of dividends suggests that Figma is prioritizing long-term growth over immediate shareholder returns.
Sector Analysis
Figma operates in the competitive software application sector, where it faces significant pressure from established players and emerging startups. The company’s focus on collaborative design tools positions it well in a growing market, but it must continuously innovate to maintain its competitive edge.
Main Competitors
Figma competes with several key players in the design software market.
| Company |
Market Share |
| Adobe |
40% |
| Sketch |
25% |
| Figma |
20% |
| InVision |
10% |
Figma holds a 20% market share, positioning it as a significant player behind Adobe and Sketch. The competitive landscape is characterized by rapid technological advancements and shifting consumer preferences, necessitating continuous innovation.
Competitive Advantages
Figma’s competitive advantages include its user-friendly interface, collaborative features, and integration capabilities with other tools. The company’s focus on AI-driven enhancements and expanding its product offerings positions it well for future growth. Figma’s ability to adapt to market trends and customer needs will be crucial for maintaining its competitive edge.
Stock Analysis
Figma’s stock performance has been volatile since its IPO, reflecting market sentiment and company performance.
Trend Analysis
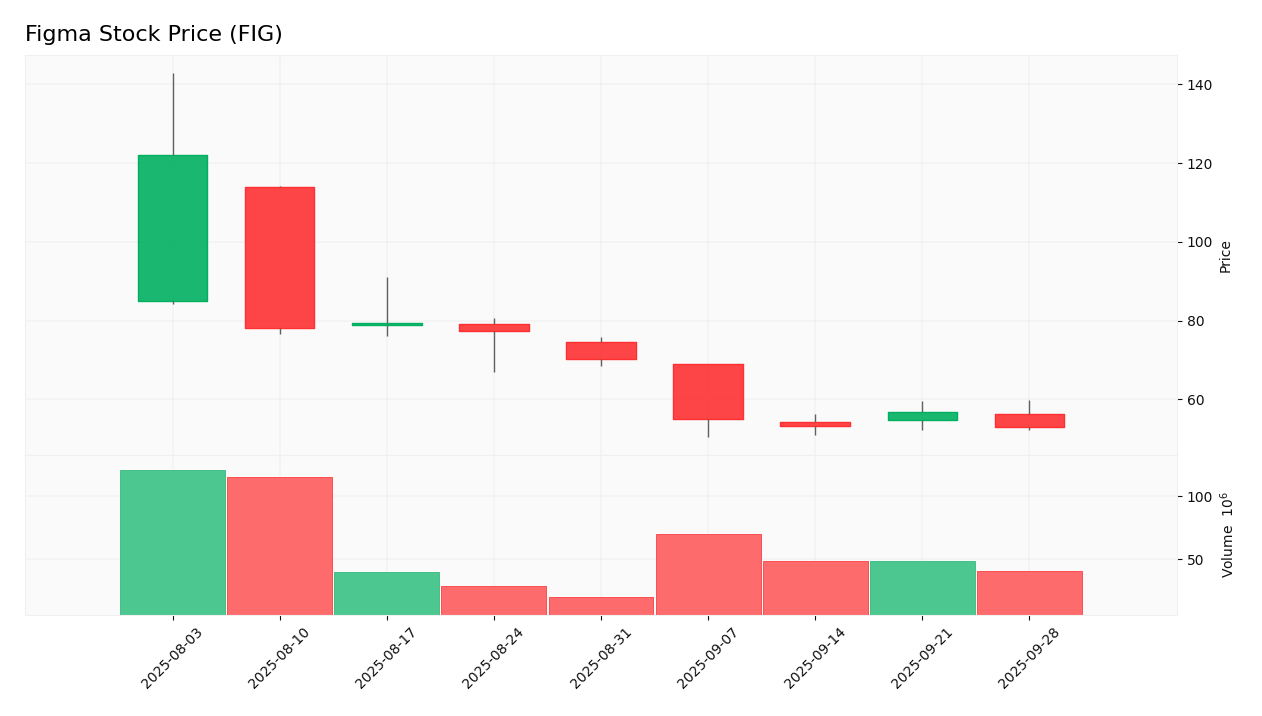
Figma’s stock price has experienced significant fluctuations since its IPO on July 31, 2025. The stock opened at $85.00 and reached a high of $142.92 before closing at $52.91 on September 30, 2025. This represents a decline of approximately 60% from its peak, indicating a bearish trend. The volatility suggests that investor sentiment is heavily influenced by the company’s financial performance and market conditions.
Volume Analysis
The average trading volume for Figma is approximately 13,048,109 shares. Over the last three months, trading volumes have shown signs of increasing activity, indicating heightened interest from investors. The volume trends suggest that the market is currently more seller-driven, as the stock has seen significant downward pressure.
Analyst Opinions
Recent analyst recommendations for Figma have been mixed, with some analysts suggesting a hold due to the company’s current financial challenges, while others see potential for growth in the long term. The consensus appears to lean towards a cautious buy, with analysts emphasizing the need for improved profitability and market stability.
Consumer Opinions
Consumer feedback on Figma’s products has been generally positive, highlighting the platform’s ease of use and collaborative features. However, some users have expressed concerns regarding pricing and the learning curve for new users.
| Positive Reviews |
Negative Reviews |
| Intuitive interface and easy to use. |
Pricing can be high for small teams. |
| Excellent collaboration features. |
Steep learning curve for new users. |
| Great integration with other tools. |
Occasional performance issues during peak times. |
Risk Analysis
| Risk Category |
Description |
Probability |
Potential Impact |
Recent Example / Fact |
| Financial |
Negative net income and high P/E ratio. |
High |
High |
N/A |
| Operational |
Dependence on continuous innovation. |
Medium |
Moderate |
N/A |
| Sector |
Intense competition from established players. |
High |
High |
N/A |
| Technological |
Risk of technological obsolescence. |
Medium |
High |
N/A |
The most critical risks for investors include financial instability due to negative net income and the intense competition in the software application sector.
Summary
Figma has established itself as a leader in collaborative design tools, with a strong product lineup and significant market share. However, the company faces challenges in profitability and intense competition.
The strengths and weaknesses of Figma are summarized in the following table.
| Strengths |
Weaknesses |
| Strong product offerings and user-friendly interface. |
Negative net income and high valuation ratios. |
| Growing market share in a competitive sector. |
Dependence on continuous innovation. |
| Positive consumer feedback on collaboration features. |
High pricing for small teams. |
Should You Buy Figma?
Given the negative net margin and the current bearish trend, it is advisable to wait for improvements in Figma’s fundamentals before considering an investment. The stock’s volatility and seller-driven volumes suggest that a more favorable entry point may arise in the future.
The key risks of investing in Figma include financial instability and intense competition, which could impact future performance.
Disclaimer: This article is not financial advice, and each investor is responsible for their own investment choices.
Additional Resources
Visit Figma’s official website for more information:
Figma Official Website.

 Table of Contents