Home > Analyses > Technology > Figma, Inc.
Figma, Inc. revolutionizes how teams design and build digital products by delivering seamless, browser-based collaboration tools. Its flagship platform, Figma Design, empowers designers and developers to ideate, prototype, and align in real time, reshaping product workflows globally. Renowned for innovation and user-centric quality, Figma commands a leading position in application software. The key question remains: can Figma sustain its rapid growth amid evolving market pressures and justify its current valuation?
Table of contents
Business Model & Company Overview
Figma, Inc., founded in 2012 and headquartered in San Francisco, commands a leading position in the software application sector. Its browser-based platform unites design and development teams through tools like Figma Design, Dev Mode, FigJam, and Figma Slides, creating a seamless ecosystem that accelerates product innovation and collaboration globally.
The company’s revenue engine balances subscription-based software services with cutting-edge AI features, driving recurring income across the Americas, Europe, and Asia. Figma’s integrated suite fosters user engagement and retention, building a deep economic moat that positions it as a pivotal player shaping the future of interface design.
Financial Performance & Fundamental Metrics
I analyze Figma, Inc.’s income statement, key financial ratios, and dividend payout policy to reveal its operational strength and shareholder return strategy.
Income Statement
The following table summarizes Figma, Inc.’s income statement data for fiscal years 2023 through 2025, highlighting key profitability and expense metrics.

| 2023 | 2024 | 2025 | |
|---|---|---|---|
| Revenue | 505M | 749M | 1.06B |
| Cost of Revenue | 45M | 88M | 186M |
| Operating Expenses | 534M | 1.54B | 2.16B |
| Gross Profit | 460M | 661M | 870M |
| EBITDA | -65M | -870M | -1.29B |
| EBIT | -73M | -877M | 0 |
| Interest Expense | 0 | 0 | 0 |
| Net Income | 286M | -732M | -1.25B |
| EPS | 0.59 | -3.11 | -3.71 |
| Filing Date | 2023-12-31 | 2024-12-31 | 2026-02-18 |
Income Statement Evolution
From 2023 to 2025, Figma’s revenue more than doubled, reaching $1.06B in 2025. Gross profit grew substantially, maintaining a strong 82.4% margin. However, net income deteriorated sharply, swinging from a $286M profit in 2023 to a $1.25B loss in 2025, causing net margins to plunge into deeply negative territory.
Is the Income Statement Favorable?
In 2025, despite robust revenue growth of 41% and stable gross margins, operating expenses outpaced revenues, driving a severe operating loss of $1.29B. Net margin declined to -118%, reflecting high costs and negative earnings per share of -$3.71. Interest expenses remain zero, but overall fundamentals are mixed, showing strong top-line growth but weak profitability.
Financial Ratios
The following table summarizes key financial ratios for Figma, Inc. over the last three fiscal years:
| Ratios | 2023 | 2024 | 2025 |
|---|---|---|---|
| Net Margin | 57% | -98% | -118% |
| ROE | 27% | -55% | -83% |
| ROIC | -5% | -60% | -82% |
| P/E | 197 | -71 | -10 |
| P/B | 54 | 39 | 8 |
| Current Ratio | 2.82 | 3.66 | 2.58 |
| Quick Ratio | 2.82 | 3.66 | 2.58 |
| D/E | 0.014 | 0.022 | 0.039 |
| Debt-to-Assets | 0.009 | 0.016 | -1.67 |
| Interest Coverage | 0 | 0 | 0 |
| Asset Turnover | 0.32 | 0.42 | -30.10 |
| Fixed Asset Turnover | 43.40 | 17.09 | 24.95 |
| Dividend Yield | 0 | 0 | 0 |
Evolution of Financial Ratios
From 2023 to 2025, Figma’s Return on Equity (ROE) deteriorated sharply, turning negative by 2025 at -82.78%. The Current Ratio declined from 3.66 in 2024 to 2.58 in 2025, indicating reduced but still solid liquidity. The Debt-to-Equity Ratio remained very low and stable around 0.04, reflecting minimal leverage. Profitability weakened significantly, with net margins dropping below -118%.
Are the Financial Ratios Favorable?
In 2025, Figma’s profitability ratios, including ROE and net margin, are unfavorable, signaling losses and weak returns. Liquidity ratios like current and quick ratios stand favorable, showing good short-term financial health. Leverage is minimal and favorable with a very low debt-to-equity ratio. Asset turnover is negative, indicating operational inefficiency. The overall ratio assessment is neutral, split evenly between favorable and unfavorable metrics.
Shareholder Return Policy
Figma, Inc. does not pay dividends, reflecting its negative net income and prioritization of reinvestment. The company focuses on growth, allocating cash to operations and capital expenditures rather than shareholder distributions, with no share buyback programs reported.
This approach aligns with long-term value creation for shareholders if growth investments generate future profitability. However, the absence of returns requires investors to trust management’s capital allocation amid ongoing losses and negative profit margins.
Score analysis
The following radar chart illustrates Figma, Inc.’s key financial metric scores to highlight its performance across valuation and profitability measures:
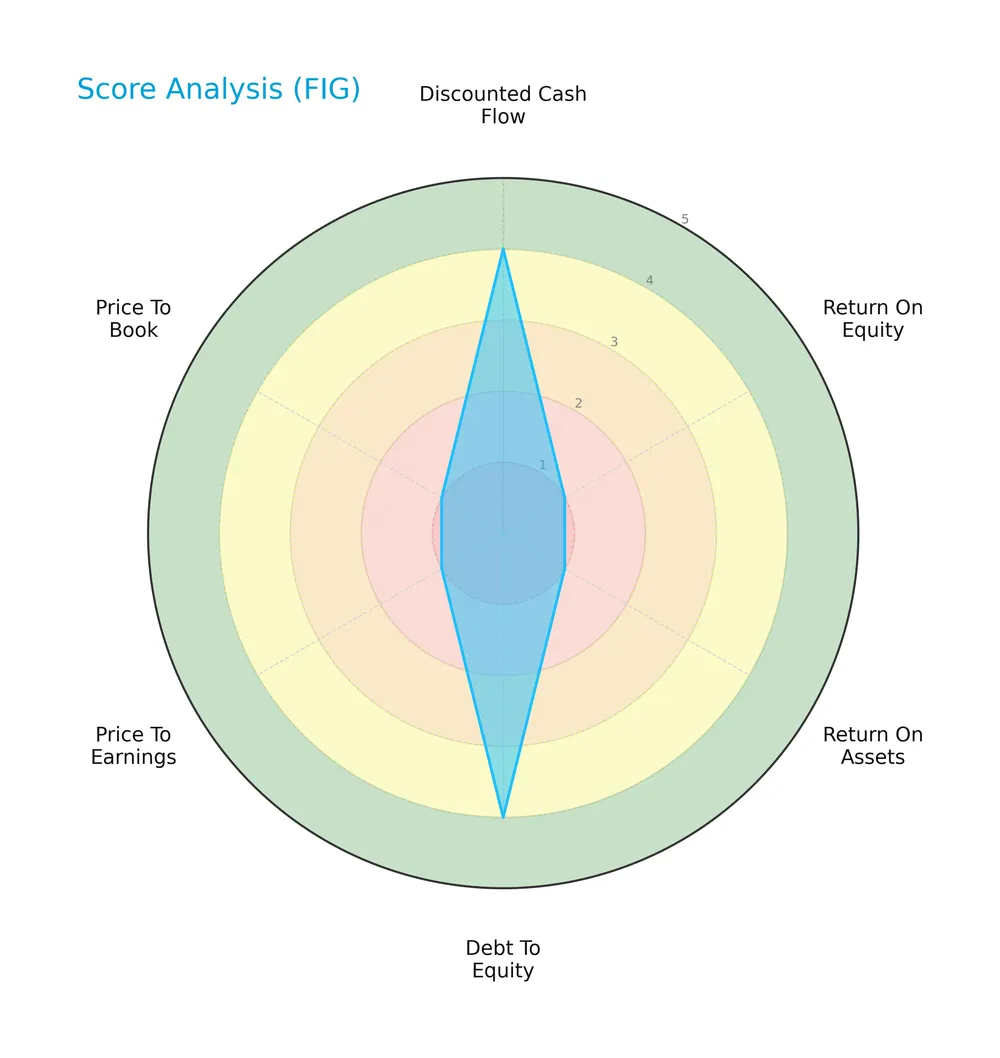
Figma scores favorably on discounted cash flow (4) and debt-to-equity (4), indicating solid valuation and leverage management. However, profitability and valuation metrics such as ROE (1), ROA (1), PE (1), and PB (1) are very unfavorable, reflecting weak asset returns and expensive multiples.
Analysis of the company’s bankruptcy risk
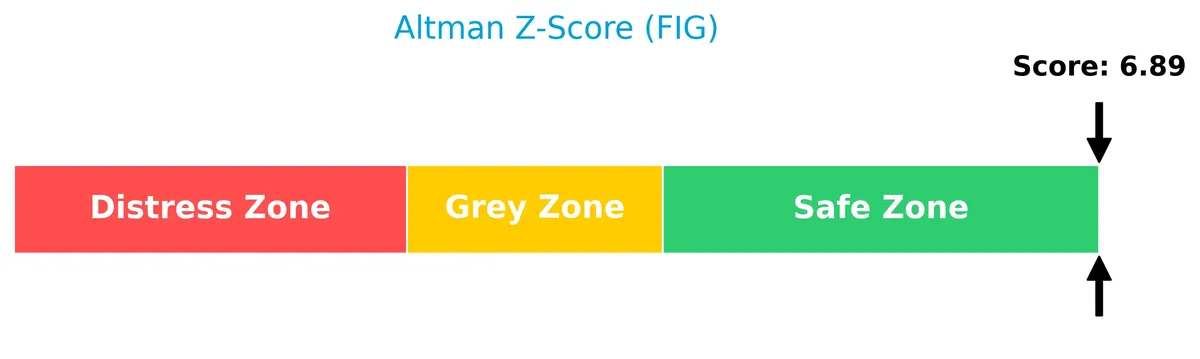
Figma’s Altman Z-Score places it well within the safe zone, signaling a very low risk of bankruptcy and strong financial stability:
Is the company in good financial health?
The Piotroski diagram below demonstrates Figma’s financial strength based on nine fundamental criteria:
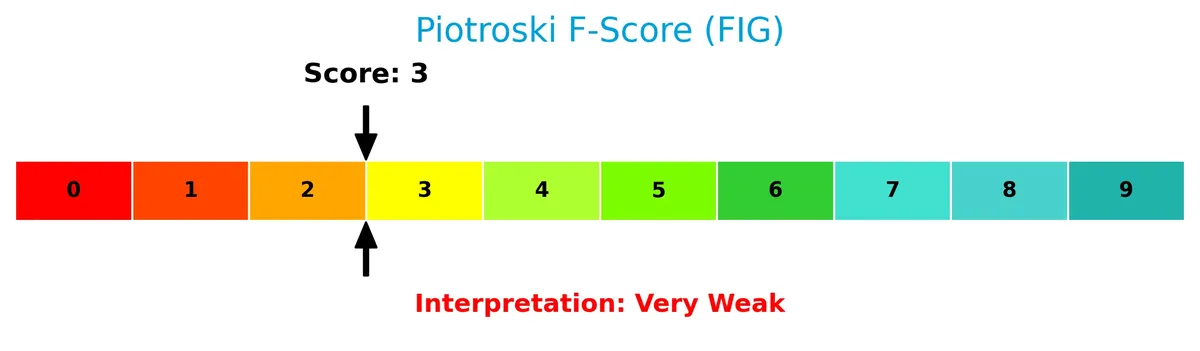
With a Piotroski score of 3, Figma ranks in the very weak category, indicating limited financial robustness despite favorable leverage and cash flow metrics. This suggests caution regarding its operational efficiency and profitability.
Competitive Landscape & Sector Positioning
This section analyzes Figma, Inc.’s position within the software application sector, focusing on strategic and product aspects. I will assess whether Figma holds a competitive advantage over its main industry rivals.
Strategic Positioning
Figma, Inc. concentrates its revenue primarily in the United States (492M) while maintaining significant international exposure (564M). The company offers a diversified portfolio of collaborative design and prototyping tools within the software application sector, targeting design and development teams globally.
Key Products & Brands
The following table lists Figma, Inc.’s key products and brands with their core functionalities:
| Product | Description |
|---|---|
| Figma Design | Collaborative design tool enabling teams to explore ideas, gather feedback, build prototypes, and use design systems. |
| Dev Mode | Tool to inspect designs and translate them into code without altering the original design file. |
| FigJam | Platform to define ideas, align decisions, and advance work collaboratively in one place. |
| Figma Slides | Presentation tool tailored for designers and their teams. |
| Figma Draw | Illustration tools for creating expressive designs. |
| Figma Buzz | Publishes brand templates for social media assets, ads, and one-pagers. |
| Figma Sites | Enables design, prototyping, and publishing of websites. |
| Figma Make | AI-powered tool for designing and generating functional prototypes via prompts. |
Figma, Inc.’s product suite centers on collaborative design and development, integrating prototyping, code translation, and AI assistance to streamline user interface creation.
Main Competitors
Figma, Inc. faces competition from 33 companies in its sector, with the top 10 leaders by market capitalization listed below:
| Competitor | Market Cap. |
|---|---|
| Salesforce, Inc. | 242B |
| Shopify Inc. | 210B |
| AppLovin Corporation | 209B |
| Intuit Inc. | 175B |
| Uber Technologies, Inc. | 172B |
| ServiceNow, Inc. | 153B |
| Cadence Design Systems, Inc. | 84B |
| Snowflake Inc. | 73B |
| Autodesk, Inc. | 61B |
| Workday, Inc. | 55B |
Figma ranks 19th among 33 competitors, with a market cap just 4.86% the size of Salesforce, the sector leader. It sits below both the average market cap of the top 10 (143.6B) and the median sector cap (18.8B). The company enjoys a significant 57% market cap gap above its nearest competitor, indicating a distinct positioning below the top tier.
Does Figma have a competitive advantage?
Figma currently lacks a competitive advantage, as its ROIC significantly underperforms its WACC, indicating value destruction and declining profitability. This weak capital efficiency contrasts with typical software sector benchmarks.
Looking ahead, Figma’s diverse product suite—including AI-driven design tools and collaborative platforms—positions it to capture new markets and opportunities. These innovations could improve its competitive stance if profitability trends reverse.
Comparisons with competitors
Check out how we compare the company to its competitors:
SWOT Analysis
This SWOT analysis highlights Figma, Inc.’s current strategic position and guides investors on potential risks and rewards.
Strengths
- Strong 82% gross margin
- Rapid revenue growth of 41% in 2025
- Solid liquidity with 2.58 current ratio
Weaknesses
- Negative net margin at -118%
- Declining ROIC signaling value destruction
- Very weak Piotroski score of 3
Opportunities
- Expanding collaborative design market
- Increasing adoption of AI-powered tools
- Growing international revenue outside US
Threats
- High valuation metrics (PB 8.34)
- Intense competition in software design
- Macroeconomic volatility impacting tech spend
Figma’s strengths in growth and margins are offset by significant profitability and efficiency challenges. The firm must leverage its innovation pipeline and global reach to stabilize returns and fend off fierce competition.
Stock Price Action Analysis
The weekly stock chart for Figma, Inc. (FIG) highlights significant price fluctuations and a notable downtrend over the past year:
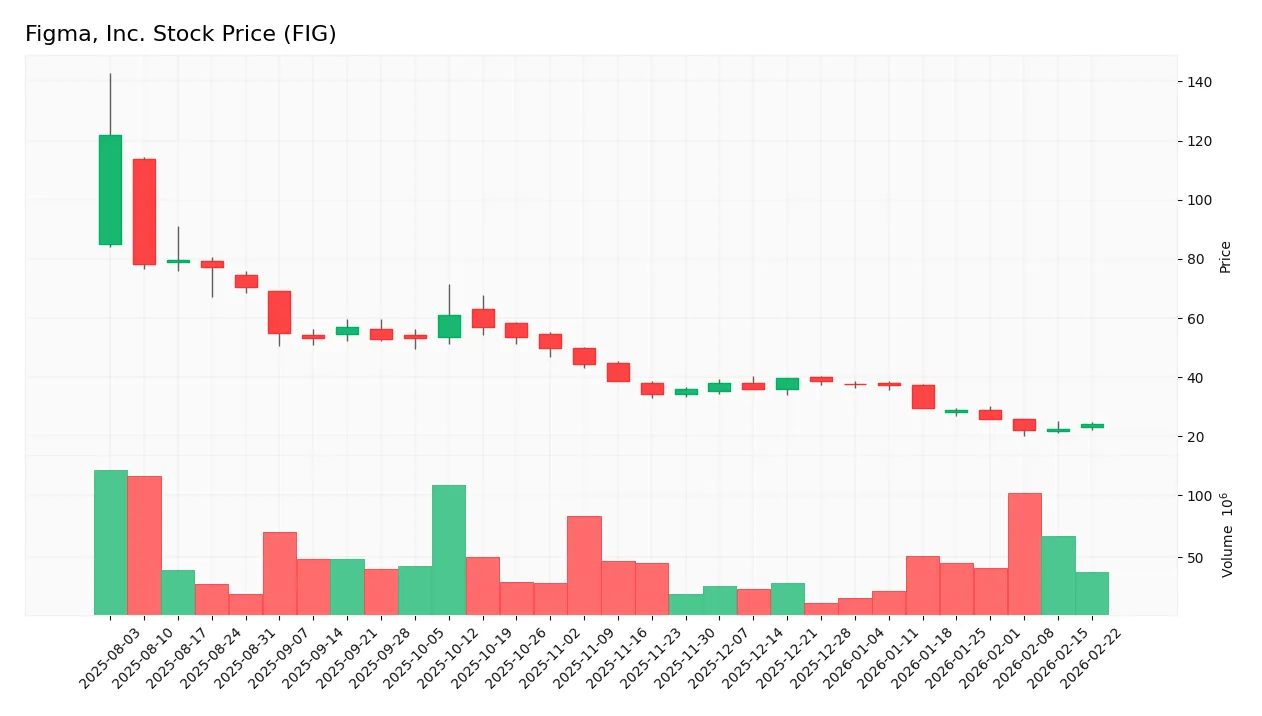
Trend Analysis
Over the past 12 months, FIG’s stock price declined by 80.17%, indicating a clear bearish trend. The price fell from a high of 122.0 to a low of 21.99, with accelerating downward momentum and a high volatility level (21.09 std deviation). Recent months show a continued decline of 36.29%, but with less volatility (6.54 std deviation).
Volume Analysis
Trading volume over the last three months decreased, with sellers dominating 66.39% of the activity. Buyer volume accounted for only 33.61%, underscoring a seller-driven market. This declining volume combined with persistent selling pressure suggests weakening investor interest and cautious market participation.
Target Prices
Analysts set a clear target price consensus for Figma, Inc., reflecting moderate upside potential.
| Target Low | Target High | Consensus |
|---|---|---|
| 35 | 52 | 42.17 |
The target range suggests analysts expect Figma’s share price to appreciate, with a consensus near 42, signaling cautious optimism.
Analyst & Consumer Opinions
This section examines analyst ratings and consumer feedback to provide a balanced view of Figma, Inc.’s market perception.

Don’t Let Luck Decide Your Entry Point
Optimize your entry points with our advanced ProRealTime indicators. You’ll get efficient buy signals with precise price targets for maximum performance. Start outperforming now!
Stock Grades
Here are the latest verified stock grades for Figma, Inc. from leading financial institutions:
| Grading Company | Action | New Grade | Date |
|---|---|---|---|
| Piper Sandler | Maintain | Overweight | 2026-02-03 |
| Morgan Stanley | Maintain | Equal Weight | 2026-01-15 |
| Wells Fargo | Upgrade | Overweight | 2026-01-08 |
| RBC Capital | Maintain | Sector Perform | 2026-01-05 |
| Goldman Sachs | Maintain | Neutral | 2025-11-07 |
| Piper Sandler | Maintain | Overweight | 2025-11-06 |
| JP Morgan | Maintain | Neutral | 2025-11-06 |
| Wells Fargo | Maintain | Equal Weight | 2025-11-05 |
| Wells Fargo | Maintain | Equal Weight | 2025-09-04 |
| Morgan Stanley | Maintain | Equal Weight | 2025-09-04 |
The consensus remains cautious with no strong buys or sells. Most firms favor a hold or equal weight stance, while a few maintain overweight ratings, signaling moderate confidence in the stock’s near-term prospects.
Consumer Opinions
Figma, Inc. sparks strong reactions from its user base, reflecting its role as a key player in design collaboration.
| Positive Reviews | Negative Reviews |
|---|---|
| Intuitive interface accelerates workflow. | Occasional lag during complex file handling. |
| Real-time collaboration improves team synergy. | Limited offline functionality frustrates users. |
| Robust plugin ecosystem enhances customization. | Pricing tiers feel steep for small teams. |
Overall, users praise Figma’s seamless collaboration and user-friendly design. However, performance issues and pricing concerns recur as notable drawbacks. This mix suggests solid appeal but room for refinement.
Risk Analysis
The table below outlines key risks for Figma, Inc., highlighting their likelihood and potential impact:
| Category | Description | Probability | Impact |
|---|---|---|---|
| Profitability Risk | Negative net margin (-118.44%) signals sustained losses and cash burn. | High | High |
| Operational Risk | Extremely low ROE (-82.78%) and ROIC (-81.95%) indicate poor capital efficiency. | High | High |
| Market Volatility | Beta of -3.58 suggests unusual sensitivity and potential price swings. | Medium | Medium |
| Liquidity Risk | Favorable current ratio (2.58) reduces short-term solvency concerns. | Low | Low |
| Debt Risk | Very low debt-to-equity ratio (0.04) implies minimal leverage risk. | Low | Low |
| Valuation Risk | High price-to-book ratio (8.34) may indicate overvaluation. | Medium | Medium |
| Dividend Risk | No dividends paid, limiting income appeal for yield investors. | High | Low |
| Financial Health | Piotroski score of 3 signals weak fundamentals despite Altman Z safe zone. | High | Medium |
Profitability and operational risks dominate due to Figma’s steep losses and poor returns on invested capital. Despite a strong Altman Z-score indicating low bankruptcy risk, the very weak Piotroski score warns of ongoing financial struggles. The negative beta indicates unusual stock behavior, increasing market risk. Investors must weigh these red flags against the company’s innovative product suite and growth potential.
Should You Buy Figma, Inc.?
Figma, Inc. appears to be in a challenging position with declining operational efficiency and a very unfavorable moat indicating value destruction. Despite manageable leverage and a strong Altman Z-score suggesting solvency, its profitability profile and overall rating of C+ reflect significant financial weakness.
Strength & Efficiency Pillars
Figma, Inc. maintains a strong gross margin of 82.43%, reflecting robust operational efficiency. The company benefits from a favorable weighted average cost of capital (WACC) at 4.59%, supporting its financing structure. Liquidity measures are solid, with a current ratio of 2.58 and a debt-to-equity of 0.04, signaling prudent leverage management. However, profitability metrics such as net margin (-118.44%), ROE (-82.78%), and ROIC (-81.95%) remain deeply negative, indicating operational challenges despite stable cost controls.
Weaknesses and Drawbacks
Despite a safe Altman Z-Score of 6.89 indicating low bankruptcy risk, Figma faces critical profitability and valuation concerns. The net margin and ROIC are deeply negative, signaling value destruction and deteriorating profitability. The price-to-book ratio at 8.34 shows an expensive valuation relative to book value, raising investor caution. Market pressure is evident as sellers dominate recent trading (66.39%), intensifying short-term headwinds. Interest coverage at zero flags potential vulnerability to financial costs if conditions worsen.
Our Final Verdict about Figma, Inc.
Figma’s financial health appears stable from a solvency perspective, supported by a safe Altman Z-Score of 6.89. Yet, the company’s persistent losses and negative returns on capital suggest it is shedding value. Despite long-term operational strengths, recent bearish momentum and high valuation metrics suggest a wait-and-see approach. This profile might appear too risky for conservative capital but could offer speculative opportunities for investors with high risk tolerance.
Disclaimer: This content is for informational purposes only and does not constitute financial, investment, or other professional advice. Investing in financial markets involves a significant risk of loss, and past performance is not indicative of future results.
Additional Resources
- Figma Announces Fourth Quarter and Fiscal Year 2025 Financial Results – Business Wire (Feb 18, 2026)
- Figma, Inc. (FIG) Q4 Earnings: Taking a Look at Key Metrics Versus Estimates – Yahoo Finance (Feb 19, 2026)
- Figma Gains on Strong Growth Outlook That Eases AI Fears – Bloomberg.com (Feb 18, 2026)
- Figma surges after Q4 revenue jumps 40%; 2026 full-year guidance shows 38% revenue jump – Seeking Alpha (Feb 18, 2026)
- Figma to Report Q4 Earnings: What’s in Store for the Stock? – Zacks Investment Research (Feb 16, 2026)
For more information about Figma, Inc., please visit the official website: figma.com