Home > Analyses > Financial Services > Fifth Third Bancorp
Fifth Third Bancorp powers everyday financial journeys across the Midwest and Southeast, shaping local economies with its broad banking network. It stands out through diversified services—commercial banking, consumer lending, and wealth management—anchored by innovation and deep community ties. Known for balancing growth with prudent risk management, Fifth Third commands respect among regional banks. The pressing question: does its current valuation reflect enduring fundamentals and future growth amid evolving market dynamics?

Table of contents
Business Model & Company Overview
Fifth Third Bancorp, founded in 1858 and headquartered in Cincinnati, Ohio, commands a strong presence in the regional banking sector. Its ecosystem integrates commercial banking, consumer lending, and wealth management, forming a comprehensive financial services platform. With over 1,100 banking centers and 2,300 ATMs, it serves diverse clients across multiple states, reinforcing its market position in the U.S. Midwest and Southeast.
The company’s revenue engine balances traditional lending and deposit products with sophisticated asset management and capital market services. Its footprint spans the Americas, with strategic exposure in key U.S. regions, leveraging a mix of fee-based and interest income streams. Fifth Third’s enduring competitive advantage lies in its diversified business model, which solidifies its economic moat and shapes the future of regional banking.
Financial Performance & Fundamental Metrics
I analyze Fifth Third Bancorp’s income statement, key financial ratios, and dividend payout policy to assess its core profitability and shareholder value creation.
Income Statement
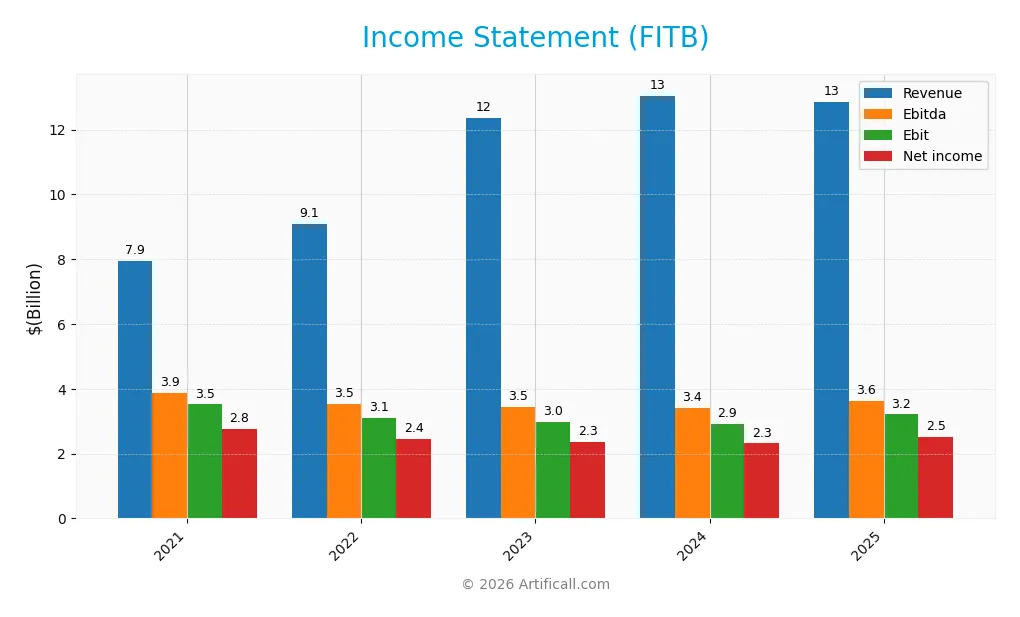
Below is the income statement for Fifth Third Bancorp (FITB) covering fiscal years 2021 to 2025. All figures are in USD and scaled for clarity.
| 2021 | 2022 | 2023 | 2024 | 2025 | |
|---|---|---|---|---|---|
| Revenue | 7.95B | 9.08B | 12.36B | 13.05B | 12.87B |
| Cost of Revenue | 64M | 1.54B | 4.45B | 5.33B | 4.47B |
| Operating Expenses | 4.37B | 4.45B | 4.92B | 4.81B | 5.19B |
| Gross Profit | 7.88B | 7.54B | 7.91B | 7.72B | 8.40B |
| EBITDA | 3.87B | 3.53B | 3.45B | 3.41B | 3.62B |
| EBIT | 3.52B | 3.09B | 2.99B | 2.92B | 3.21B |
| Interest Expense | 441M | 978M | 3.93B | 4.80B | 3.92B |
| Net Income | 2.77B | 2.45B | 2.35B | 2.31B | 2.52B |
| EPS | 3.78 | 3.38 | 3.23 | 3.16 | 3.55 |
| Filing Date | 2022-02-25 | 2023-02-24 | 2024-02-27 | 2025-02-24 | 2026-02-24 |
Income Statement Evolution
From 2021 to 2025, Fifth Third Bancorp’s revenue grew 61.9%, reflecting solid expansion. However, net income declined 8.9%, and net margin contracted by 43.7%, signaling margin pressure. The past year saw revenue dip 1.4%, but gross profit and EBIT rose 8.8% and 10.1%, respectively, boosting profitability despite top-line softness.
Is the Income Statement Favorable?
In 2025, the company posted a favorable gross margin of 65.3% and an EBIT margin near 25%, indicating efficient operations. Net margin improved to 19.6%, supported by a 12.7% EPS jump. Interest expense at 30.5% of revenue remains a concern. Overall, 57% of income metrics are positive, reflecting generally favorable income fundamentals.
Financial Ratios
The table below summarizes key financial ratios for Fifth Third Bancorp (FITB) over recent fiscal years, providing insight into profitability, valuation, liquidity, leverage, and efficiency:
| Ratios | 2021 | 2022 | 2023 | 2024 | 2025 |
|---|---|---|---|---|---|
| Net Margin | 35% | 27% | 19% | 18% | 20% |
| ROE | 12.5% | 14.1% | 12.3% | 11.8% | 11.6% |
| ROIC | 6.6% | 5.6% | 5.1% | 5.1% | 8.9% |
| P/E | 11.0 | 9.2 | 10.0 | 12.5 | 12.3 |
| P/B | 1.38 | 1.30 | 1.23 | 1.47 | 1.43 |
| Current Ratio | 0.48 | 0.41 | 0.47 | 0.38 | 0.82 |
| Quick Ratio | 0.48 | 0.41 | 0.47 | 0.38 | 0.82 |
| D/E | 0.57 | 1.07 | 1.01 | 0.97 | 0.67 |
| Debt-to-Assets | 6.0% | 9.0% | 9.1% | 8.9% | 6.8% |
| Interest Coverage | 8.0 | 3.2 | 0.76 | 0.61 | 0.82 |
| Asset Turnover | 0.038 | 0.044 | 0.058 | 0.061 | 0.060 |
| Fixed Asset Turnover | 2.51 | 2.73 | 3.72 | 3.93 | 4.14 |
| Dividend Yield | 2.9% | 4.1% | 4.5% | 4.1% | 3.2% |
Evolution of Financial Ratios
Return on Equity (ROE) for Fifth Third Bancorp remained relatively stable around 11.6% in 2025, showing no significant growth. The Current Ratio improved from a low 0.38 in 2024 to 0.82 in 2025 but still falls below the ideal benchmark of 1. The Debt-to-Equity ratio declined to 0.67 in 2025, indicating a moderate reduction in leverage. Profitability maintained a steady net margin near 19.6%, reflecting consistent earnings quality.
Are the Financial Ratios Favorable?
In 2025, profitability ratios such as net margin (19.6%), PE ratio (12.33), and price-to-book (1.43) are favorable, supporting earnings strength and valuation. Liquidity remains a concern with a suboptimal current ratio of 0.82, marked unfavorable, though the quick ratio is neutral at the same level. Leverage ratios like debt-to-equity (0.67) and debt-to-assets (6.77%) are neutral to favorable. Asset turnover (0.06) and interest coverage (0.82) ratios are unfavorable, signaling efficiency and coverage challenges. Overall, the balance of metrics is slightly favorable but requires cautious monitoring.
Shareholder Return Policy
Fifth Third Bancorp maintains a consistent dividend policy with a payout ratio near 40%, supported by a 3.2% dividend yield in 2025. The dividend per share has shown a moderate increase, backed by free cash flow coverage and complemented by share buyback programs.
This balanced approach aligns with sustainable long-term value creation. The moderate payout ratio and steady yield indicate prudent capital allocation, while buybacks enhance shareholder returns without risking excessive distributions.
Score analysis
This radar chart illustrates Fifth Third Bancorp’s key financial metric scores for a comprehensive overview:

Fifth Third Bancorp scores favorably on discounted cash flow and return on equity, indicating strong profitability. Return on assets is moderate. However, debt to equity, price to earnings, and price to book ratios are unfavorable, signaling valuation and leverage concerns.
Analysis of the company’s bankruptcy risk
The Altman Z-Score places Fifth Third Bancorp firmly in the distress zone, suggesting a high risk of financial distress and potential bankruptcy:

Is the company in good financial health?
The Piotroski Score diagram highlights Fifth Third Bancorp’s financial strength based on nine criteria:

With a Piotroski Score of 7, the company demonstrates strong financial health, reflecting solid profitability, efficiency, and balance sheet improvements despite some risk factors.
Competitive Landscape & Sector Positioning
This section examines Fifth Third Bancorp’s strategic positioning, revenue segments, key products, and main competitors. I will assess whether the company holds a competitive advantage within the regional banking sector.
Strategic Positioning
Fifth Third Bancorp operates a diversified financial services portfolio, including commercial, branch, consumer lending, and wealth management. Geographically, it focuses on the US Midwest and Southeast with 1,117 branches and 2,322 ATMs, balancing retail and institutional client segments.
Revenue by Segment
The pie chart illustrates Fifth Third Bancorp’s revenue distribution across key segments for the fiscal year 2025, highlighting the latest business drivers.

In 2025, Commercial Banking and Branch Banking dominate revenue, generating $553M and $569M respectively. Wealth and Asset Management contributes marginally with $2M, signaling a shift or possible reclassification. Compared to prior years, focus appears concentrated on core banking operations, with a notable slowdown in wealth management revenue. This concentration raises concentration risk but reflects strategic prioritization amid evolving market conditions.
Key Products & Brands
The table below outlines Fifth Third Bancorp’s main products and brands by segment and function:
| Product | Description |
|---|---|
| Commercial Banking | Credit intermediation, cash management, lending, foreign exchange, trade finance, capital markets, and leasing for businesses and government clients. |
| Branch Banking | Deposit and loan products for individuals and small businesses, including checking, savings, credit cards, and auto loans. |
| Consumer Lending | Residential mortgage origination and servicing, home equity loans and lines of credit, and indirect consumer loans via dealers. |
| Wealth & Asset Management | Investment alternatives, retail brokerage, wealth planning, trust and estate services, and advisory for individuals and institutions. |
Fifth Third Bancorp maintains a diversified product mix across commercial, consumer, and wealth management services. This multi-segment approach supports stable revenue streams despite market fluctuations.
Main Competitors
The Financial Services sector includes 9 main competitors; here are the top 9 leaders by market capitalization:
| Competitor | Market Cap. |
|---|---|
| U.S. Bancorp | 83.8B |
| The PNC Financial Services Group, Inc. | 82.9B |
| Truist Financial Corporation | 64.6B |
| Fifth Third Bancorp | 31.5B |
| M&T Bank Corporation | 31.4B |
| Huntington Bancshares Incorporated | 25.5B |
| Citizens Financial Group, Inc. | 25.5B |
| Regions Financial Corporation | 24.9B |
| KeyCorp | 22.9B |
Fifth Third Bancorp ranks 4th among its peers. Its market cap is 39.6% of the leader, U.S. Bancorp. The company sits below the average market cap of the top 10 (43.7B) but above the sector median (31.4B). It holds a 94.7% gap above the next competitor, Truist Financial, showing a significant lead over its closest rival.
Comparisons with competitors
Check out how we compare the company to its competitors:
Does Fifth Third Bancorp have a competitive advantage?
Fifth Third Bancorp currently lacks a strong competitive advantage, as it is shedding value with a ROIC below its WACC, despite showing a growing profitability trend. This slightly unfavorable moat signals challenges in efficiently using invested capital to generate excess returns.
Looking ahead, the company’s diverse financial services and regional presence may offer opportunities to expand markets and products. Continued profitability improvement could help Fifth Third strengthen its competitive position over time.
SWOT Analysis
This SWOT analysis highlights Fifth Third Bancorp’s core competitive position and challenges to guide strategic focus.
Strengths
- diversified financial services
- strong gross and net margins
- favorable dividend yield
Weaknesses
- low current ratio signals liquidity risk
- interest expense high relative to income
- ROIC below WACC indicates value destruction
Opportunities
- growing ROIC trend suggests improving profitability
- expanding wealth management segment
- digital transformation potential
Threats
- economic downturn risks impacting loan portfolios
- regulatory changes in banking sector
- rising interest rates increasing funding costs
Fifth Third Bancorp’s strengths in margin management and diversification provide a solid base. However, liquidity issues and value destruction are red flags. The company must leverage profitability gains and digital growth to offset macroeconomic and regulatory threats.
Stock Price Action Analysis
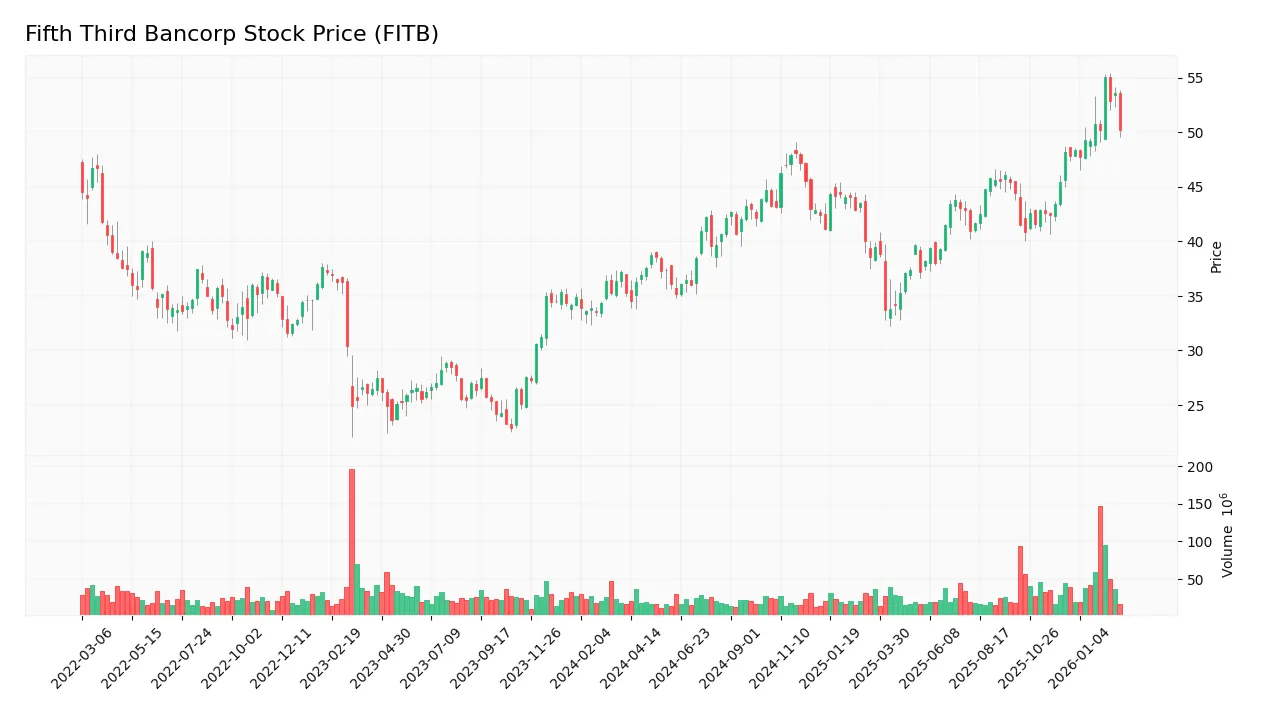
The weekly stock chart below illustrates Fifth Third Bancorp’s price movements and key levels over the past 100 weeks:
Trend Analysis
Over the past 100 weeks, Fifth Third Bancorp’s stock rose 42.21%, indicating a strong bullish trend with accelerating momentum. The price ranged between 33.75 and 55.08, with volatility measured by a 4.51 standard deviation. Recent three-month gains of 4.26% reinforce continued positive momentum with a moderate upward slope of 0.51.
Volume Analysis
Total volume reached 3.23B shares, with buyers accounting for 52.2%, reflecting a buyer-driven market and increasing participation. However, in the recent three months, sellers slightly outpaced buyers at 51.71%, suggesting more neutral investor activity and balanced supply-demand dynamics.
Target Prices
Analysts set a clear target consensus for Fifth Third Bancorp, reflecting moderate upside potential.
| Target Low | Target High | Consensus |
|---|---|---|
| 50 | 61 | 56.9 |
The target range between 50 and 61 signals analysts expect steady appreciation, with a consensus price near 57. This suggests cautious optimism amid sector volatility.

Don’t Let Luck Decide Your Entry Point
Optimize your entry points with our advanced ProRealTime indicators. You’ll get efficient buy signals with precise price targets for maximum performance. Start outperforming now!
Analyst & Consumer Opinions
This section examines the latest analyst ratings and consumer feedback on Fifth Third Bancorp’s performance and reputation.
Stock Grades
Here are the latest verified stock grades for Fifth Third Bancorp from leading financial firms and their recent actions:
| Grading Company | Action | New Grade | Date |
|---|---|---|---|
| Evercore ISI Group | maintain | In Line | 2026-02-05 |
| TD Cowen | maintain | Buy | 2026-02-03 |
| Truist Securities | maintain | Buy | 2026-01-26 |
| DA Davidson | maintain | Buy | 2026-01-26 |
| Citigroup | maintain | Neutral | 2026-01-23 |
| Keefe, Bruyette & Woods | maintain | Market Perform | 2026-01-21 |
| RBC Capital | maintain | Outperform | 2026-01-21 |
| TD Cowen | maintain | Buy | 2026-01-07 |
| Barclays | maintain | Overweight | 2026-01-05 |
| Truist Securities | maintain | Buy | 2025-12-22 |
The consensus leans toward a “Buy” rating with a strong majority maintaining positive outlooks. Few hold or neutral ratings suggest cautious optimism across analysts.
Consumer Opinions
Fifth Third Bancorp garners mixed consumer sentiment, reflecting a balance between service strengths and operational challenges.
| Positive Reviews | Negative Reviews |
|---|---|
| Friendly and helpful customer service staff. | Long wait times for loan approvals. |
| Convenient branch locations and ATM network. | Occasional issues with online banking interface. |
| Competitive interest rates on savings accounts. | Fees perceived as higher compared to peers. |
Overall, customers appreciate Fifth Third’s accessible branches and courteous service. However, slow loan processing and digital platform glitches remain common complaints, signaling areas needing strategic focus.
Risk Analysis
Below is a summary table of key risks facing Fifth Third Bancorp (FITB) as of 2026:
| Category | Description | Probability | Impact |
|---|---|---|---|
| Financial Distress | Altman Z-Score at 0.20 signals high bankruptcy risk, indicating serious financial strain. | High | High |
| Liquidity | Current ratio of 0.82 is below 1, signaling possible difficulty meeting short-term obligations. | Medium | Medium |
| Profitability | ROIC (8.9%) below WACC (12.17%) reveals value destruction, threatening long-term returns. | Medium | High |
| Debt Management | Debt-to-equity score unfavorable; debt levels may impair flexibility in rising rate environment. | Medium | Medium |
| Market Valuation | Low P/E and P/B scores imply undervaluation, but could reflect underlying risks and uncertainties. | Medium | Medium |
| Interest Coverage | Coverage ratio of 0.82 signals vulnerability to rising interest expenses and refinancing risk. | Medium | High |
The most alarming risk is the extremely low Altman Z-Score, placing FITB in the distress zone. This flags elevated bankruptcy risk despite a strong Piotroski score of 7. Additionally, the company’s ROIC fails to cover its WACC, a red flag for capital allocation inefficiency. Liquidity and interest coverage metrics also raise caution in a tightening rate environment. Investors must weigh these risks against the bank’s moderately favorable dividend yield and regional banking moat.
Should You Buy Fifth Third Bancorp?
Fifth Third Bancorp appears to be in a moderate profitability phase with improving operational efficiency, despite a slightly unfavorable moat indicating value erosion. Its substantial leverage profile suggests caution. The overall B rating reflects a very favorable but nuanced investment profile.
Strength & Efficiency Pillars
Fifth Third Bancorp shows operational strength with a robust gross margin of 65.29% and a solid net margin of 19.61%. EBIT margin stands at a favorable 24.95%, reflecting efficient core business activities. Return on equity at 11.61% and return on invested capital (ROIC) at 8.9% indicate moderate profitability. However, with a weighted average cost of capital (WACC) at 12.17%, ROIC falls short, signaling the company is currently shedding value despite improving profitability trends.
Weaknesses and Drawbacks
The company is in financial distress, as indicated by an alarming Altman Z-Score of 0.20, placing it firmly in the Distress Zone with heightened bankruptcy risk. Leverage metrics raise red flags: a low current ratio of 0.82 suggests liquidity constraints, and interest coverage is critically weak at 0.82x. Although P/E (12.33) and P/B (1.43) ratios appear reasonable, the distressed solvency profile overshadows valuation comfort. Recent slight seller dominance (51.71% sellers) adds short-term market pressure risks.
Our Final Verdict about Fifth Third Bancorp
Despite operational profitability, Fifth Third Bancorp’s severe solvency risk, reflected by its Altman Z-Score of 0.20, renders the investment profile highly speculative. The significant bankruptcy threat outweighs its margins and improving ROIC trend. Conservative capital should avoid exposure until financial health stabilizes. This situation might appear too risky for risk-averse investors despite favorable earnings growth signals.
Disclaimer: This content is for informational purposes only and does not constitute financial, investment, or other professional advice. Investing in financial markets involves a significant risk of loss, and past performance is not indicative of future results.
Additional Resources
- Assessing Fifth Third Bancorp (FITB) Valuation After Recent Analyst Upgrades And Constructive Outlook – simplywall.st (Feb 25, 2026)
- Fifth Third Bancorp to Participate in the RBC Capital Markets Financial Institutions Conference – Business Wire (Feb 24, 2026)
- Decoding Fifth Third Bancorp (FITB): A Strategic SWOT Insight – GuruFocus (Feb 25, 2026)
- A Look At Fifth Third Bancorp (FITB) Valuation After Analyst Upgrades And Strong Quarterly Results – Yahoo Finance (Feb 22, 2026)
- FIFTH THIRD BANCORP SEC 10-K Report – TradingView (Feb 24, 2026)
For more information about Fifth Third Bancorp, please visit the official website: 53.com