Home > Analyses > Industrials > FedEx Corporation
FedEx Corporation revolutionizes global commerce by connecting millions of people and businesses through its comprehensive logistics network. As a dominant force in integrated freight and logistics, FedEx leads with its express transportation, ground delivery, and freight services, backed by cutting-edge technology and a customer-centric approach. Renowned for innovation and operational excellence, FedEx shapes how goods move worldwide. Yet, with evolving market dynamics, investors must assess whether its current fundamentals sustain its ambitious growth trajectory and valuation.

Table of contents
Business Model & Company Overview
FedEx Corporation, founded in 1971 and headquartered in Memphis, Tennessee, commands a dominant position in the integrated freight and logistics industry. Its ecosystem spans express transportation, ground delivery, less-than-truckload freight, and extensive support services, creating a cohesive mission to enable seamless global commerce. Employing over 306K individuals, FedEx integrates technology and logistics to serve a vast international customer base.
The company’s revenue engine balances hardware, such as its fleet of 30K vehicles, with software-driven services including e-commerce solutions and supply chain management. FedEx maintains a strategic presence across the Americas, Europe, and Asia, leveraging its extensive network and service centers. This robust infrastructure and service integration form a powerful economic moat, positioning FedEx as a key architect of the logistics sector’s future.
Financial Performance & Fundamental Metrics
In this section, I analyze FedEx Corporation’s income statement, key financial ratios, and dividend payout policy to assess its financial health and investment potential.
Income Statement
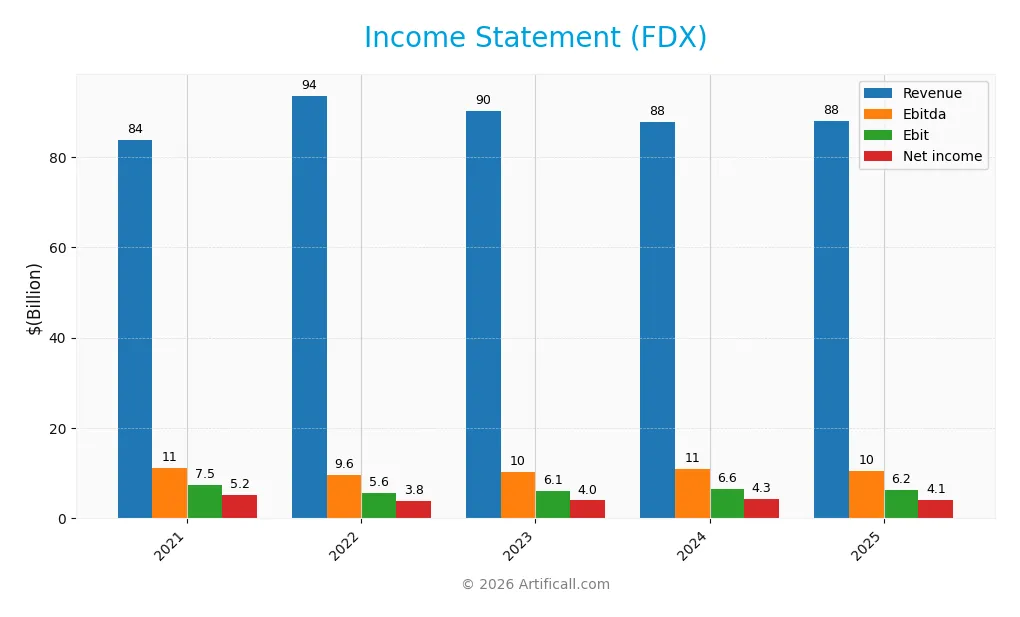
The table below summarizes FedEx Corporation’s key income statement figures for fiscal years 2021 through 2025 in USD.
| 2021 | 2022 | 2023 | 2024 | 2025 | |
|---|---|---|---|---|---|
| Revenue | 83.8B | 93.5B | 90.2B | 87.7B | 87.9B |
| Cost of Revenue | 66.0B | 73.3B | 71.0B | 68.7B | 68.9B |
| Operating Expenses | 11.8B | 13.6B | 13.8B | 12.6B | 12.9B |
| Gross Profit | 17.8B | 20.2B | 19.2B | 18.9B | 19.0B |
| EBITDA | 11.3B | 9.6B | 10.2B | 10.9B | 10.5B |
| EBIT | 7.5B | 5.6B | 6.1B | 6.6B | 6.2B |
| Interest Expense | 0.8B | 0.7B | 0.7B | 0.7B | 0.8B |
| Net Income | 5.2B | 3.8B | 4.0B | 4.3B | 4.1B |
| EPS | 19.77 | 14.52 | 15.61 | 17.44 | 16.96 |
| Filing Date | 2021-07-19 | 2022-07-18 | 2023-07-17 | 2024-07-15 | 2025-07-21 |
Income Statement Evolution
From 2021 to 2025, FedEx’s revenue showed a slight overall increase of 4.93%, with a marginal growth of 0.27% in the last year, indicating slowing top-line momentum. Gross profit remained relatively stable, reflecting a favorable gross margin of 21.6%. However, EBIT and net income margins declined, with EBIT margin neutral at 7.09% and net margin slightly lower at 4.65%, signaling pressure on profitability despite steady revenue.
Is the Income Statement Favorable?
The 2025 income statement reveals neutral to unfavorable fundamentals. Revenue growth slowed to 0.27%, while net income decreased by 5.77%, contributing to an overall unfavorable net margin trend. Interest expense remains favorable at 0.9% of revenue, supporting stable financing costs. Despite a solid gross margin, declines in EBIT and net income growth, alongside shrinking EPS, suggest challenges in operational efficiency and profitability during the most recent fiscal year.
Financial Ratios
The table below presents key financial ratios for FedEx Corporation (FDX) over the fiscal years 2021 to 2025, offering insight into profitability, valuation, liquidity, leverage, and efficiency:
| Ratios | 2021 | 2022 | 2023 | 2024 | 2025 |
|---|---|---|---|---|---|
| Net Margin | 6.24% | 4.09% | 4.41% | 4.94% | 4.65% |
| ROE | 21.64% | 15.34% | 15.23% | 15.70% | 14.58% |
| ROIC | 6.60%* | 6.87%* | 5.20%* | 6.19%* | 6.00%* |
| P/E | 15.69 | 15.44 | 13.94 | 14.54 | 12.95 |
| P/B | 3.40 | 2.37 | 2.12 | 2.28 | 1.89 |
| Current Ratio | 1.51 | 1.43 | 1.37 | 1.36 | 1.19 |
| Quick Ratio | 1.46 | 1.38 | 1.32 | 1.32 | 1.15 |
| D/E | 1.51 | 1.49 | 1.47 | 1.37 | 1.33 |
| Debt-to-Assets | 44.05% | 43.25% | 44.00% | 43.35% | 42.70% |
| Interest Coverage | 7.59 | 9.47 | 7.69 | 8.53 | 7.71 |
| Asset Turnover | 1.01 | 1.09 | 1.03 | 1.01 | 1.00 |
| Fixed Asset Turnover | 1.64 | 1.71 | 1.55 | 1.50 | 1.51 |
| Dividend Yield | 0.84% | 1.34% | 2.13% | 2.00% | 2.53% |
*ROIC approximated using Return on Invested Capital figures provided for fiscal years 2021 to 2025.
All ratios are based on reported fiscal year-end data in USD and rounded to two decimals or nearest percentage points for clarity.
Evolution of Financial Ratios
From 2021 to 2025, FedEx Corporation’s Return on Equity (ROE) exhibited a declining trend from 21.64% to 14.58%, indicating reduced profitability efficiency. The Current Ratio decreased from 1.51 to 1.19, reflecting a slight weakening in short-term liquidity. Debt-to-Equity Ratio remained relatively stable but high, around 1.33 in 2025, signaling consistent leverage usage. Profitability margins showed minor fluctuations, with net profit margin falling to 4.65% in 2025.
Are the Financial Ratios Fovorable?
In 2025, FedEx’s profitability is mixed: ROE and Return on Invested Capital are neutral, but net margin is unfavorable at 4.65%. Liquidity ratios are generally neutral to favorable, with a current ratio of 1.19 (neutral) and quick ratio of 1.15 (favorable). Leverage ratios show some concern with a debt-to-equity of 1.33 (unfavorable), yet interest coverage is favorable at 7.9. Asset turnover and dividend yield are favorable, contributing to an overall slightly favorable financial ratios evaluation.
Shareholder Return Policy
FedEx Corporation maintains a consistent dividend payout with a ratio around 30%, supported by free cash flow coverage above 1.3x and a dividend yield near 2.5%. The dividend per share has steadily increased from $2.60 in 2021 to $5.51 in 2025, complemented by share buyback programs.
This balanced approach reflects moderate payout growth alongside capital returns, underpinned by positive net income and cash flow metrics. The policy appears aligned with sustainable long-term value creation, avoiding excessive distributions or buybacks that might strain financial flexibility.
Score analysis
The following radar chart presents a comprehensive view of FedEx Corporation’s key financial scores:
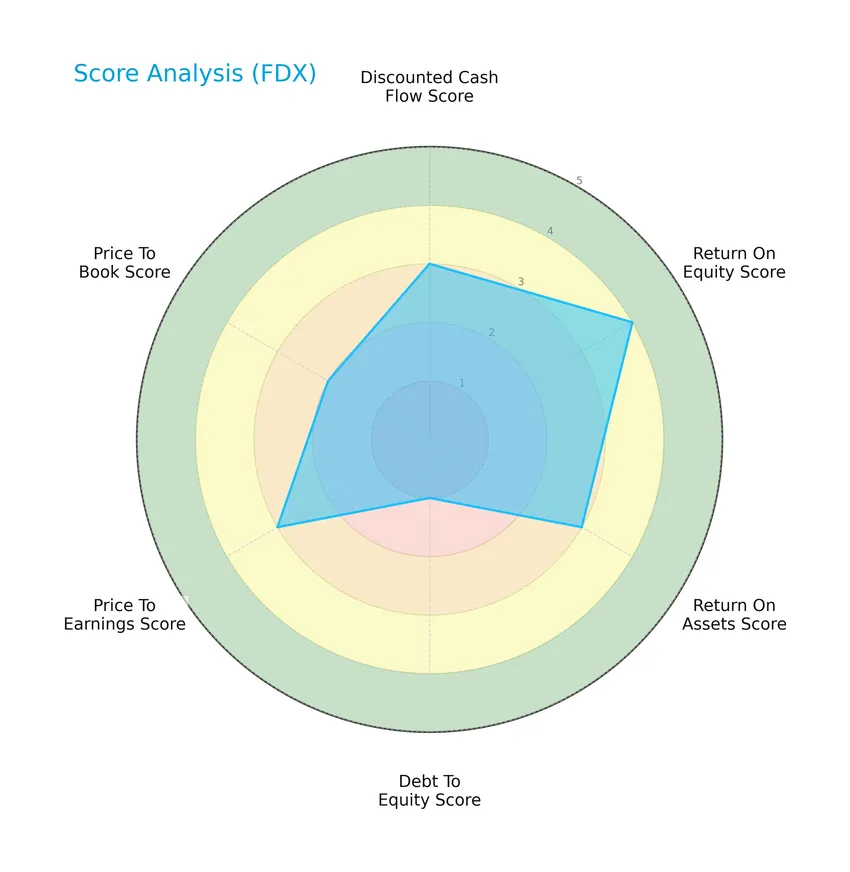
FedEx shows a moderate discounted cash flow and return on assets scores, alongside a favorable return on equity. The debt-to-equity score is very unfavorable, while price-to-earnings and price-to-book scores remain moderate, indicating mixed financial metrics.
Analysis of the company’s bankruptcy risk
FedEx’s Altman Z-Score positions the company in the grey zone, suggesting a moderate risk of bankruptcy and financial distress:

Is the company in good financial health?
The Piotroski Score diagram illustrates FedEx’s financial strength based on nine critical criteria:

With a score of 7, FedEx demonstrates strong financial health, reflecting solid profitability, leverage, and liquidity indicators consistent with resilient fundamentals.
Competitive Landscape & Sector Positioning
This sector analysis will examine FedEx Corporation’s strategic positioning, revenue segments, key products, main competitors, and overall market context. I will assess whether FedEx holds competitive advantages compared to its industry peers through a detailed SWOT analysis.
Strategic Positioning
FedEx Corporation maintains a diversified product portfolio across express, ground, freight, and service segments, generating significant revenue from both U.S. (approximately $63B in 2025) and international markets ($25B). Its integrated freight and logistics operations span multiple transportation and supply chain solutions.
Revenue by Segment
This pie chart illustrates FedEx Corporation’s revenue distribution by segment for the fiscal year 2025, highlighting the company’s key income sources.
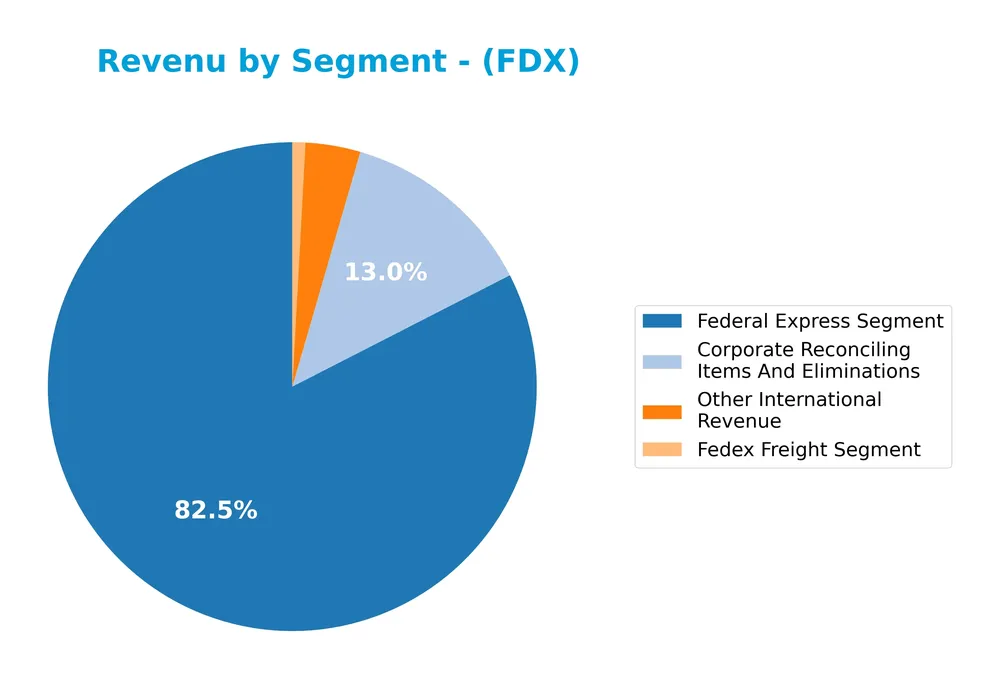
In 2025, FedEx’s Federal Express Segment dominated with $23.7B, showing its core business strength. The FedEx Freight Segment and Other International Revenue were significantly smaller at $247M and $1.04B respectively, indicating limited contribution. Corporate Reconciling Items and Eliminations accounted for $3.73B. The data suggests a concentration of revenue in express shipping, with other segments playing minor roles and no major growth shifts in the latest year.
Key Products & Brands
The following table details FedEx Corporation’s main products and services as of fiscal year 2025:
| Product | Description |
|---|---|
| FedEx Express Segment | Provides express transportation, small-package ground delivery, freight transportation, time-critical services, and e-commerce solutions. |
| FedEx Ground Segment | Offers day-certain delivery services to businesses and residences. |
| FedEx Freight Segment | Specializes in less-than-truckload freight transportation services with around 30,000 vehicles and 400 service centers (2022 data). |
| FedEx Services Segment | Delivers sales, marketing, IT, communications, customer service, technical support, billing, collection, and back-office support services. |
| Corporate, Other and Eliminations | Covers integrated supply chain management, specialty transportation, customs brokerage, global ocean and air freight forwarding, document and business services. |
FedEx’s diversified portfolio covers express and ground deliveries, freight, and comprehensive business support services, forming a broad logistics and transportation platform.
Main Competitors
There are 5 main competitors in the Integrated Freight & Logistics industry; below are the top 10 leaders by market capitalization:
| Competitor | Market Cap. |
|---|---|
| United Parcel Service, Inc. | 85.7B |
| FedEx Corporation | 69.2B |
| Expeditors International of Washington, Inc. | 20.8B |
| C.H. Robinson Worldwide, Inc. | 19.3B |
| J.B. Hunt Transport Services, Inc. | 18.7B |
FedEx Corporation ranks 2nd among its competitors with a market cap at 83.75% of the leader, United Parcel Service. It stands above both the average market cap of the top 10 (42.8B) and the sector median (20.8B). The +19.4% distance to UPS highlights a notable gap between FedEx and the top competitor.
Comparisons with competitors
Check out how we compare the company to its competitors:
Does FDX have a competitive advantage?
FedEx Corporation does not currently present a competitive advantage, as it is shedding value with a ROIC below its WACC and a declining ROIC trend over the 2021-2025 period. The company’s profitability metrics, including net margin and EBIT margin, remain neutral to unfavorable, reflecting challenges in sustaining high returns on invested capital.
Looking ahead, FedEx’s diverse segments in express transportation, ground delivery, freight, and integrated supply chain solutions offer potential growth opportunities in expanding e-commerce and cross-border logistics markets. However, recent revenue growth has been weak, and net income trends are negative, suggesting caution in evaluating future competitive positioning.
SWOT Analysis
This analysis highlights FedEx Corporation’s key strategic factors to assist investors in making informed decisions.
Strengths
- strong market position in integrated freight and logistics
- diversified service segments including express, ground, freight, and e-commerce
- solid dividend yield of 2.53%
Weaknesses
- declining net income and EPS growth over recent years
- high debt-to-equity ratio at 1.33
- negative ROIC trend indicating value destruction
Opportunities
- growth potential in global e-commerce and cross-border logistics
- technology integration for enhanced supply chain solutions
- expanding international revenues outside the US
Threats
- intense competition from global logistics and delivery firms
- economic slowdown impacting shipping volumes
- rising fuel and labor costs affecting margins
FedEx’s robust market presence and diversified services provide a solid foundation, but profitability challenges and high leverage require careful monitoring. Strategic focus on innovation and international expansion can drive growth, while managing cost pressures and competition is critical for sustained performance.
Stock Price Action Analysis
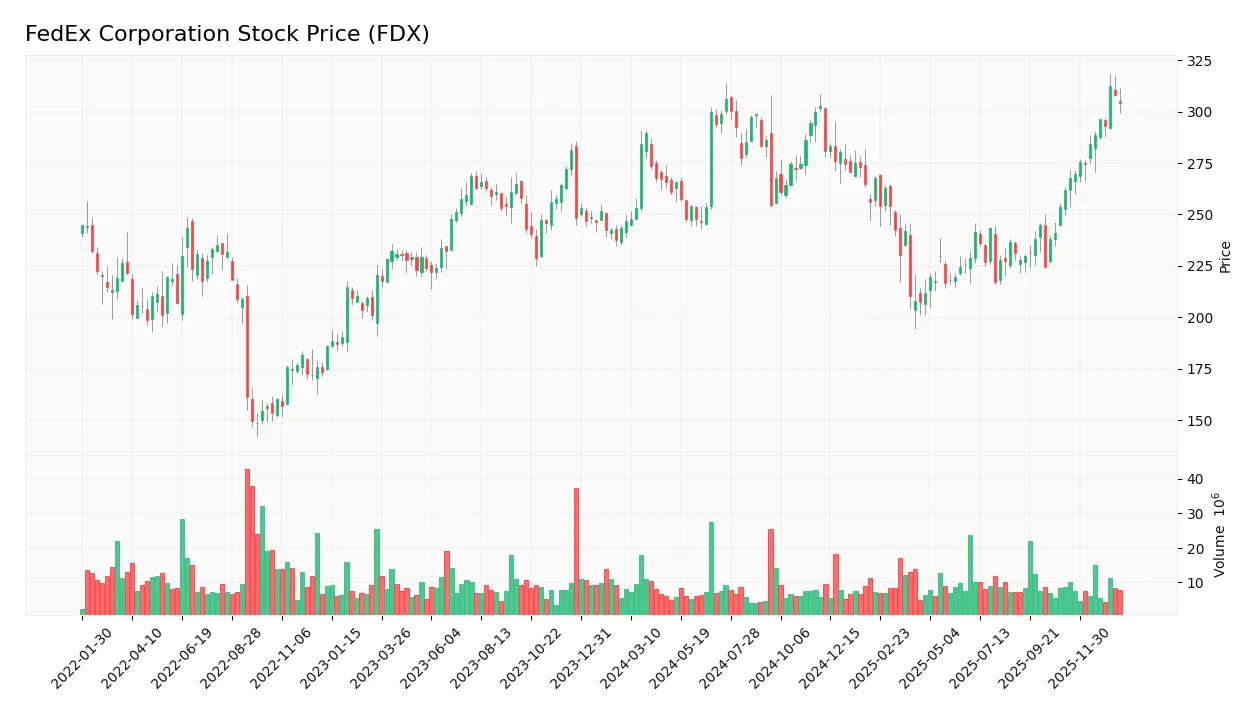
The following weekly stock chart illustrates FedEx Corporation’s price movements over the past 100 weeks, highlighting recent volatility and key price levels:
Trend Analysis
Over the past 12 months, FedEx’s stock price increased by 23.36%, indicating a bullish trend with acceleration. The price fluctuated between a low of 207.55 and a high of 312.36, while volatility measured by a standard deviation of 27.38 suggests notable price swings.
Volume Analysis
In the last three months, trading volume shows a decreasing trend overall, but buyer activity has been strongly dominant, with 71% of volume attributable to buyers. This suggests positive investor sentiment and selective market participation despite the declining volume.
Target Prices
The consensus target price for FedEx Corporation reflects cautious optimism among analysts.
| Target High | Target Low | Consensus |
|---|---|---|
| 355 | 210 | 294.07 |
Analysts expect FedEx’s stock price to range between 210 and 355, with an average consensus near 294, indicating moderate upside potential balanced by some downside risk.

Don’t Let Luck Decide Your Entry Point
Optimize your entry points with our advanced ProRealTime indicators. You’ll get efficient buy signals with precise price targets for maximum performance. Start outperforming now!
Analyst & Consumer Opinions
This section reviews the latest analyst ratings and consumer feedback concerning FedEx Corporation (FDX) performance and reputation.
Stock Grades
Here is the latest summary of FedEx Corporation’s stock ratings from recognized financial analysts and institutions:
| Grading Company | Action | New Grade | Date |
|---|---|---|---|
| Rothschild & Co | Downgrade | Neutral | 2026-01-21 |
| Bernstein | Maintain | Market Perform | 2026-01-09 |
| Morgan Stanley | Maintain | Underweight | 2025-12-19 |
| Stifel | Maintain | Buy | 2025-12-19 |
| Citigroup | Maintain | Buy | 2025-12-19 |
| B of A Securities | Maintain | Neutral | 2025-12-19 |
| Stephens & Co. | Maintain | Overweight | 2025-12-19 |
| Truist Securities | Maintain | Buy | 2025-12-19 |
| Jefferies | Maintain | Buy | 2025-12-19 |
| Wells Fargo | Maintain | Equal Weight | 2025-12-19 |
The overall trend shows a mostly stable outlook with several firms maintaining Buy or Overweight ratings, though Rothschild & Co recently downgraded the stock to Neutral. The consensus remains positive with a Buy rating supported by 25 analysts against 3 Sell opinions.
Consumer Opinions
FedEx Corporation continues to evoke a mix of praise and criticism from its customer base, reflecting varied experiences across its global services.
| Positive Reviews | Negative Reviews |
|---|---|
| Reliable and timely delivery, especially for overnight shipments. | Occasional delays during peak seasons causing frustration. |
| Friendly and professional customer service representatives. | Tracking system sometimes lacks real-time updates. |
| Wide range of shipping options catering to different needs. | Pricing can be higher compared to competitors. |
Overall, consumers appreciate FedEx’s dependable delivery and service quality, while common concerns include sporadic delays and pricing issues. These insights suggest strengths in reliability but highlight opportunities for improving transparency and cost competitiveness.
Risk Analysis
Below is a summary table highlighting key risks associated with investing in FedEx Corporation (FDX), focusing on their likelihood and potential impact:
| Category | Description | Probability | Impact |
|---|---|---|---|
| Financial Health | Moderate bankruptcy risk indicated by Altman Z-Score in grey zone | Medium | High |
| Debt Levels | High debt-to-equity ratio (1.33) increases financial leverage risk | High | Medium |
| Market Volatility | Beta of 1.357 suggests above-average stock price fluctuations | High | Medium |
| Profitability | Unfavorable net margin (4.65%) limits earnings growth potential | Medium | Medium |
| Economic Sensitivity | Exposure to global trade and economic cycles affects revenue | Medium | High |
| Operational Risks | Supply chain disruptions or increased fuel costs impact margins | Medium | Medium |
The most significant risks are FedEx’s relatively high debt burden and moderate financial distress signals, as reflected by its Altman Z-Score near the grey zone. Market volatility also poses notable risk given the stock’s beta above 1.3. Investors should monitor economic conditions and debt management closely when considering FedEx for their portfolio.
Should You Buy FedEx Corporation?
FedEx Corporation appears to be navigating a complex financial landscape with moderate profitability and a very unfavorable moat marked by declining value creation. Despite a manageable leverage profile, its overall rating of B suggests cautious optimism, warranting close risk assessment.
Strength & Efficiency Pillars
FedEx Corporation exhibits moderate profitability with a net margin of 4.65% and a return on equity (ROE) of 14.58%, reflecting stable but unexceptional earnings efficiency. Its return on invested capital (ROIC) stands at 6.0%, slightly below the weighted average cost of capital (WACC) at 7.78%, indicating the company is currently not a value creator but maintains operational stability. Financial health measures present a mixed outlook: the Altman Z-Score of 2.67 places FedEx in the grey zone for bankruptcy risk, while a strong Piotroski score of 7 suggests robust internal financial discipline and strength.
Weaknesses and Drawbacks
Significant concerns arise from FedEx’s leverage with a debt-to-equity ratio of 1.33, flagged as very unfavorable, implying heightened financial risk and potential vulnerability to interest rate fluctuations. Valuation metrics such as a price-to-earnings (P/E) ratio of 12.95 are favorable, yet the price-to-book (P/B) ratio of 1.89 is neutral, signaling moderate market expectations. Additionally, recent income trends are unfavorable: revenue growth is nearly stagnant at 0.27%, EBIT declined by 5.33%, and net margin contracted by 5.77%, reflecting operational pressures. The moderate current ratio of 1.19 suggests limited short-term liquidity buffer.
Our Verdict about FedEx Corporation
FedEx’s long-term fundamental profile may appear moderately favorable given its financial discipline and stable profitability metrics. Combined with a bullish overall stock trend marked by a 23.36% price increase and strong buyer dominance (70.97%) in recent periods, the profile suggests potential upside. However, challenges from leverage and ongoing profitability erosion imply that investors could approach with caution, balancing growth prospects against financial risks. The current momentum might suggest a cautiously optimistic stance for long-term exposure.
Disclaimer: This content is for informational purposes only and does not constitute financial, investment, or other professional advice. Investing in financial markets involves a significant risk of loss, and past performance is not indicative of future results.
Additional Resources
- Y Intercept Hong Kong Ltd Buys 20,992 Shares of FedEx Corporation $FDX – MarketBeat (Jan 24, 2026)
- FedEx (FDX) CEO is doing a terrific job, says Jim Cramer – MSN (Jan 22, 2026)
- FedEx shares bold operational transformation plan to secure long-term competitiveness in France – FedEx newsroom (Jan 23, 2026)
- Top Superinvestors Are Buying FedEx Corp (FDX) – The Acquirer’s Multiple (Jan 19, 2026)
- FedEx Details French Operations Overhaul, Job Cuts Expected – FedEx (NYSE:FDX) – Benzinga (Jan 23, 2026)
For more information about FedEx Corporation, please visit the official website: fedex.com