Home > Analyses > Real Estate > Federal Realty Investment Trust
Federal Realty Investment Trust transforms urban retail landscapes into vibrant community hubs that blend shopping, dining, living, and working. With a portfolio spanning major coastal markets and iconic mixed-use developments like Santana Row and Assembly Row, it sets the standard for quality and innovation in retail real estate. As a stalwart of the S&P 500 with 54 years of dividend growth, I ask: does Federal Realty’s strong foundation still justify its premium valuation and future growth prospects?

Table of contents
Business Model & Company Overview
Federal Realty Investment Trust, founded in 1962 and headquartered in North Bethesda, MD, dominates the retail real estate sector. The company focuses on owning, operating, and redeveloping high-quality retail properties primarily along major U.S. coastal markets. Its portfolio creates vibrant urban, mixed-use neighborhoods that blend shopping, dining, living, and working, offering a cohesive community experience valued by tenants and residents alike. With 106 properties spanning 25M square feet and 3,200 residential units, Federal Realty sustains long-term growth by investing where retail demand outpaces supply.
Federal Realty’s revenue engine balances retail leasing with residential development, generating steady cash flows across diverse, high-demand markets in the Americas. Its 3,100 tenants contribute recurring rental income underpinned by strategic coastal locations from Washington, D.C., to San Francisco. The company’s economic moat lies in its unique urban mixed-use expertise and a 54-year streak of quarterly dividend increases, underscoring durable shareholder value and industry leadership.
Financial Performance & Fundamental Metrics
I analyze Federal Realty Investment Trust’s income statement, key financial ratios, and dividend payout policy to assess its core financial health and shareholder value.
Income Statement
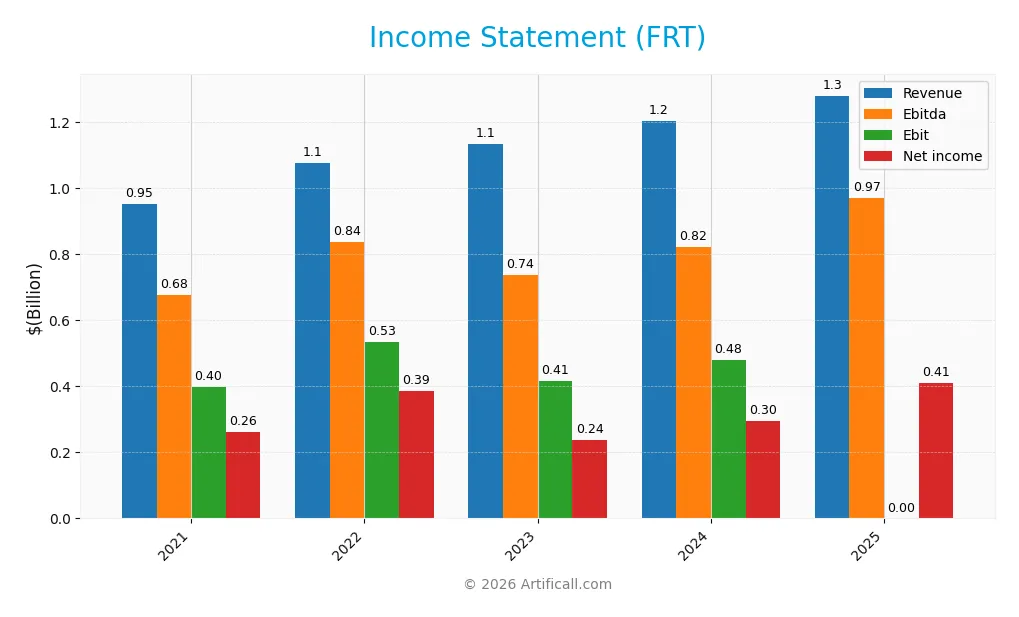
The table below summarizes Federal Realty Investment Trust’s key income statement figures over the past five fiscal years, highlighting trends in revenue, expenses, and profitability.
| 2021 | 2022 | 2023 | 2024 | 2025 | |
|---|---|---|---|---|---|
| Revenue | 951M | 1.07B | 1.13B | 1.20B | 1.28B |
| Cost of Revenue | 317M | 357M | 363M | 392M | 419M |
| Operating Expenses | 240M | 191M | 363M | 338M | 415M |
| Gross Profit | 635M | 718M | 769M | 811M | 860M |
| EBITDA | 677M | 835M | 737M | 822M | 970M |
| EBIT | 397M | 533M | 415M | 480M | 0 |
| Interest Expense | 128M | 137M | 168M | 175M | 184M |
| Net Income | 261M | 385M | 237M | 295M | 411M |
| EPS | 3.26 | 4.71 | 2.80 | 3.42 | 4.79 |
| Filing Date | 2022-02-10 | 2023-02-08 | 2024-02-12 | 2025-02-13 | 2026-02-12 |
Income Statement Evolution
Federal Realty Investment Trust’s revenue rose 34% from 2021 to 2025, with a 6.4% gain in the last year. Net income outpaced revenue, growing 57% over five years and 31% year-over-year. Gross margins held steady near 67%, reflecting consistent cost control. However, operating income fell sharply in 2025, dragging EBIT margin to zero.
Is the Income Statement Favorable?
The 2025 income statement shows solid fundamentals with a 32% net margin and strong EPS growth of 40%. Interest expense remains manageable at 14% of revenue, supporting profitability. Yet, the collapse in EBIT margin signals rising operating expenses, undermining core operating earnings. Overall, the statement leans favorable but flags potential operational efficiency risks.
Financial Ratios
The following table presents key financial ratios for Federal Realty Investment Trust (FRT) over the past five fiscal years:
| Ratios | 2021 | 2022 | 2023 | 2024 | 2025 |
|---|---|---|---|---|---|
| Net Margin | 27% | 36% | 21% | 25% | 32% |
| ROE | 10% | 13% | 8% | 9% | 13% |
| ROIC | 5% | 7% | 5% | 6% | 1% |
| P/E | 40.3 | 20.9 | 35.4 | 31.7 | 21.1 |
| P/B | 4.09 | 2.73 | 2.83 | 2.95 | 2.66 |
| Current Ratio | 0.98 | 0.95 | 1.55 | 1.16 | 0.31 |
| Quick Ratio | 0.98 | 0.95 | 1.55 | 1.16 | 0.31 |
| D/E | 1.62 | 1.51 | 1.58 | 1.44 | 0.35 |
| Debt-to-Assets | 55% | 54% | 56% | 54% | 13% |
| Interest Coverage | 3.09 | 3.84 | 2.42 | 2.69 | -3.28 |
| Asset Turnover | 0.12 | 0.13 | 0.13 | 0.14 | 0.14 |
| Fixed Asset Turnover | 6.77 | 7.67 | 12.06 | 13.01 | 14.29 |
| Dividend Yield | 3.18% | 4.30% | 4.29% | 3.97% | 4.48% |
Evolution of Financial Ratios
Return on Equity (ROE) showed fluctuations, peaking at 13.0% in 2022 before moderating to 12.65% in 2025. The Current Ratio declined sharply from above 1.5 in early years to 0.31 in 2025, indicating reduced liquidity. Debt-to-Equity Ratio improved significantly, dropping from 1.62 in 2021 to a conservative 0.35 in 2025. Profit margins generally expanded, with net margin rising to 32.14% in 2025, reflecting stronger profitability.
Are the Financial Ratios Favorable?
Profitability ratios such as net margin and Return on Invested Capital (ROIC) appear favorable, with ROIC at 134.81% exceeding the weighted average cost of capital (7.86%). Leverage is conservative, evidenced by a Debt-to-Equity ratio of 0.35 and low debt-to-assets at 12.5%. Liquidity ratios are unfavorable, with a current ratio of 0.31 signaling potential short-term risk. Efficiency metrics show mixed signals; fixed asset turnover is strong at 14.29, but overall asset turnover is weak at 0.14. Dividend yield at 4.48% is attractive. Overall, the ratio profile is slightly favorable.
Shareholder Return Policy
Federal Realty Investment Trust maintains a high dividend payout ratio near 94%, with a consistent dividend per share around $4.5, yielding approximately 4.5% annually. The dividends appear well covered by free cash flow, supporting a stable distribution.
The company also engages in share buybacks, complementing dividends as a shareholder return method. This balanced approach, backed by solid cash flow coverage, suggests a focus on sustainable long-term value creation despite potential risks from a high payout ratio.
Score analysis
The following radar chart displays key financial scores that reflect the company’s valuation and profitability metrics:
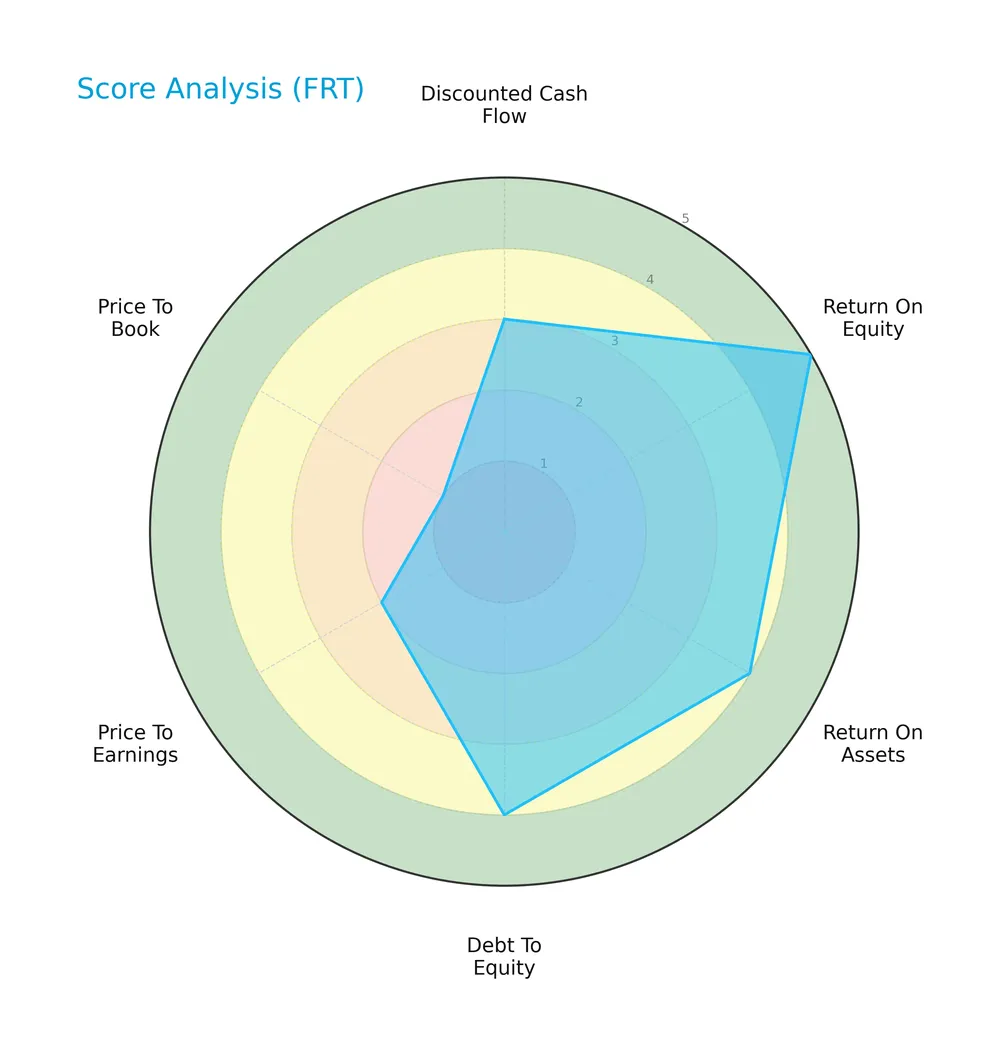
Federal Realty Investment Trust shows a moderate discounted cash flow score at 3 and strong profitability metrics with a return on equity score of 5 and return on assets score of 4. Its debt-to-equity score is favorable at 4, while valuation indicators price-to-earnings and price-to-book scores rank unfavorably at 2 and very unfavorable at 1, respectively.
Analysis of the company’s bankruptcy risk
The Altman Z-Score indicates Federal Realty Investment Trust is in the distress zone, signaling a high risk of financial distress and potential bankruptcy:

Is the company in good financial health?
The Piotroski Score diagram illustrates the company’s financial strength based on profitability, leverage, liquidity, and efficiency factors:

Federal Realty Investment Trust has an average Piotroski Score of 6, suggesting moderate financial health. This score reflects reasonable operational performance but leaves room for improvement compared to very strong companies scoring 8 or above.
Competitive Landscape & Sector Positioning
This section analyzes Federal Realty Investment Trust’s strategic positioning, revenue segments, key products, and main competitors. I will assess whether the company holds a competitive advantage within the retail REIT sector.
Strategic Positioning
Federal Realty Investment Trust concentrates on retail-focused commercial real estate, generating over 600M annually, with a smaller but growing residential segment near 70M in 2018. It operates mainly in major U.S. coastal markets, emphasizing urban mixed-use developments, reflecting a focused geographic and product strategy.
Revenue by Segment
This pie chart displays Federal Realty Investment Trust’s revenue distribution between Commercial and Residential Real Estate segments for the fiscal year 2018.
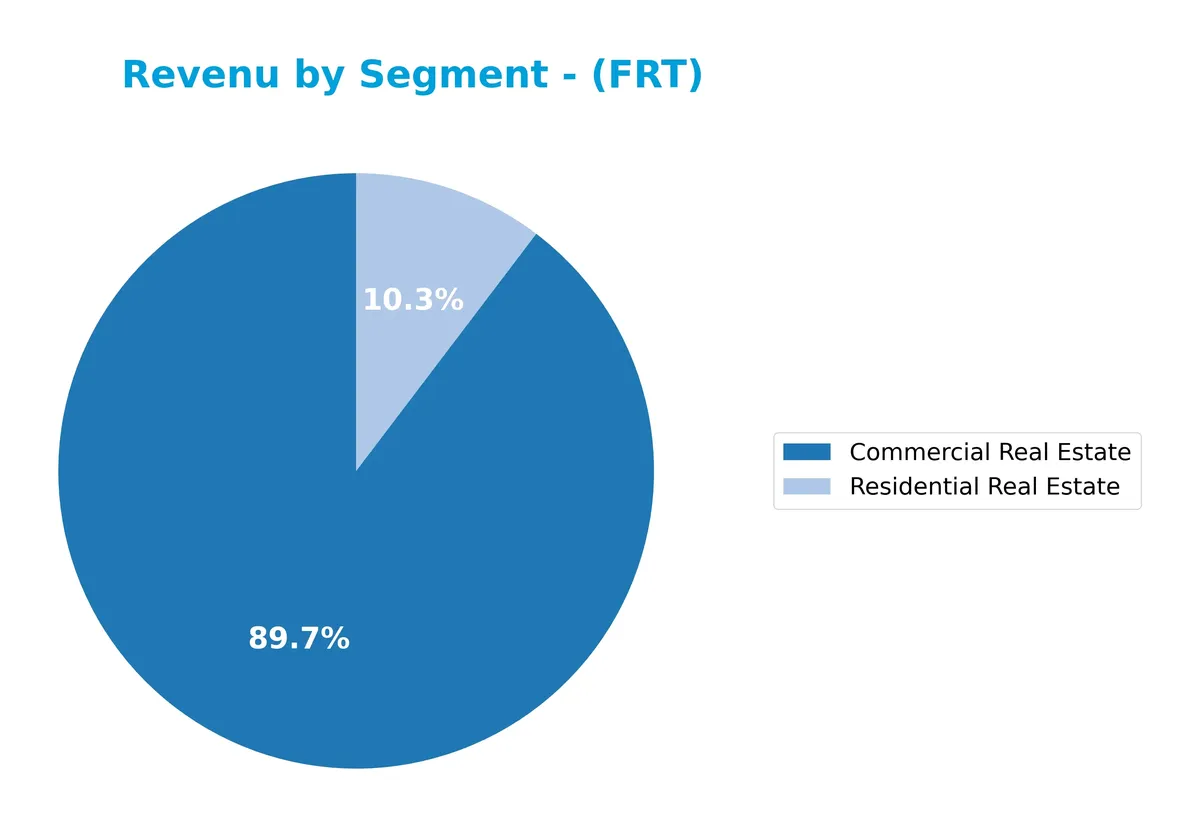
Commercial Real Estate dominates Federal Realty’s revenue, reaching $616M in 2018, up from $393M in 2011. Residential Real Estate, while smaller, grew steadily to $71M in 2018. The data shows consistent growth in both segments, with commercial properties driving the business. The 2018 figures highlight a solid expansion, but the heavy reliance on commercial real estate signals a concentration risk investors should monitor.
Key Products & Brands
Federal Realty Investment Trust generates revenue from these core real estate segments:
| Product | Description |
|---|---|
| Commercial Real Estate | Leasing and management of retail-based properties in prime coastal urban markets, totaling 25M sq ft. |
| Residential Real Estate | Residential units within mixed-use developments, approximately 3,200 units integrated with retail spaces. |
Federal Realty’s portfolio emphasizes high-quality retail properties complemented by residential units. This mixed-use strategy creates vibrant urban neighborhoods, enhancing tenant demand and community value. Commercial real estate dominates revenue, reflecting the firm’s retail focus.
Main Competitors
There are 5 competitors in the Real Estate REIT – Retail sector; the table lists the top 5 leaders by market capitalization:
| Competitor | Market Cap. |
|---|---|
| Simon Property Group, Inc. | 60B |
| Realty Income Corporation | 53B |
| Kimco Realty Corporation | 13.6B |
| Regency Centers Corporation | 12.3B |
| Federal Realty Investment Trust | 8.5B |
Federal Realty Investment Trust ranks 5th among its competitors with a market cap 15.05% the size of the leader, Simon Property Group. It sits below both the average market cap of 29.4B for the top 10 and the sector median of 13.6B. The company maintains a 36.5% gap below its next closest competitor, Regency Centers.
Comparisons with competitors
Check out how we compare the company to its competitors:
Does Federal Realty Investment Trust have a competitive advantage?
Federal Realty Investment Trust demonstrates a sustainable competitive advantage, consistently earning an ROIC well above its WACC and showing strong value creation. Its growing ROIC trend confirms increasing profitability and efficient capital use.
Looking ahead, Federal Realty’s focus on urban, mixed-use neighborhoods in major coastal markets offers growth potential. New developments and redevelopments can enhance tenant demand and community value, supporting long-term sustainable growth.
SWOT Analysis
This analysis highlights Federal Realty Investment Trust’s key internal and external factors impacting its strategic positioning.
Strengths
- Strong, growing ROIC well above WACC
- Longest dividend increase streak in REIT sector
- Prime coastal urban retail locations
Weaknesses
- Low current and quick ratios indicate liquidity risk
- Negative interest coverage ratio signals debt servicing challenges
- Weak asset turnover may limit operational efficiency
Opportunities
- Growing demand for mixed-use urban developments
- Expansion in high-growth coastal markets
- Leveraging sustainable community investments
Threats
- Rising interest rates increasing borrowing costs
- Retail sector disruption from e-commerce
- Economic downturns impacting tenant occupancy
Federal Realty’s moat and dividend history provide solid strategic foundations. However, liquidity and interest coverage weaknesses require cautious capital management to sustain growth amid sector challenges.
Stock Price Action Analysis
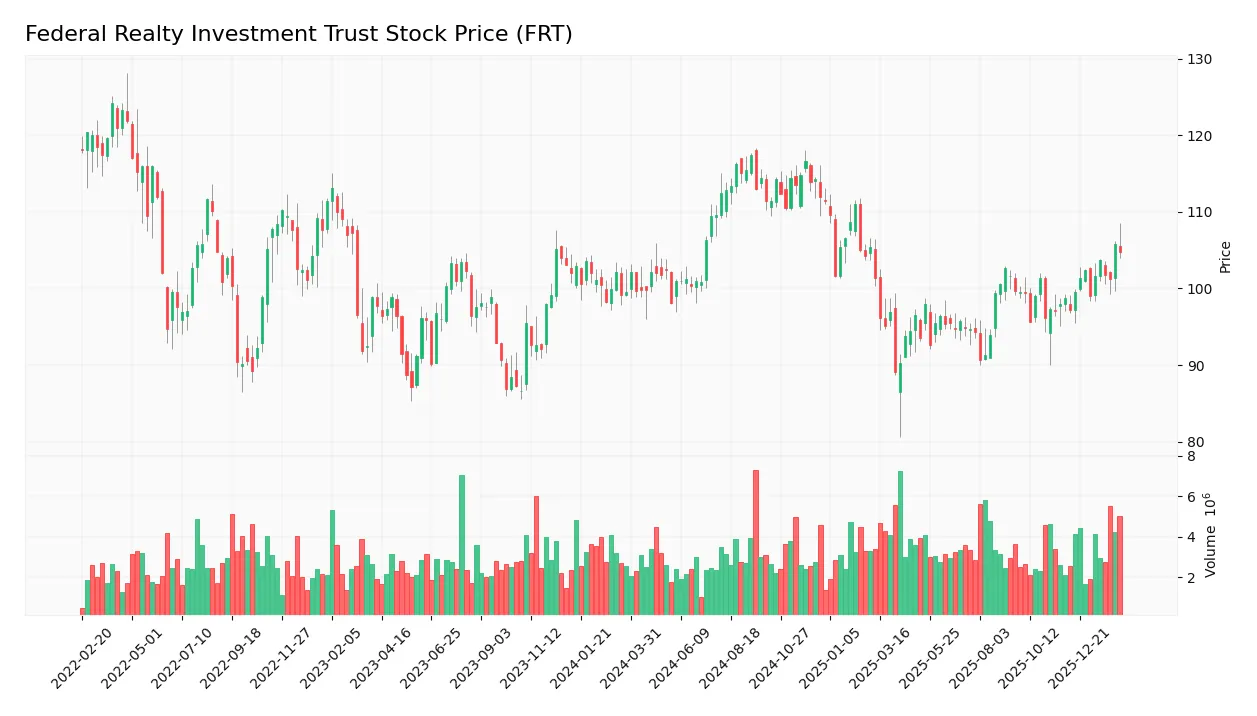
The weekly stock chart for Federal Realty Investment Trust (FRT) over the past 100 weeks shows price movements and key support and resistance levels:
Trend Analysis
Over the past 100 weeks, FRT’s stock price rose 5.29%, indicating a bullish trend with acceleration. The price ranged between 89.09 and 117.39, showing notable volatility with a 7.19 standard deviation. Recent weeks confirm continuation with a 6.15% gain and moderate volatility (2.43 std dev).
Volume Analysis
Trading volume over the last three months is increasing, with buyer volume at 23.6M versus seller volume at 17.7M. Buyers dominate slightly at 57.15%, signaling growing investor interest and positive market participation.
Target Prices
Analysts set a target consensus that reflects moderate upside potential for Federal Realty Investment Trust.
| Target Low | Target High | Consensus |
|---|---|---|
| 105 | 115 | 109.33 |
The target range suggests cautious optimism with a balanced expectation of Federal Realty’s near-term price performance.

Don’t Let Luck Decide Your Entry Point
Optimize your entry points with our advanced ProRealTime indicators. You’ll get efficient buy signals with precise price targets for maximum performance. Start outperforming now!
Analyst & Consumer Opinions
This section examines Federal Realty Investment Trust’s grades and consumer feedback to provide a balanced performance overview.
Stock Grades
Here are the latest verified stock grades for Federal Realty Investment Trust from recognized financial institutions:
| Grading Company | Action | New Grade | Date |
|---|---|---|---|
| Stifel | Maintain | Hold | 2026-02-13 |
| Scotiabank | Maintain | Sector Outperform | 2026-01-14 |
| JP Morgan | Upgrade | Overweight | 2025-12-18 |
| Jefferies | Upgrade | Buy | 2025-12-16 |
| Truist Securities | Maintain | Hold | 2025-12-02 |
| Barclays | Downgrade | Equal Weight | 2025-11-18 |
| Evercore ISI Group | Maintain | In Line | 2025-11-03 |
| Wells Fargo | Maintain | Overweight | 2025-10-21 |
| Evercore ISI Group | Maintain | In Line | 2025-10-17 |
| Barclays | Maintain | Overweight | 2025-10-16 |
The grades show a mixed but generally positive trend, with several upgrades toward buy and overweight ratings in late 2025, balanced by some holds and a few downgrades. This suggests cautious optimism among analysts about the stock’s prospects.
Consumer Opinions
Federal Realty Investment Trust (FRT) draws a mix of praise and criticism from its consumer base, reflecting its position in retail real estate.
| Positive Reviews | Negative Reviews |
|---|---|
| “Well-maintained properties with great locations.” | “Rent prices have increased sharply recently.” |
| “Excellent tenant services and timely communication.” | “Some shopping centers feel outdated.” |
| “Strong community engagement and events.” | “Limited parking at certain locations.” |
Overall, consumers appreciate FRT’s prime locations and tenant support. However, rising rents and occasional facility aging temper enthusiasm, signaling areas for management’s focus.
Risk Analysis
Below is a summary table of key risks facing Federal Realty Investment Trust with their likelihood and potential impact:
| Category | Description | Probability | Impact |
|---|---|---|---|
| Liquidity Risk | Current and quick ratios at 0.31 indicate weak liquidity, increasing short-term funding risk. | High | High |
| Interest Coverage | Negative interest coverage signals difficulty servicing debt if rates rise. | Medium | High |
| Valuation Risk | Neutral P/E of 21.05 and unfavorable P/B of 2.66 could pressure price if growth slows. | Medium | Medium |
| Bankruptcy Risk | Altman Z-Score at 1.03 places company in distress zone, signaling potential solvency concerns. | Medium | High |
| Operational Efficiency | Low asset turnover (0.14) may limit growth and cash flow generation. | Medium | Medium |
| Market Volatility | Beta near 1.0 implies stock moves in line with market, exposing it to broad economic swings. | High | Medium |
The most pressing risks for Federal Realty are its weak liquidity and distress-zone Altman Z-Score, which point to financial fragility despite solid ROIC and dividend yield. Negative interest coverage is a red flag amid rising rates. Investors should weigh these risks carefully against its strong coastal market presence and long dividend track record.
Should You Buy Federal Realty Investment Trust?
Federal Realty Investment Trust appears to be in a very favorable moat position with growing ROIC suggesting durable competitive advantage. While profitability shows signs of operational efficiency, its leverage profile and distress-zone Altman Z-score could signal financial risks. The overall B+ rating suggests a moderately attractive risk-return profile.
Strength & Efficiency Pillars
Federal Realty Investment Trust delivers strong operational margins, with a net margin of 32.14% and a gross margin at 67.25%, underscoring efficient cost management. The company’s return on invested capital (ROIC) stands at an outstanding 134.81%, far surpassing its weighted average cost of capital (WACC) of 7.86%. This clear spread confirms that Federal Realty is a value creator, generating returns well above its capital costs. While return on equity (12.65%) remains moderate, it aligns with steady capital deployment in a competitive sector.
Weaknesses and Drawbacks
Federal Realty is currently in the financial distress zone, with a precarious Altman Z-Score of 1.03, signaling a high bankruptcy risk that overshadows its profitability. The company’s liquidity is critically weak, reflected in a current ratio of 0.31 and quick ratio of 0.31, far below safe thresholds and raising solvency concerns. Additionally, interest coverage is negative, indicating difficulty meeting debt obligations from operating earnings. Valuation metrics are mixed but neutral to unfavorable, with a P/E of 21.05 and P/B of 2.66, suggesting the market prices in some risk.
Our Final Verdict about Federal Realty Investment Trust
Despite Federal Realty’s operational efficiency and value-creating ROIC, its position in the distress zone (Z-Score 1.03) exposes it to significant solvency risk. This risk makes the investment profile highly speculative and too risky for conservative capital. Investors should prioritize safety and exercise caution, as strong margins alone cannot offset the looming financial instability.
Disclaimer: This content is for informational purposes only and does not constitute financial, investment, or other professional advice. Investing in financial markets involves a significant risk of loss, and past performance is not indicative of future results.
Additional Resources
- What Analysts Think Is Shifting The Story For Federal Realty Investment Trust (FRT) – Yahoo Finance (Feb 13, 2026)
- Is Federal Realty (FRT) Using Asset Sales to Quietly Redefine Its Long‑Term Portfolio Strategy? – Sahm (Feb 13, 2026)
- Federal Realty Investment Trust Reports Fourth Quarter and Full Year 2025 Results – PR Newswire (Feb 12, 2026)
- Federal Realty Investment Trust (NYSE:FRT) Announces Quarterly Dividend of $1.13 – MarketBeat (Feb 13, 2026)
- Federal Realty Misses Q4 FFO Estimates, Guides Higher for 2026 – Nasdaq (Feb 13, 2026)
For more information about Federal Realty Investment Trust, please visit the official website: federalrealty.com