Home > Analyses > Industrials > Fastenal Company
Fastenal Company powers the backbone of industrial and construction projects across North America. It dominates wholesale distribution with a vast range of fasteners and essential supplies that keep factories, infrastructure, and maintenance operations running. Renowned for its extensive in-market network and operational efficiency, Fastenal blends innovation with deep sector expertise. As market dynamics evolve, I question whether Fastenal’s solid fundamentals still support its current valuation and growth trajectory.

Table of contents
Business Model & Company Overview
Fastenal Company, founded in 1967 and headquartered in Winona, Minnesota, commands a leading position in industrial distribution. It operates a vast ecosystem supplying fasteners and related industrial and construction products. Fastenal serves diverse sectors, including manufacturing, construction, and government entities, through an extensive network of 3,209 local stores and 15 distribution centers across North America and internationally.
The company’s revenue engine balances product sales with robust distribution services, leveraging its vast physical footprint in the Americas, Europe, and Asia. Fastenal’s core strength lies in its integrated supply chain, which ensures rapid delivery and customer loyalty. Its competitive advantage stems from deep market penetration and a resilient distribution model that shapes the future of industrial supply chains.
Financial Performance & Fundamental Metrics
I analyze Fastenal Company’s income statement, key financial ratios, and dividend payout policy to reveal its operational efficiency and shareholder value creation.
Income Statement
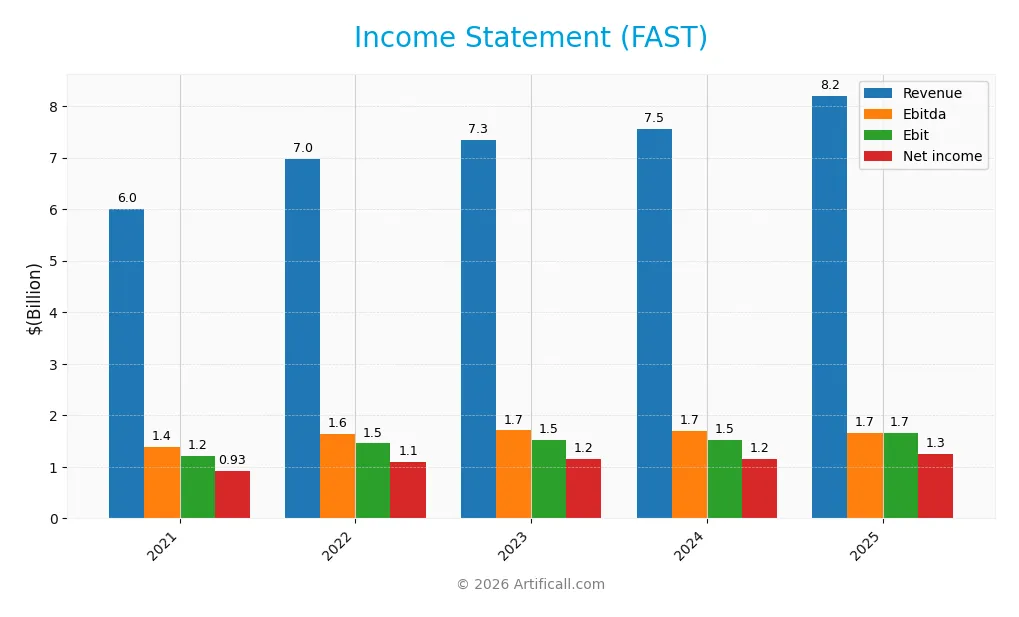
This table summarizes Fastenal Company’s key income statement figures from 2021 to 2025, reflecting revenue growth and profitability trends.
| 2021 | 2022 | 2023 | 2024 | 2025 | |
|---|---|---|---|---|---|
| Revenue | 6.01B | 6.98B | 7.35B | 7.55B | 8.20B |
| Cost of Revenue | 3.23B | 3.76B | 3.99B | 4.14B | 4.51B |
| Operating Expenses | 1.56B | 1.76B | 1.83B | 1.89B | 2.04B |
| Gross Profit | 2.78B | 3.22B | 3.35B | 3.40B | 3.69B |
| EBITDA | 1.39B | 1.63B | 1.71B | 1.69B | 1.66B |
| EBIT | 1.22B | 1.45B | 1.53B | 1.52B | 1.66B |
| Interest Expense | 9.70M | 14.30M | 10.80M | 7.30M | 6.20M |
| Net Income | 925M | 1.09B | 1.16B | 1.15B | 1.26B |
| EPS | 0.80 | 0.95 | 1.01 | 1.00 | 1.10 |
| Filing Date | 2022-02-07 | 2023-02-07 | 2024-02-06 | 2025-02-06 | 2026-02-05 |
Income Statement Evolution
Fastenal Company’s revenue rose steadily from 6.0B in 2021 to 8.2B in 2025, marking a 36.4% growth over five years. Net income mirrored this trend, growing 36.0% to 1.26B in 2025. Gross and EBIT margins remained stable and favorable, with gross margin around 45% and EBIT margin near 20%, indicating consistent operational efficiency.
Is the Income Statement Favorable?
The 2025 income statement shows solid fundamentals. Revenue grew 8.7% year-over-year, supported by an 8.5% increase in gross profit and a 9.3% rise in EBIT. Net margin held steady at 15.4%, reflecting controlled costs and low interest expenses at 0.08%. Overall, 85.7% of key income metrics rate favorable, underscoring a robust and healthy profitability profile.
Financial Ratios
The following table summarizes key financial ratios for Fastenal Company over the last five fiscal years, providing a snapshot of profitability, liquidity, leverage, efficiency, and shareholder returns:
| Ratios | 2021 | 2022 | 2023 | 2024 | 2025 |
|---|---|---|---|---|---|
| Net Margin | 15% | 16% | 16% | 15% | 15% |
| ROE | 30% | 34% | 34% | 32% | 32% |
| ROIC | 25% | 27% | 29% | 28% | 28% |
| P/E | 40 | 25 | 32 | 36 | 37 |
| P/B | 12 | 9 | 11 | 11 | 12 |
| Current Ratio | 4.2 | 4.0 | 4.6 | 4.7 | 4.9 |
| Quick Ratio | 2.0 | 1.8 | 2.3 | 2.3 | 2.4 |
| D/E | 0.21 | 0.25 | 0.16 | 0.13 | 0.11 |
| Debt-to-Assets | 15% | 18% | 12% | 10% | 9% |
| Interest Coverage | 126 | 102 | 142 | 207 | 267 |
| Asset Turnover | 1.4 | 1.5 | 1.6 | 1.6 | 1.6 |
| Fixed Asset Turnover | 4.8 | 5.6 | 5.7 | 5.6 | 5.7 |
| Dividend Yield | 1.7% | 2.6% | 2.7% | 2.2% | 2.2% |
Evolution of Financial Ratios
Return on Equity (ROE) remained steady around 31.9% in 2025, signaling consistent profitability. The Current Ratio increased slightly to 4.85, indicating stronger short-term liquidity. Debt-to-Equity Ratio declined to 0.11, reflecting lower leverage. Profit margins showed minor fluctuations but maintained solid levels, confirming stable operational performance.
Are the Financial Ratios Fovorable?
Profitability ratios such as ROE, net margin (15.35%), and ROIC (27.52%) are favorable, supported by a low WACC of 7.97%. Liquidity shows mixed signals: a high Current Ratio (4.85) is unfavorable due to potential inefficiency, while the Quick Ratio (2.41) is favorable. Leverage metrics, including Debt-to-Equity (0.11) and Debt-to-Assets (8.75%), are favorable. Market multiples like P/E (36.6) and P/B (11.68) appear expensive. Overall, 78.57% of ratios rate very favorable.
Shareholder Return Policy
Fastenal Company maintains a consistent dividend payout, with a 2025 dividend payout ratio near 80% and a 2.18% annual yield. Dividend payments align closely with free cash flow, supported by manageable capital expenditure and occasional share buybacks.
This disciplined distribution approach balances shareholder returns with operational needs. The dividend policy, combined with prudent buybacks, supports sustainable long-term value creation without overextending financial resources.
Score analysis
Here is a radar chart presenting Fastenal Company’s key financial scores for a clear performance snapshot:
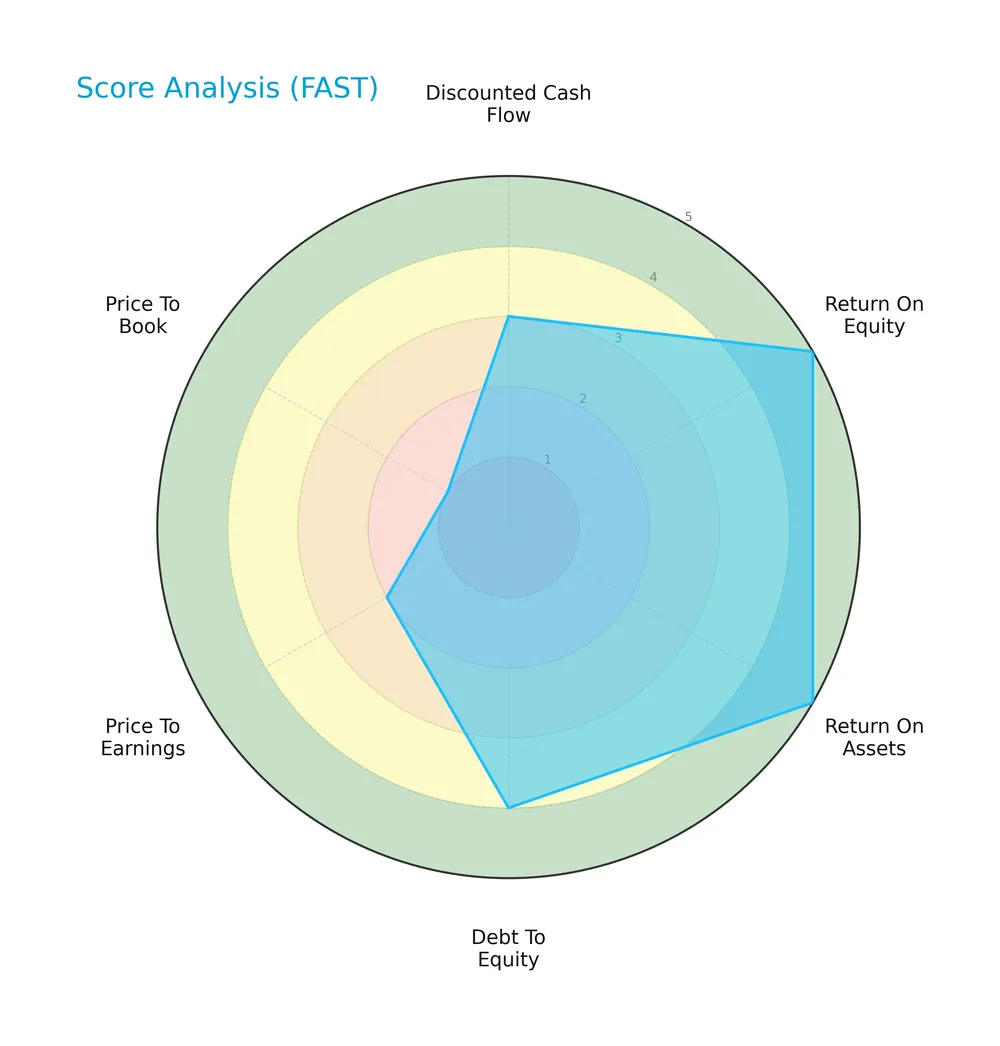
Fastenal scores very favorably on return on equity and assets, indicating strong profitability. Debt-to-equity is favorable, supporting manageable leverage. Discounted cash flow and price-to-earnings scores are moderate. Price-to-book score is very unfavorable, highlighting valuation concerns.
Analysis of the company’s bankruptcy risk
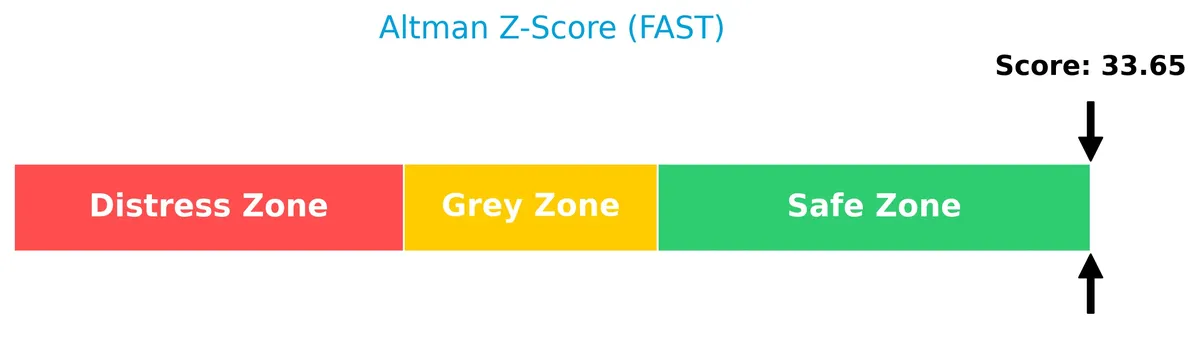
Fastenal’s Altman Z-Score places it well within the safe zone, indicating very low bankruptcy risk and strong financial stability:
Is the company in good financial health?
The following Piotroski diagram illustrates Fastenal’s financial health based on its Piotroski Score:

With a score of 6, Fastenal demonstrates average financial health. The company shows solid fundamentals but does not reach the highest thresholds of financial strength.
Competitive Landscape & Sector Positioning
This analysis explores Fastenal Company’s strategic positioning, revenue streams, key products, and main competitors within the industrial distribution sector. I will assess whether Fastenal holds a competitive advantage over its peers.
Strategic Positioning
Fastenal Company concentrates heavily on the industrial distribution sector, with a dominant U.S. revenue base exceeding 6.2B in 2024. Its geographic footprint spans North America and select international markets, supported by 3,209 in-market locations and 15 distribution centers, indicating focused yet expansive reach.
Revenue by Segment
This pie chart illustrates Fastenal Company’s revenue distribution by geographic segments for the fiscal year 2015, highlighting contributions from the United States, Canada, and Other Countries.
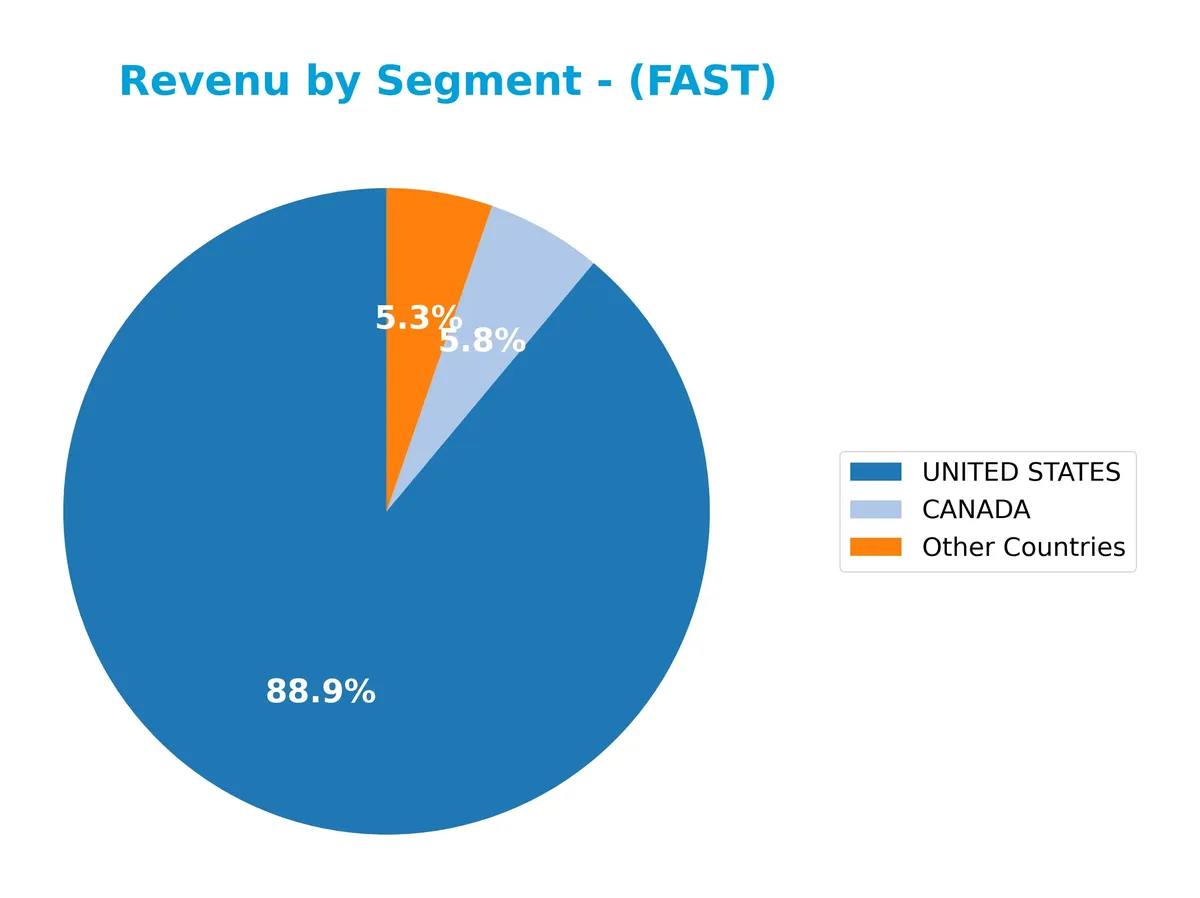
In 2015, the United States dominated Fastenal’s revenue, generating $3.44B, reinforcing its status as the core market. Canada contributed $223M, showing slight contraction from prior years, while Other Countries increased to $205M, indicating modest international expansion. The data reveals a concentration risk in the U.S. market but also a gradual diversification trend. The steady growth in international sales suggests management’s cautious push beyond domestic borders.
Key Products & Brands
The following table outlines Fastenal Company’s main products and brand offerings:
| Product | Description |
|---|---|
| Fasteners | Threaded fasteners including bolts, nuts, screws, studs, and washers for manufacturing and construction. |
| Miscellaneous Supplies | Hardware such as pins, machinery keys, concrete anchors, metal framing systems, wire ropes, strut products, rivets, and accessories. |
Fastenal’s product range focuses heavily on fasteners and related industrial supplies. These products serve diverse customers across manufacturing, construction, and maintenance sectors.
Main Competitors
There are 3 main competitors in the Industrials sector; below is the list of the top 3 leaders by market capitalization:
| Competitor | Market Cap. |
|---|---|
| W.W. Grainger, Inc. | 47.7B |
| Fastenal Company | 46.4B |
| Pool Corporation | 8.6B |
Fastenal Company ranks 2nd among its 3 competitors. Its market cap stands at 1.14 times that of the leader, W.W. Grainger, with a 12.12% gap to the top player. It is positioned above both the average market cap of the top 10 competitors (34.2B) and the median market cap in its sector (46.4B). The gap to the next closest competitor below is significant at -532.53%.
Comparisons with competitors
Check out how we compare the company to its competitors:
Does Fastenal Company have a competitive advantage?
Fastenal Company exhibits a very favorable competitive advantage, consistently generating ROIC well above its WACC by 19.6%, indicating strong value creation and efficient capital use. The company’s growing ROIC trend of 11.2% over 2021-2025 confirms its sustainable profitability and effective management.
Looking ahead, Fastenal’s broad product portfolio and extensive distribution network across North America and internationally support growth potential. Expansion opportunities in industrial and construction supplies markets, along with investments in new locations and distribution centers, could further enhance its competitive positioning.
SWOT Analysis
This analysis highlights Fastenal Company’s key strengths, weaknesses, opportunities, and threats to guide strategic decisions.
Strengths
- strong ROIC at 27.5%, well above WACC
- consistent revenue and net income growth over 36% since 2021
- robust distribution network with 3,209 locations
Weaknesses
- high price-to-book ratio at 11.68 signals premium valuation
- elevated current ratio at 4.85 may indicate inefficient asset use
- moderate Piotroski score of 6 suggests room to improve financial strength
Opportunities
- expanding industrial and construction markets in North America
- growth potential in international markets outside North America
- digital transformation and supply chain optimization
Threats
- cyclical nature of industrial demand risks revenue volatility
- competition from larger distributors and local suppliers
- raw material price fluctuations could pressure margins
Fastenal’s durable competitive advantages and strong profitability support growth, but valuation and operational efficiency warrant caution. The company should leverage market expansion and innovation while managing cyclical risks.
Stock Price Action Analysis
The weekly stock chart for Fastenal Company illustrates price movements and volatility over the last 100 weeks:
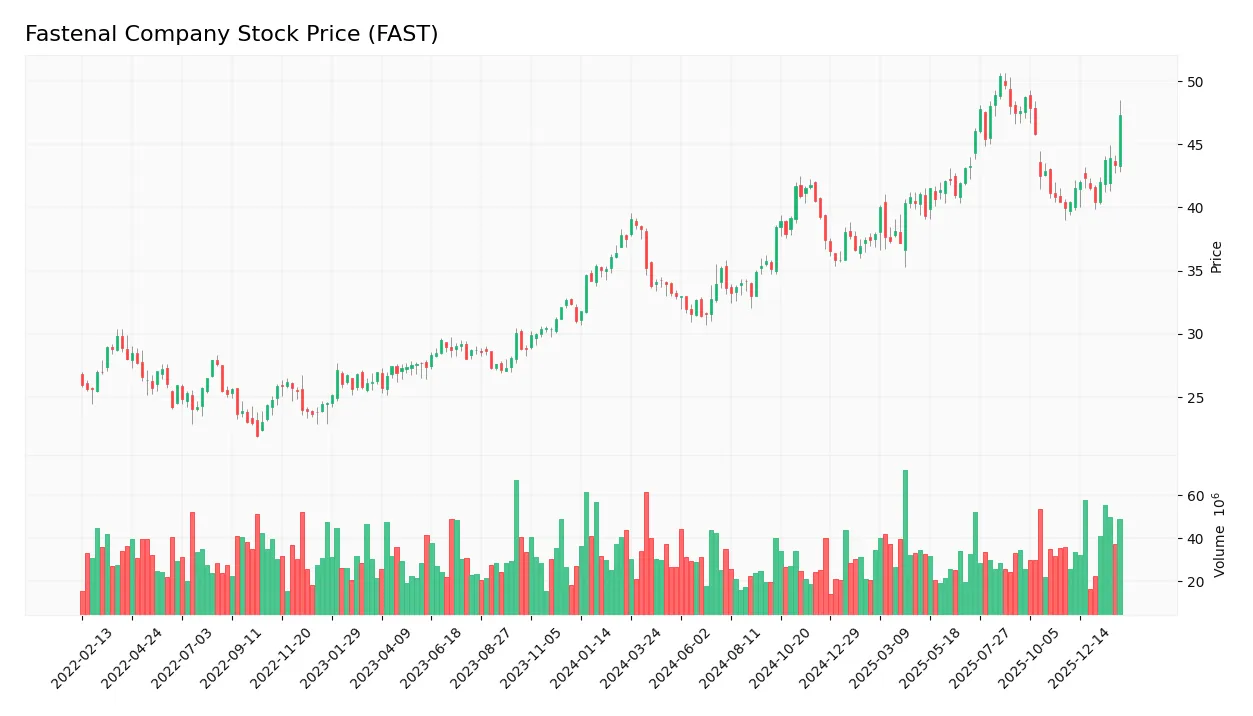
Trend Analysis
Over the past 12 months, Fastenal’s stock price rose 26.16%, confirming a bullish trend with accelerating momentum. Price fluctuated between a low of 31.42 and a high of 50.39. The standard deviation of 4.7 signals notable volatility accompanying the upward move.
Volume Analysis
Trading volume totals 3.8B shares, with buyers accounting for 56.7%, indicating moderate buyer dominance. Volume is increasing, reflecting growing market participation. Recent months show strong buyer dominance at 75.5%, suggesting robust investor confidence and demand.
Target Prices
Analysts set a clear target consensus for Fastenal Company, reflecting moderate upside potential.
| Target Low | Target High | Consensus |
|---|---|---|
| 43 | 52 | 47 |
The target prices suggest analysts expect Fastenal’s stock to trade between $43 and $52, with a consensus near $47, indicating measured confidence in its near-term performance.

Don’t Let Luck Decide Your Entry Point
Optimize your entry points with our advanced ProRealTime indicators. You’ll get efficient buy signals with precise price targets for maximum performance. Start outperforming now!
Analyst & Consumer Opinions
This section examines Fastenal Company’s recent analyst ratings and consumer feedback to gauge market sentiment and satisfaction.
Stock Grades
Here is the latest set of verified stock grades for Fastenal Company from leading financial institutions:
| Grading Company | Action | New Grade | Date |
|---|---|---|---|
| Barclays | Maintain | Equal Weight | 2026-01-21 |
| Jefferies | Upgrade | Buy | 2025-12-15 |
| Barclays | Maintain | Equal Weight | 2025-11-13 |
| Wolfe Research | Downgrade | Underperform | 2025-11-13 |
| Barclays | Maintain | Equal Weight | 2025-10-14 |
| JP Morgan | Maintain | Neutral | 2025-09-04 |
| Baird | Upgrade | Outperform | 2025-08-07 |
| JP Morgan | Maintain | Neutral | 2025-07-15 |
| Baird | Maintain | Neutral | 2025-07-15 |
| Stephens & Co. | Maintain | Equal Weight | 2025-07-15 |
The grades show a cautious but generally stable outlook with multiple maintains at neutral or equal weight levels. Upgrades from Jefferies and Baird contrast Wolfe Research’s downgrade, signaling mixed analyst sentiment.
Consumer Opinions
Consumers express a mix of admiration and frustration with Fastenal Company’s service and product quality.
| Positive Reviews | Negative Reviews |
|---|---|
| Reliable product availability and fast delivery times. | Customer service can be slow during peak periods. |
| High-quality industrial supplies that meet expectations. | Some users report inconsistent pricing across stores. |
| Helpful and knowledgeable staff in local branches. | Limited online inventory compared to competitors. |
Overall, customers appreciate Fastenal’s dependable supply chain and expert staff. However, service speed and pricing consistency remain areas needing improvement.
Risk Analysis
Below is a summary of key risks facing Fastenal Company, categorized by likelihood and potential impact:
| Category | Description | Probability | Impact |
|---|---|---|---|
| Valuation Risk | Elevated P/E at 36.6 and high P/B at 11.68 suggest overvaluation. | Medium | High |
| Market Volatility | Beta of 0.885 indicates moderate sensitivity to market swings. | Medium | Medium |
| Liquidity Risk | Current ratio at 4.85 flagged unfavorable, may signal inefficient working capital use. | Low | Low |
| Competitive Pressure | Industrial distribution faces pricing pressures and evolving supply chains. | Medium | Medium |
| Economic Cyclicality | Exposure to manufacturing and construction sectors vulnerable to downturns. | Medium | High |
Fastenal’s valuation stands out as the most critical risk. Its P/E and P/B ratios sharply exceed industry norms, raising concerns about future returns. Despite robust profitability and a rock-solid Altman Z-Score of 33.6 (safe zone), cyclical exposure remains a wildcard. Investors should watch economic indicators closely, as downturns could pressure demand and margins.
Should You Buy Fastenal Company?
Fastenal Company appears to be a robust value creator with a very favorable moat supported by growing ROIC well above WACC. Despite a strong leverage profile and liquidity, mixed valuation metrics temper the overall A- rating, suggesting cautious optimism.
Strength & Efficiency Pillars
Fastenal Company demonstrates robust profitability, with a net margin of 15.35% and a return on equity of 31.91%. Its return on invested capital (ROIC) stands at 27.52%, significantly exceeding the weighted average cost of capital (WACC) at 7.97%, confirming the company as a clear value creator. Financial health is solid, evidenced by an Altman Z-score of 33.65, placing it deep in the safe zone, and a Piotroski score of 6, reflecting average but stable fundamentals. These metrics underline Fastenal’s sustained operational efficiency and competitive moat.
Weaknesses and Drawbacks
Fastenal’s valuation metrics raise concerns. The price-to-earnings ratio of 36.6 and price-to-book ratio of 11.68 indicate a premium valuation that may limit upside potential. The current ratio at 4.85 is unusually high and marked unfavorable, potentially signaling inefficient asset use or excess liquidity. While leverage remains low with a debt-to-equity ratio of 0.11, these valuation and liquidity factors suggest caution, especially in volatile market environments or economic downturns where premium multiples can compress swiftly.
Our Verdict about Fastenal Company
Fastenal’s long-term fundamental profile appears favorable, supported by strong profitability and value creation metrics. The bullish overall stock trend coupled with a recent period of strong buyer dominance suggests positive momentum. This combination might appear attractive for investors seeking growth, yet the elevated valuation ratios could warrant a cautious approach. Therefore, the company could be suitable for those with a tolerance for premium pricing and confidence in sustained operational strength.
Disclaimer: This content is for informational purposes only and does not constitute financial, investment, or other professional advice. Investing in financial markets involves a significant risk of loss, and past performance is not indicative of future results.
Additional Resources
- Barclays reviews Fastenal (FAST) as lower pricing weighs on results – MSN (Feb 05, 2026)
- Envestnet Asset Management Inc. Cuts Position in Fastenal Company $FAST – MarketBeat (Feb 05, 2026)
- Fastenal Company’s (NASDAQ:FAST) Price Is Out Of Tune With Earnings – 富途牛牛 (Feb 05, 2026)
- FASTENAL CO SEC 10-K Report – TradingView (Feb 05, 2026)
- Baird Adjusts Fastenal Price Target to $51 From $49, Maintains Outperform Rating – marketscreener.com (Feb 05, 2026)
For more information about Fastenal Company, please visit the official website: fastenal.com