Home > Analyses > Technology > Fair Isaac Corporation
Fair Isaac Corporation fundamentally shapes how businesses make critical decisions, influencing everything from creditworthiness to fraud prevention worldwide. As a pioneer in analytic software and decision management, FICO leads the technology industry with its flagship credit scoring products and innovative software platforms. Renowned for quality and market influence, the company connects data and decisions across diverse sectors. The key question for investors now is whether FICO’s robust fundamentals continue to support its premium valuation and future growth prospects.

Table of contents
Business Model & Company Overview
Fair Isaac Corporation, founded in 1956 and headquartered in Bozeman, Montana, stands as a dominant player in the software application industry. The company builds an integrated ecosystem of analytic, software, and data management products that empower businesses globally to automate and enhance decision-making. Its core mission revolves around connecting complex processes in marketing, fraud detection, compliance, and customer management into seamless, intelligent workflows.
The company’s revenue engine balances its Scores and Software segments, delivering both recurring subscription services and modular decision management solutions. Fair Isaac extends its reach across the Americas, Europe, the Middle East, Africa, and Asia Pacific, leveraging direct and indirect sales channels. Its economic moat lies in the deep integration of advanced analytics and decision software, shaping the future of automated business intelligence worldwide.
Financial Performance & Fundamental Metrics
In this section, I will analyze Fair Isaac Corporation’s income statement, key financial ratios, and dividend payout policy to assess its financial health and investment potential.
Income Statement
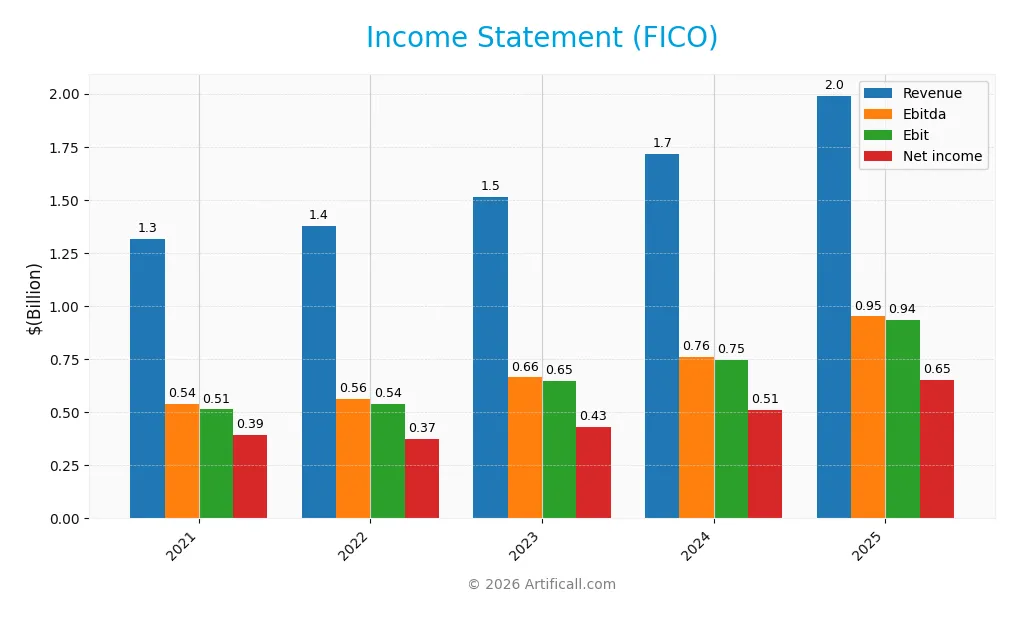
Below is the detailed Income Statement of Fair Isaac Corporation (FICO) for fiscal years 2021 through 2025, showing key financial metrics in USD.
| 2021 | 2022 | 2023 | 2024 | 2025 | |
|---|---|---|---|---|---|
| Revenue | 1.32B | 1.38B | 1.51B | 1.72B | 1.99B |
| Cost of Revenue | 332M | 302M | 311M | 348M | 354M |
| Operating Expenses | 479M | 533M | 560M | 636M | 712M |
| Gross Profit | 984M | 1.08B | 1.20B | 1.37B | 1.64B |
| EBITDA | 539M | 561M | 664M | 761M | 951M |
| EBIT | 513M | 540M | 649M | 748M | 936M |
| Interest Expense | 40M | 69M | 96M | 106M | 134M |
| Net Income | 392M | 374M | 429M | 513M | 652M |
| EPS | 13.65 | 14.34 | 17.18 | 20.78 | 26.90 |
| Filing Date | 2021-11-10 | 2022-11-09 | 2023-11-08 | 2024-11-06 | 2025-11-07 |
Income Statement Evolution
From 2021 to 2025, Fair Isaac Corporation’s revenue increased by 51.22%, reaching $1.99B in 2025. Net income grew by 66.28% over the same period, hitting $652M. Margins improved with a gross margin of 82.23%, EBIT margin of 47.03%, and net margin of 32.75%, reflecting consistent profitability and efficient cost management throughout the period.
Is the Income Statement Favorable?
The 2025 income statement reveals a favorable financial position, with revenue growth of 15.91% and net income growth of 9.68% year-over-year. Operating expenses scaled proportionally, supporting a strong EBIT growth of 25.22%. The net margin expansion and EPS increase of 29.78% further underscore robust earnings quality. Interest expense at 6.71% is neutral, indicating manageable financial costs. Overall, fundamentals appear favorable.
Financial Ratios
The following table summarizes key financial ratios for Fair Isaac Corporation (FICO) over the last five fiscal years, providing insight into profitability, valuation, liquidity, leverage, and operational efficiency:
| Ratios | 2021 | 2022 | 2023 | 2024 | 2025 |
|---|---|---|---|---|---|
| Net Margin | 30% | 27% | 28% | 30% | 33% |
| ROE | -353% | -47% | -62% | -53% | -37% |
| ROIC | 33% | 37% | 39% | 43% | 53% |
| P/E | 29.2 | 28.7 | 50.5 | 93.5 | 55.6 |
| P/B | -103.1 | -13.4 | -31.5 | -49.8 | -20.8 |
| Current Ratio | 0.99 | 1.46 | 1.51 | 1.62 | 0.83 |
| Quick Ratio | 0.99 | 1.46 | 1.51 | 1.62 | 0.83 |
| D/E | -12.0 | -2.38 | -2.76 | -2.33 | -1.76 |
| Debt-to-Assets | 85% | 133% | 121% | 131% | 165% |
| Interest Coverage | 12.6 | 7.86 | 6.73 | 6.94 | 6.92 |
| Asset Turnover | 0.84 | 0.96 | 0.96 | 1.00 | 1.07 |
| Fixed Asset Turnover | 17.5 | 25.4 | 41.3 | 25.2 | 21.2 |
| Dividend Yield | 0% | 0% | 0% | 0% | 0% |
All ratios are expressed as decimals or percentages where appropriate, rounded for clarity. Negative figures for P/B and leverage ratios reflect company-specific balance sheet characteristics.
Evolution of Financial Ratios
Over the period, Fair Isaac Corporation’s return on equity (ROE) remained negative, reflecting ongoing challenges in generating shareholder returns despite other improvements. The current ratio showed a downward trend, falling below 1 in 2025, indicating tighter liquidity. Conversely, the debt-to-equity ratio stabilized at a negative level, suggesting an unusual capital structure but relative consistency. Profitability margins, particularly net margin, improved, reaching 32.75% in 2025.
Are the Financial Ratios Favorable?
In 2025, profitability indicators such as net margin (32.75%) and return on invested capital (52.96%) were favorable, reflecting strong earnings efficiency. Liquidity ratios were mixed: the current ratio was unfavorable at 0.83, while the quick ratio was neutral. Leverage measures showed a favorable debt-to-equity ratio of -1.76 but an unfavorable debt-to-assets ratio exceeding 160%. Market valuation ratios like price-to-earnings were unfavorable, indicating high valuation levels. Overall, the financial ratios present a slightly favorable picture with a balance of strengths and weaknesses.
Shareholder Return Policy
Fair Isaac Corporation (FICO) does not pay dividends, with a dividend payout ratio and yield consistently at zero over recent years. The company appears to prioritize reinvestment and growth, supported by strong free cash flow coverage and no indication of share buybacks.
This absence of dividend distributions aligns with a strategy focused on long-term value creation through reinvestment rather than immediate shareholder returns. The policy appears sustainable given FICO’s positive net income per share and robust operating cash flow, supporting ongoing operational and strategic initiatives.
Score analysis
The following radar chart illustrates key financial ratios and valuation metrics for Fair Isaac Corporation:
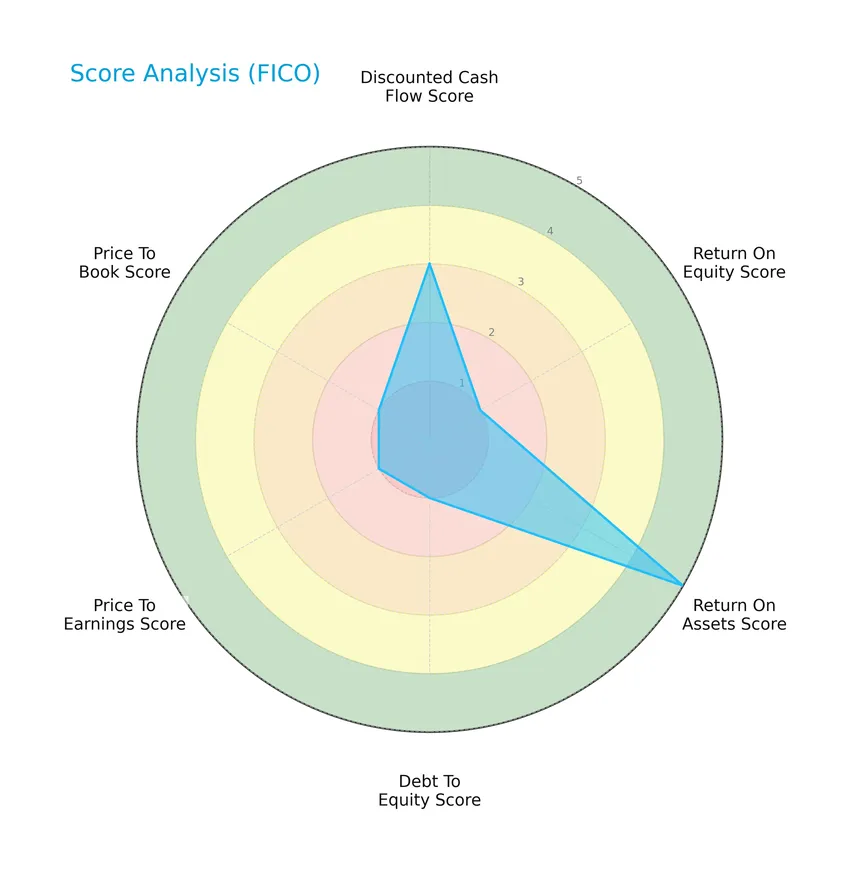
The scores show a mixed financial profile: discounted cash flow is moderate at 3, return on assets is very favorable at 5, but return on equity, debt to equity, price to earnings, and price to book ratios are all very unfavorable at 1, indicating areas of concern in profitability and valuation metrics.
Analysis of the company’s bankruptcy risk
The Altman Z-Score places Fair Isaac Corporation well within the safe zone, indicating a very low risk of bankruptcy based on its financial ratios:

Is the company in good financial health?
The Piotroski Score diagram highlights the company’s financial strength and operational efficiency:

With a Piotroski Score of 7, Fair Isaac Corporation demonstrates strong financial health, reflecting solid profitability and balance sheet quality, though not at the very highest end of the scale.
Competitive Landscape & Sector Positioning
This section presents an analysis of Fair Isaac Corporation’s sector, focusing on its strategic positioning, revenue segments, key products, and main competitors. I will assess whether Fair Isaac Corporation holds a competitive advantage within the software application industry.
Strategic Positioning
Fair Isaac Corporation maintains a diversified product portfolio with two main segments: Scores and Software, generating over $1.9B combined revenue in 2025. Geographically, it has a strong presence in the Americas ($1.73B), with smaller but growing revenues in EMEA ($160M) and Asia Pacific ($99M), reflecting a broad international footprint.
Revenue by Segment
This pie chart illustrates Fair Isaac Corporation’s revenue distribution by product segment for the fiscal year 2025.
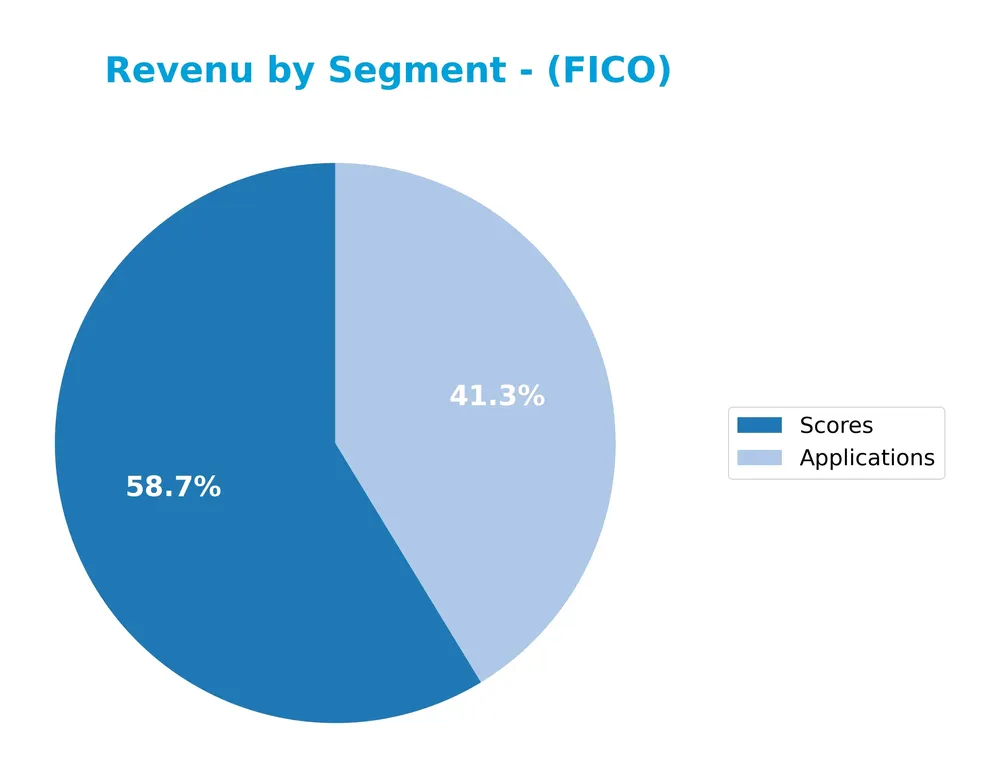
In 2025, the Scores segment remains a primary revenue driver with $1.17B, showing strong growth compared to previous years. Applications contributed $822M, indicating a notable shift as this segment appears explicitly alongside Scores for the first time. Earlier years showed a dominant Software segment which seems to have transitioned into Applications. The overall trend suggests increasing diversification, but with Scores still central to the company’s revenue base, concentration risk persists.
Key Products & Brands
The table below presents Fair Isaac Corporation’s main product lines and their descriptions:
| Product | Description |
|---|---|
| Scores | Business-to-business and business-to-consumer scoring solutions providing analytics for decision-making. |
| Software | Pre-configured decision management solutions addressing marketing, fraud detection, compliance, and more. |
| FICO Platform | Modular software supporting advanced analytics and decision use cases, configurable for various business needs. |
Fair Isaac Corporation’s key offerings include credit scoring products and advanced decision management software, supporting diverse business processes worldwide. Scores and software solutions drive their revenue and client engagement.
Main Competitors
There are 33 competitors in the Technology sector for Fair Isaac Corporation; below is a list of the top 10 leaders by market capitalization:
| Competitor | Market Cap. |
|---|---|
| Salesforce, Inc. | 242.5B |
| Shopify Inc. | 209.6B |
| AppLovin Corporation | 209.0B |
| Intuit Inc. | 175.2B |
| Uber Technologies, Inc. | 172.2B |
| ServiceNow, Inc. | 153.0B |
| Cadence Design Systems, Inc. | 84.5B |
| Snowflake Inc. | 73.4B |
| Autodesk, Inc. | 61.2B |
| Workday, Inc. | 54.9B |
Fair Isaac Corporation ranks 14th among 33 competitors in the Technology sector, with a market capitalization approximately 15.3% that of the leader, Salesforce, Inc. The company is positioned below the average market cap of the top 10 competitors (143.6B) but remains above the sector median of 18.8B. It maintains a 14.75% market cap advantage over its closest competitor above.
Comparisons with competitors
Check out how we compare the company to its competitors:
Does FICO have a competitive advantage?
Fair Isaac Corporation (FICO) presents a very favorable competitive advantage, demonstrated by its ROIC exceeding WACC by over 43% and a strong trend of growing ROIC, indicating efficient capital use and value creation. The company’s robust profitability metrics, including an 82.23% gross margin and a 32.75% net margin, support its strong market position in the software application industry.
Looking ahead, FICO’s future outlook includes opportunities to expand its decision management software and scoring solutions across the Americas, EMEA, and Asia Pacific markets. Continued innovation in its modular FICO Platform and analytics offerings positions the company to capitalize on growing demand for automated decision-making in diverse business processes.
SWOT Analysis
This SWOT analysis highlights the key internal and external factors affecting Fair Isaac Corporation (FICO) to guide informed investment decisions.
Strengths
- Strong revenue growth of 15.9% in 2025
- High gross margin at 82.2%
- Durable competitive advantage with growing ROIC
Weaknesses
- Negative return on equity at -37.3%
- High debt to assets ratio at 164.6%
- Low current ratio at 0.83 indicating liquidity concerns
Opportunities
- Expanding demand for AI-driven decision management software
- Growth potential in Asia Pacific and EMEA markets
- Increasing adoption of fraud detection and compliance solutions
Threats
- Intense competition in software analytics industry
- Economic downturns impacting client budgets
- Regulatory changes affecting data use and privacy
FICO’s strengths in profitability and innovation position it well for continued growth, but liquidity and leverage risks require careful monitoring. The company should leverage emerging markets and technology trends while managing competitive and regulatory challenges prudently.
Stock Price Action Analysis
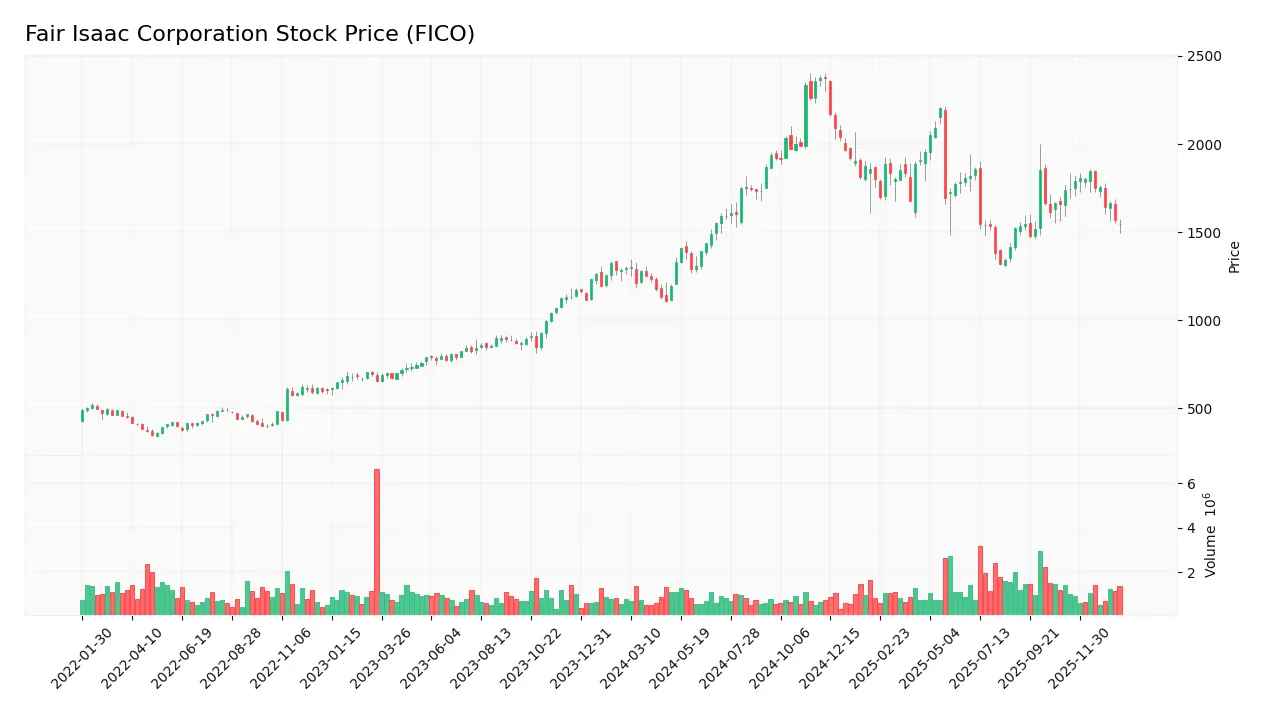
The weekly stock chart for Fair Isaac Corporation (FICO) highlights price movements and trends over the past 12 months:
Trend Analysis
Over the past 12 months, FICO’s stock price increased by 19.26%, indicating a bullish trend. The price showed deceleration despite this positive change, with a high of 2375.03 and a low of 1110.85. The overall volatility, measured by a standard deviation of 287.56, suggests moderate price fluctuations within this period.
Volume Analysis
In the last three months, trading volume has been increasing, with buyers slightly dominating at 56.15% of the activity. Buyer volume reached 6.9M versus seller volume at 5.4M, reflecting moderately positive investor sentiment and heightened market participation during this recent period.
Target Prices
The consensus target prices for Fair Isaac Corporation (FICO) reflect a positive outlook from analysts.
| Target High | Target Low | Consensus |
|---|---|---|
| 2400 | 1640 | 2115 |
Analysts expect FICO’s stock price to range between 1640 and 2400, with a consensus target around 2115, indicating moderate confidence in its growth potential.

Don’t Let Luck Decide Your Entry Point
Optimize your entry points with our advanced ProRealTime indicators. You’ll get efficient buy signals with precise price targets for maximum performance. Start outperforming now!
Analyst & Consumer Opinions
This section reviews the recent grades and consumer feedback regarding Fair Isaac Corporation’s market performance and products.
Stock Grades
Here is a summary of the latest verified stock grades for Fair Isaac Corporation (FICO) from reputable financial institutions:
| Grading Company | Action | New Grade | Date |
|---|---|---|---|
| Jefferies | Maintain | Buy | 2026-01-16 |
| Wells Fargo | Maintain | Overweight | 2026-01-14 |
| JP Morgan | Maintain | Neutral | 2025-11-06 |
| Baird | Maintain | Outperform | 2025-11-06 |
| BMO Capital | Maintain | Outperform | 2025-11-06 |
| Jefferies | Maintain | Buy | 2025-11-06 |
| Wells Fargo | Maintain | Overweight | 2025-10-14 |
| Needham | Maintain | Buy | 2025-10-02 |
| Barclays | Maintain | Overweight | 2025-10-02 |
| UBS | Maintain | Neutral | 2025-09-15 |
The consensus among analysts is predominantly positive, with a majority rating FICO as Buy or Outperform. Neutral ratings appear limited, and there are no Sell or Strong Sell recommendations, indicating steady confidence in the stock.
Consumer Opinions
Consumers generally appreciate Fair Isaac Corporation for its innovative credit scoring solutions but express concerns about pricing and customer support.
| Positive Reviews | Negative Reviews |
|---|---|
| “FICO scores have been instrumental in improving my credit decisions.” | “Customer service response times are often slow.” |
| “Their credit scoring models are accurate and widely accepted.” | “The cost of services can be quite high for small businesses.” |
| “Integration with financial platforms is seamless and reliable.” | “Some updates caused temporary disruptions in service.” |
Overall, users value FICO’s reliable and industry-standard credit scoring but frequently mention the need for better customer support and more affordable pricing options.
Risk Analysis
Below is a summary table of key risks associated with Fair Isaac Corporation (FICO), highlighting likelihood and potential effects on investment value:
| Category | Description | Probability | Impact |
|---|---|---|---|
| Financial Health | High debt-to-assets ratio (165%) risks solvency despite strong Altman Z-Score | Moderate | High |
| Profitability | Unfavorable return on equity (-37.34%) signals potential shareholder losses | High | Moderate |
| Valuation | Elevated price-to-earnings ratio (55.64) suggests overvaluation risk | High | Moderate |
| Liquidity | Current ratio below 1 (0.83) indicates possible short-term liquidity issues | Moderate | Moderate |
| Dividend Policy | No dividend yield may deter income-focused investors | High | Low |
| Market Volatility | Beta of 1.29 implies higher sensitivity to market swings | High | Moderate |
FICO’s strong Altman Z-Score (about 12) places it in a safe zone for bankruptcy risk, but its very high leverage and weak return on equity remain concerns. The relatively high valuation multiples and liquidity metrics warrant caution. Investors should weigh these factors carefully in portfolio allocation.
Should You Buy Fair Isaac Corporation?
Fair Isaac Corporation appears to be generating robust value creation supported by a durable competitive moat with growing profitability. Despite a challenging leverage profile and mixed rating signals, its strong Altman Z-Score and Piotroski score suggest financial resilience, indicating a C+ overall rating.
Strength & Efficiency Pillars
Fair Isaac Corporation exhibits strong profitability and financial robustness, with a net margin of 32.75% and an EBIT margin of 47.03%, underscoring efficient cost management and pricing power. Its return on invested capital (ROIC) stands at an impressive 52.96%, comfortably exceeding the weighted average cost of capital (WACC) at 9.46%, marking the company as a clear value creator. The Altman Z-Score of 11.99 places it securely in the safe zone, while a Piotroski Score of 7 signals strong financial health. These metrics collectively indicate a firm with durable competitive advantages and growing profitability.
Weaknesses and Drawbacks
Despite operational strengths, Fair Isaac faces valuation and liquidity concerns that may temper investor enthusiasm. The price-to-earnings ratio at 55.64 signals an expensive premium valuation, potentially limiting upside in a market correction. Additionally, the current ratio of 0.83 points to liquidity risk, suggesting the company may struggle to cover short-term liabilities. Negative price-to-book ratios and unfavorable debt-to-equity scores complicate the capital structure picture, hinting at accounting or financial leverage issues. The lack of dividend yield also reduces appeal for income-focused investors.
Our Verdict about Fair Isaac Corporation
The long-term fundamental profile for Fair Isaac Corporation appears favorable, driven by strong profitability and value creation. Coupled with a bullish overall stock trend and recent slight buyer dominance, the company may appear attractive for long-term exposure. However, given the deceleration in price momentum and recent modest price declines, potential investors could consider a cautious approach, evaluating entry points carefully to manage valuation and liquidity risks.
Disclaimer: This content is for informational purposes only and does not constitute financial, investment, or other professional advice. Investing in financial markets involves a significant risk of loss, and past performance is not indicative of future results.
Additional Resources
- Fair Isaac Corporation (FICO): A Bull Case Theory – Yahoo Finance (Jan 20, 2026)
- Fair Isaac (FICO) Reports Next Week: Wall Street Expects Earnings Growth – Finviz (Jan 21, 2026)
- Fair Isaac Corporation (FICO) Stock Analysis: Navigating Growth with a Potential 32% Upside – DirectorsTalk Interviews (Jan 22, 2026)
- Fair Isaac Corporation Announces Date for Reporting of First Quarter Fiscal 2026 Financial Results – Business Wire (Jan 14, 2026)
- Why Fair Isaac Corporation Is Soaring Today – The Motley Fool (Oct 02, 2025)
For more information about Fair Isaac Corporation, please visit the official website: fico.com