Home > Analyses > Technology > F5, Inc.
F5, Inc. powers the backbone of digital experiences by securing and optimizing applications that millions rely on daily. As a pioneer in multi-cloud application security and delivery, F5 leads the software infrastructure industry with flagship products like BIG-IP and NGINX, renowned for innovation and robust performance. With evolving cloud architectures reshaping IT landscapes, I explore whether F5’s strong fundamentals can sustain its market influence and justify its valuation amid growing competition and technological shifts.

Table of contents
Business Model & Company Overview
F5, Inc., founded in 1996 and headquartered in Seattle, WA, stands as a leader in the Software – Infrastructure sector. The company delivers a cohesive ecosystem of multi-cloud application security and delivery solutions that secure and optimize network applications across on-premises and public cloud environments. Its portfolio ranges from BIG-IP hardware appliances to NGINX software products, reinforcing its mission to enhance application performance and availability globally.
F5’s revenue engine blends hardware sales with robust software licenses and recurring services, including consulting and technical support. Its strategic footprint spans the Americas, Europe, the Middle East, Africa, and Asia Pacific, supported by partnerships with top public cloud providers like AWS, Azure, and Google Cloud. This diversified model creates a strong economic moat, securing F5’s role as a pivotal player shaping the future of network application security and delivery.
Financial Performance & Fundamental Metrics
In this section, I analyze F5, Inc.’s income statement, key financial ratios, and dividend payout policy to assess its overall financial health and shareholder value.
Income Statement
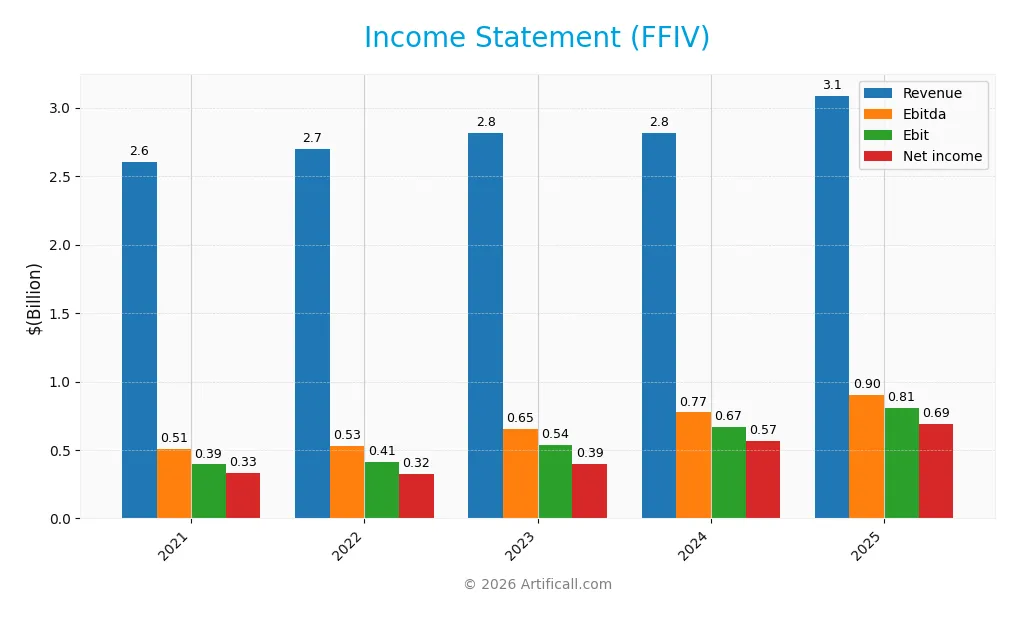
The following table summarizes the key income statement figures for F5, Inc. (ticker: FFIV) over the past five fiscal years, providing a clear view of its financial performance.
| 2021 | 2022 | 2023 | 2024 | 2025 | |
|---|---|---|---|---|---|
| Revenue | 2.60B | 2.70B | 2.81B | 2.82B | 3.09B |
| Cost of Revenue | 493M | 540M | 593M | 558M | 564M |
| Operating Expenses | 1.72B | 1.74B | 1.75B | 1.59B | 1.76B |
| Gross Profit | 2.11B | 2.16B | 2.22B | 2.26B | 2.52B |
| EBITDA | 509M | 527M | 651M | 774M | 901M |
| EBIT | 394M | 412M | 538M | 667M | 808M |
| Interest Expense | 0 | 0 | 0 | 0 | 0 |
| Net Income | 331M | 322M | 395M | 567M | 692M |
| EPS | 5.46 | 5.34 | 6.59 | 9.65 | 11.95 |
| Filing Date | 2021-11-16 | 2022-11-15 | 2023-11-14 | 2024-11-18 | 2025-11-25 |
Income Statement Evolution
From 2021 to 2025, F5, Inc. displayed consistent revenue growth, reaching $3.09B in 2025, up 18.6% overall. Net income more than doubled, rising 109% to $692M, reflecting strong margin expansion. Gross margin remained favorable at 81.7%, and net margin improved substantially to 22.4%, indicating enhanced profitability and operational efficiency over the period.
Is the Income Statement Favorable?
The 2025 income statement shows robust fundamentals with revenue growth of 9.7% and net income growth of 22.4% year-over-year. EBIT margin at 26.2% and net margin at 22.4% are favorable, supported by zero interest expense. Despite operating expenses growing in line with revenue, the company’s earnings per share surged 23.7%, confirming strong profitability and efficient cost management. Overall, the income statement is assessed as favorable.
Financial Ratios
The following table presents key financial ratios for F5, Inc. (ticker: FFIV) over the fiscal years 2021 to 2025, reflecting profitability, valuation, liquidity, leverage, and efficiency metrics:
| Ratios | 2021 | 2022 | 2023 | 2024 | 2025 |
|---|---|---|---|---|---|
| Net Margin | 13% | 12% | 14% | 20% | 22% |
| ROE | 14% | 13% | 14% | 18% | 19% |
| ROIC | 9% | 9% | 10% | 13% | 14% |
| P/E | 36.4 | 27.1 | 24.4 | 22.8 | 26.9 |
| P/B | 5.1 | 3.5 | 3.4 | 4.1 | 5.2 |
| Current Ratio | 1.16 | 1.04 | 1.26 | 1.42 | 1.56 |
| Quick Ratio | 1.14 | 1.00 | 1.23 | 1.36 | 1.51 |
| D/E | 0.30 | 0.27 | 0.10 | 0.08 | 0.06 |
| Debt-to-Assets | 14% | 13% | 5% | 4% | 4% |
| Interest Coverage | 0 | 0 | 0 | 0 | 0 |
| Asset Turnover | 0.52 | 0.51 | 0.54 | 0.50 | 0.49 |
| Fixed Asset Turnover | 6.0 | 6.8 | 7.7 | 8.6 | 9.0 |
| Dividend Yield | 0% | 0% | 0% | 0% | 0% |
Evolution of Financial Ratios
From 2021 to 2025, F5, Inc.’s Return on Equity (ROE) showed consistent improvement, rising from 14.03% to 19.28%, indicating enhanced profitability. The Current Ratio increased steadily from 1.16 to 1.56, reflecting stronger short-term liquidity. Meanwhile, the Debt-to-Equity Ratio significantly decreased from 0.30 to 0.06, signaling lower leverage and financial risk over the period.
Are the Financial Ratios Fovorable?
In 2025, F5, Inc. displayed generally favorable financial ratios, with strong profitability markers such as a 22.42% net margin and 19.28% ROE. Liquidity ratios like the Current Ratio (1.56) and Quick Ratio (1.51) were also favorable, alongside a low Debt-to-Equity Ratio of 0.06. However, valuation metrics such as the Price-to-Earnings (26.91) and Price-to-Book (5.19) ratios were unfavorable, while asset turnover of 0.49 was also weak. Overall, 64.29% of key ratios were positive, supporting a favorable financial position.
Shareholder Return Policy
F5, Inc. does not pay dividends, reflecting a strategic focus on reinvestment and growth rather than immediate income distribution. Despite this, the company maintains substantial free cash flow, supporting potential share buybacks as a form of shareholder return.
This approach aligns with sustainable long-term value creation by prioritizing capital allocation towards business expansion and innovation, while share repurchases provide a flexible mechanism to return value without fixed obligations.
Score analysis
The following radar chart illustrates F5, Inc.’s key financial scores across valuation, profitability, and leverage metrics:
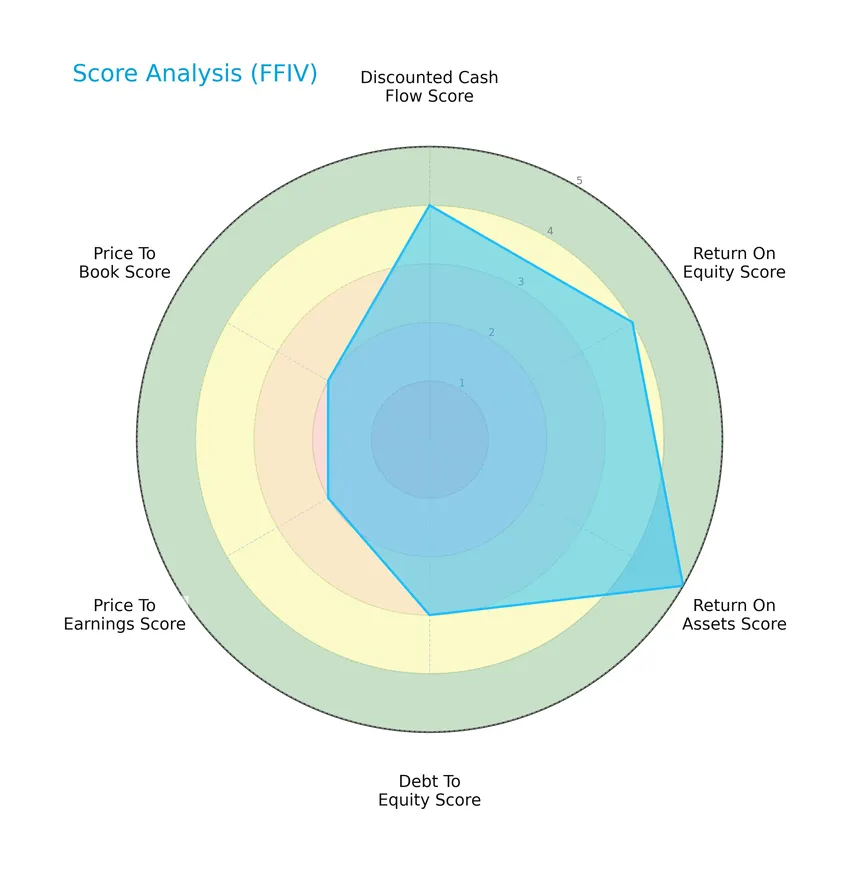
F5, Inc. demonstrates favorable scores in discounted cash flow (4) and return on equity (4), with a very favorable return on assets score (5). The debt-to-equity score is moderate (3), while valuation metrics such as price-to-earnings and price-to-book scores are also moderate at 2 each.
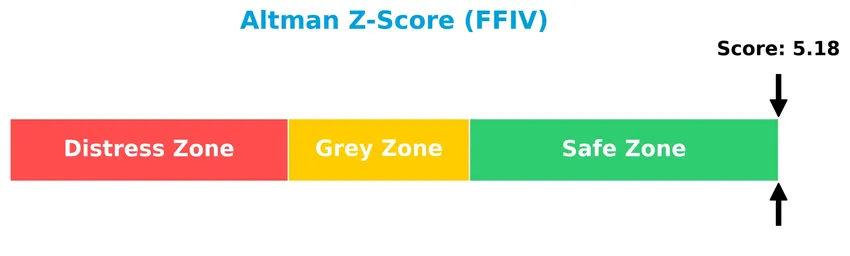
Analysis of the company’s bankruptcy risk
F5, Inc. is positioned in the safe zone according to its Altman Z-Score, indicating a low risk of bankruptcy:
Is the company in good financial health?
The Piotroski Score diagram below reflects F5, Inc.’s financial strength based on nine key criteria:

With a Piotroski Score of 7, the company is considered to have strong financial health, indicating solid profitability, leverage, liquidity, and operational efficiency.
Competitive Landscape & Sector Positioning
This analysis examines F5, Inc.’s strategic position within the software infrastructure sector, focusing on revenue segments, key products, and main competitors. I will assess whether F5, Inc. maintains a competitive advantage over its peers based on its current market positioning and strengths.
Strategic Positioning
F5, Inc. maintains a diversified product portfolio combining hardware, software, and services, with FY2025 revenues of $1.51B in products and $1.58B in services. Geographically, it operates globally, generating $1.82B in the Americas, $827M in EMEA, and $537M in Asia Pacific, reflecting broad international exposure.
Revenue by Segment
This pie chart illustrates F5, Inc.’s revenue distribution between Product and Service segments for the fiscal year 2025, highlighting their respective contributions.
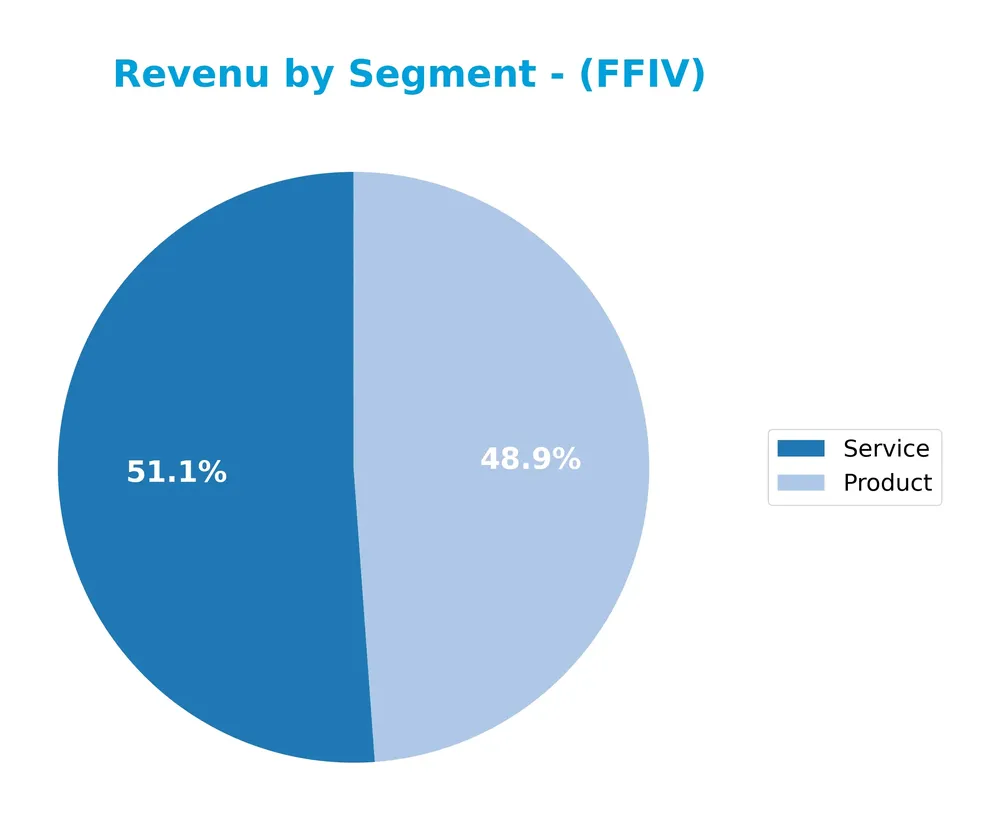
In 2025, F5, Inc. generated $1.51B from Product sales and $1.58B from Services, showing steady growth in both areas. Service revenue remains the largest contributor but the Product segment experienced a notable acceleration, increasing from $1.27B in 2024 to $1.51B in 2025. This suggests a balanced revenue mix with a slight shift towards products, reducing concentration risk and supporting overall business resilience.
Key Products & Brands
The following table presents F5, Inc.’s key products and brands along with their descriptions:
| Product | Description |
|---|---|
| BIG-IP Appliances | Hardware and software solutions for application security, delivery, and traffic management. |
| VIPRION Chassis | Scalable hardware platform supporting modular application delivery and security modules. |
| Local Traffic Manager (LTM) | Software module managing network traffic and optimizing application availability and performance. |
| DNS Services | Solutions for domain name system management to enhance application reliability and security. |
| Advanced Firewall Manager | High-performance firewall solution integrated with hardware and software architectures. |
| Policy Enforcement Manager | Software managing application access policies and security enforcement. |
| Application Security Manager | Software providing comprehensive application layer security to protect against attacks and vulnerabilities. |
| Access Policy Manager | Access control solution managing user authentication and authorization. |
| NGINX Plus | Commercial version of NGINX web server offering advanced load balancing and application delivery features. |
| NGINX Controller | Management and monitoring platform for NGINX Plus deployments. |
| Shape Defense & Enterprise Defense | Security offerings focused on threat intelligence and mitigation. |
| Secure Web Gateway | Cloud-based web security solution protecting users from web threats. |
| Silverline DDoS & Application Security | Cloud services for distributed denial-of-service (DDoS) protection and application security. |
| Online Fraud and Abuse Prevention | Solutions targeting prevention of online fraud and abuse in digital applications. |
| Professional Services | Consulting, training, installation, maintenance, and technical support services related to products. |
F5, Inc.’s product portfolio combines hardware appliances, software modules, cloud-based security services, and professional support, catering to enterprise and public sector needs for multi-cloud application security and delivery.
Main Competitors
There are 32 competitors in total; below are the top 10 leaders by market capitalization:
| Competitor | Market Cap. |
|---|---|
| Microsoft Corporation | 3.52T |
| Oracle Corporation | 553B |
| Palantir Technologies Inc. | 383B |
| Adobe Inc. | 140B |
| Palo Alto Networks, Inc. | 120B |
| CrowdStrike Holdings, Inc. | 113B |
| Synopsys, Inc. | 92B |
| Cloudflare, Inc. | 69B |
| Fortinet, Inc. | 59B |
| Block, Inc. | 40B |
F5, Inc. ranks 20th among 32 competitors in the Technology sector, with a market capitalization just 0.43% of Microsoft’s, the top player. Its market cap is below both the average of the top 10 competitors (508B) and the sector median (18.8B). The company is positioned 1.64% below its nearest competitor above it, indicating a moderate gap in scale within its peer group.
Comparisons with competitors
Check out how we compare the company to its competitors:
Does FFIV have a competitive advantage?
F5, Inc. presents a clear competitive advantage, demonstrated by a very favorable moat status, with a ROIC exceeding its WACC by 5.58% and a strong upward ROIC trend of 51.8% over 2021-2025. This indicates efficient capital use and sustained value creation in the software infrastructure sector.
Looking ahead, F5’s multi-cloud application security and delivery solutions position it well to capitalize on expanding markets and opportunities, including partnerships with major public cloud providers such as AWS, Microsoft Azure, and Google Cloud Platform. Continued innovation in application security products and geographic revenue growth support a positive future outlook.
SWOT Analysis
This SWOT analysis highlights F5, Inc.’s key strategic factors to inform investment decisions.
Strengths
- strong multi-cloud application security portfolio
- favorable income and margin growth
- durable competitive advantage with growing ROIC
Weaknesses
- high price-to-earnings and price-to-book ratios
- low asset turnover
- no dividend yield
Opportunities
- expanding cloud adoption globally
- strategic partnerships with major cloud providers
- increasing demand for cybersecurity solutions
Threats
- intense competition in software infrastructure
- rapid technological changes
- geopolitical risks affecting global sales
F5 demonstrates robust financial health and a durable competitive moat, positioning it well for growth in cloud security markets. However, valuation metrics and operational efficiency warrant caution, and investors should monitor competitive and geopolitical risks closely.
Stock Price Action Analysis
The weekly stock chart for F5, Inc. (ticker: FFIV) displays price movement and volume trends over the past 12 months:
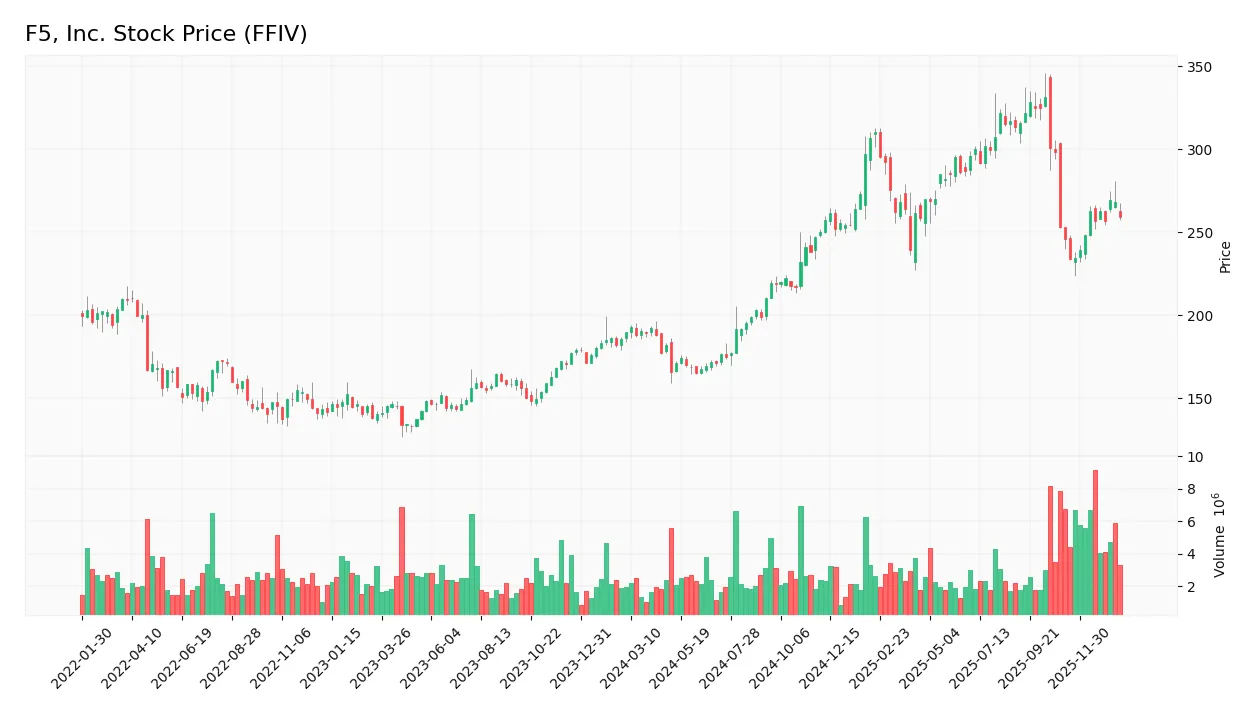
Trend Analysis
Over the past 12 months, FFIV’s stock price increased by 36.47%, indicating a bullish trend with clear acceleration. The price ranged from a low of 165.57 to a high of 331.75, with high volatility reflected by a standard deviation of 48.76. Recent weeks show a moderate 5.5% gain with a positive slope of 2.9, confirming ongoing upward momentum.
Volume Analysis
In the last three months, trading volume has been increasing with a total buyer volume of 33.4M and seller volume of 33.7M, resulting in neutral buyer dominance at 49.84%. This balanced activity suggests cautious investor sentiment and stable market participation without a clear directional bias.
Target Prices
The consensus target prices for F5, Inc. reflect a positive outlook among analysts.
| Target High | Target Low | Consensus |
|---|---|---|
| 352 | 295 | 323.25 |
Analysts expect F5’s stock to trade between 295 and 352, with a consensus target around 323, indicating moderate growth potential.

Don’t Let Luck Decide Your Entry Point
Optimize your entry points with our advanced ProRealTime indicators. You’ll get efficient buy signals with precise price targets for maximum performance. Start outperforming now!
Analyst & Consumer Opinions
This section examines the latest analyst ratings and consumer feedback to provide a balanced view of F5, Inc.’s market perception.
Stock Grades
Here is the latest overview of F5, Inc.’s stock grades from recognized financial institutions:
| Grading Company | Action | New Grade | Date |
|---|---|---|---|
| JP Morgan | Upgrade | Overweight | 2026-01-15 |
| RBC Capital | Upgrade | Outperform | 2026-01-05 |
| Piper Sandler | Upgrade | Overweight | 2026-01-05 |
| Morgan Stanley | Maintain | Equal Weight | 2025-12-17 |
| Morgan Stanley | Maintain | Equal Weight | 2025-10-28 |
| Needham | Downgrade | Hold | 2025-10-28 |
| Barclays | Maintain | Equal Weight | 2025-10-28 |
| Piper Sandler | Maintain | Neutral | 2025-10-28 |
| B of A Securities | Maintain | Underperform | 2025-10-28 |
| RBC Capital | Maintain | Sector Perform | 2025-10-28 |
Overall, recent upgrades from JP Morgan, RBC Capital, and Piper Sandler indicate a more positive outlook, contrasting with earlier holds and downgrades. The consensus remains cautious, with the majority rating the stock as Hold.
Consumer Opinions
Consumers express a mix of appreciation and criticism towards F5, Inc., reflecting its strengths in innovation alongside some operational challenges.
| Positive Reviews | Negative Reviews |
|---|---|
| Strong performance and reliability of network products | Customer support can be slow and unresponsive |
| Innovative solutions that enhance security measures | Pricing is considered high compared to competitors |
| Easy integration with existing IT infrastructure | Occasional software bugs reported in updates |
Overall, F5, Inc. is praised for its cutting-edge technology and robust product performance, while customers frequently highlight concerns about support responsiveness and premium pricing.
Risk Analysis
Below is a summary table outlining the key risks associated with investing in F5, Inc., emphasizing their likelihood and potential impact:
| Category | Description | Probability | Impact |
|---|---|---|---|
| Market Valuation | Elevated P/E (26.91) and P/B (5.19) ratios suggest potential overvaluation risk. | Medium | High |
| Competitive Pressure | Intense competition in multi-cloud application security and delivery markets could affect growth. | Medium | Medium |
| Technology Change | Rapid innovation in cloud infrastructure may require heavy R&D to maintain market position. | Medium | High |
| Liquidity Risk | Current and quick ratios are favorable, indicating low short-term liquidity risk. | Low | Low |
| Debt Levels | Very low debt-to-equity (0.06) and debt-to-assets (3.65%) minimize financial leverage risk. | Low | Low |
| Dividend Policy | No dividend yield may deter income-focused investors. | Medium | Low |
| Economic Downturn | Global economic shifts could reduce enterprise IT spending, impacting revenue. | Medium | Medium |
The most significant risks stem from valuation concerns and technology shifts, as F5 operates in a fast-evolving sector where innovation and competitive dynamics strongly influence future performance. Despite financial strength and a safe bankruptcy risk zone, investors should monitor market valuation levels and industry trends carefully.
Should You Buy F5, Inc.?
F5, Inc. appears to be demonstrating robust profitability with growing ROIC, suggesting a durable competitive moat and strong value creation. Despite moderate leverage metrics, its debt profile seems manageable. Overall, the company’s financial health could be seen as very favorable, with an A- rating.
Strength & Efficiency Pillars
F5, Inc. exhibits robust profitability and financial health, underscored by a net margin of 22.42%, a return on equity (ROE) of 19.28%, and a return on invested capital (ROIC) of 13.94%. Notably, the ROIC surpasses the weighted average cost of capital (WACC) of 8.36%, confirming F5 as a clear value creator. The company’s Altman Z-score of 5.18 places it well within the safe zone, while a Piotroski score of 7 signals strong financial fundamentals. These metrics collectively point to operational efficiency and durable competitive advantages.
Weaknesses and Drawbacks
Despite strong fundamentals, valuation metrics present cautionary signals. The price-to-earnings (P/E) ratio stands at 26.91 and the price-to-book (P/B) ratio at 5.19, both flagged as unfavorable, indicating a premium market valuation that could limit upside potential. Although leverage ratios are conservative, with a debt-to-equity ratio of 0.06 and a current ratio of 1.56, the company’s asset turnover ratio of 0.49 is below optimal, suggesting less efficient asset utilization. Additionally, the absence of dividend yield may deter income-focused investors.
Our Verdict about F5, Inc.
F5, Inc. presents a fundamentally favorable long-term profile, supported by strong profitability, healthy financial metrics, and value creation. The overall bullish stock trend with accelerating price gains reinforces this outlook. Recent market behavior shows a near-neutral buyer dominance at 49.84%, suggesting cautious trading activity. Thus, while the company’s profile may appear attractive for long-term exposure, potential investors might consider a measured approach to timing their entry.
Disclaimer: This content is for informational purposes only and does not constitute financial, investment, or other professional advice. Investing in financial markets involves a significant risk of loss, and past performance is not indicative of future results.
Additional Resources
- F5, Inc. $FFIV Shares Sold by UniSuper Management Pty Ltd – MarketBeat (Jan 24, 2026)
- F5 Shareholder Alert: ClaimsFiler Reminds Investors With Losses In Excess Of $100,000 Of Lead Plaintiff Deadline In Class Action Lawsuits Against F5, Inc. – FFIV – PR Newswire (Jan 24, 2026)
- What Analyst Projections for Key Metrics Reveal About F5 (FFIV) Q1 Earnings – Yahoo Finance (Jan 22, 2026)
- F5, INC. (NASDAQ: FFIV) DEADLINE ALERT – Bernstein Liebhard – GlobeNewswire (Jan 22, 2026)
- F5, Inc. (FFIV) Class Action Notice with February 17 Deadline – Intellectia AI (Jan 22, 2026)
For more information about F5, Inc., please visit the official website: f5.com